(完整word版)NS2网络仿真实验
NS2仿真实验报告
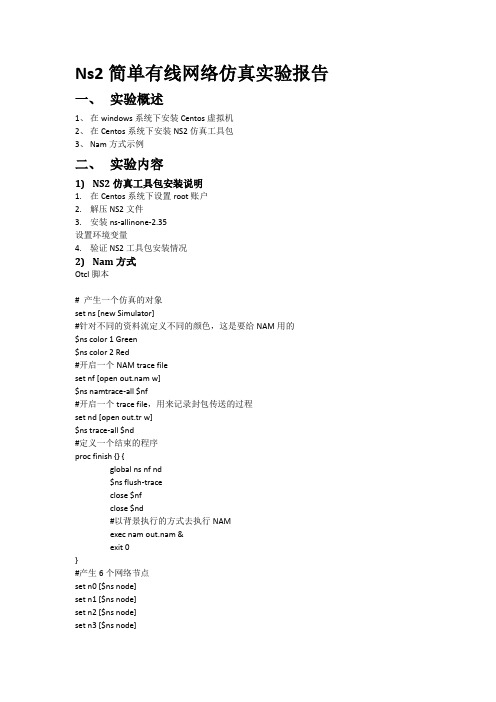
Ns2简单有线网络仿真实验报告一、实验概述1、在windows系统下安装Centos虚拟机2、在Centos系统下安装NS2仿真工具包3、Nam方式示例二、实验内容1)NS2仿真工具包安装说明1.在Centos系统下设置root账户2.解压NS2文件3.安装ns-allinone-2.35设置环境变量4.验证NS2工具包安装情况2)Nam方式Otcl脚本# 产生一个仿真的对象set ns [new Simulator]#针对不同的资料流定义不同的颜色,这是要给NAM用的$ns color 1 Green$ns color 2 Red#开启一个NAM trace fileset nf [open out.nam w]$ns namtrace-all $nf#开启一个trace file,用来记录封包传送的过程set nd [open out.tr w]$ns trace-all $nd#定义一个结束的程序proc finish {} {global ns nf nd$ns flush-traceclose $nfclose $nd#以背景执行的方式去执行NAMexec nam out.nam &exit 0}#产生6个网络节点set n0 [$ns node]set n1 [$ns node]set n2 [$ns node]set n3 [$ns node]set n4 [$ns node]set n5 [$ns node]#把节点连接起来$ns duplex-link $n0 $n2 2Mb 10ms DropTail$ns duplex-link $n1 $n2 2Mb 10ms DropTail$ns duplex-link $n2 $n3 1.7Mb 20ms DropTail$ns duplex-link $n3 $n4 1.7Mb 30ms DropTail$ns duplex-link $n3 $n5 1.5Mb 30ms DropTail#设定ns2到n3之间的Queue Size为10个封包大小$ns queue-limit $n2 $n3 10$ns queue-limit $n3 $n4 5#$ns queue-limit $n3 $n5 10#设定节点的位置,这是要给NAM用的$ns duplex-link-op $n0 $n2 orient right-down$ns duplex-link-op $n1 $n2 orient right-up$ns duplex-link-op $n2 $n3 orient right$ns duplex-link-op $n3 $n4 orient right-up$ns duplex-link-op $n3 $n5 orient right-down#观测n2到n3之间queue的变化,这是要给NAM用的$ns duplex-link-op $n2 $n3 queuePos 0.5#建立一条n0-n5TCP的联机set tcp [new Agent/TCP]$ns attach-agent $n0 $tcpset sink [new Agent/TCPSink]$ns attach-agent $n5 $sink$ns connect $tcp $sink#在NAM中,TCP的联机会以Green表示$tcp set fid_ 1#在TCP联机之上建立FTP应用程序set ftp [new Application/FTP]$ftp attach-agent $tcp$ftp set type_ FTP#建立一条UDP的联机set udp [new Agent/UDP]$ns attach-agent $n1 $udpset null [new Agent/Null]$ns attach-agent $n3 $null$ns connect $udp $null#在NAM中,UDP的联机会以红色表示$udp set fid_ 2#在UDP联机之上建立CBR应用程序set cbr [new Application/Traffic/CBR]$cbr attach-agent $udp$cbr set type_ CBR$cbr set packet_size_ 1000$cbr set rate_ 1mb$cbr set random_ false#设定FTP和CBR资料传送开始和结束时间$ns at 0.1 "$cbr start"$ns at 1.0 "$ftp start"$ns at 4.0 "$ftp stop"$ns at 4.5 "$cbr stop"#结束TCP的联机(不一定需要写下面的程序代码来实际结束联机)$ns at 4.5 "$ns detach-agent $n0 $tcp ; $ns detach-agent $n3 $sink"#在仿真环境中,5秒后去呼叫finish来结束仿真(这样要注意仿真环境中#的5秒并不一定等于实际仿真的时间$ns at 5.0 "finish"#执行仿真$ns run3)仿真结果仿真结束后,会产生out.nam和out.tr两个档案用来把仿真的过程用可视化的方式呈现出来4)数据分析1.End-to-End Delay把测量CBR封包端点到端点间延迟时间的awk程序,写在档案measure-delay.awk档案中BEGIN {#程序初始化,设定一变量以记录目前最高处理封包的ID。
NS2网络仿真实验

NS2网络仿真实验实验目的:通过修改NS2的TCP协议代码,来简单的观察窗口阈值的不同算法对网络资源利用率的影响。
实验步骤:1. 实验环境搭建(1)系统环境:虚拟机:virtrulbox;操作系统:linux/ubuntu 10.04工作目录:/home/wangtao/workspace/(2)NS2安装与使用:下载NS2软件包到工作目录,地址/sourceforge/nsnam/ns-allinone-2.33.tar.gz解压(注:以下斜体字为命令行命令)tar -zxf ns-allinone-2.33.tar.gzcd ns-allinone-2.33./install(中间的两个bug已经修改,此处忽略)耐心等待安装完毕后将出现如下画面说明安装正常:接下来是系统环境配置,重新进入终端cd ~vim .bashrc(如果没有安装vim最好安装一下,sudo apt-get install vim)在打开的.bashrc的末尾加上以下内容:PATH="$PATH:/home/wangtao/worksapce/ns-allinone-2.33/bin:/home/wangtao/worksapce/ns-a llinone-2.33/tcl8.4.18/unix"exportLD_LIBRARY_PATH="$LD_LIBRARY_PAHT:/home/wangtao/worksapce/ns-allinone-2.33/otcl-1.13,/ home/wangtao/worksapce/ns-allinone-2.33/lib"exportTCL_LIBRARY="$TCL_LIBRARY:/home/wangtao/worksapce/ns-allinone-2.33/tcl8.4.18/library"保存并退出,重新进入终端安装xgraphsudo apt-get install xgraph运行一个简单的例子,以证明环境安装完成:ns /home/wangtao/workspace/ ns-allinone-2.33/tcl/ex/simple.tcl出现如下图说明成功:2.修改代码vim /home/wangtao/workspace/ns-allinone-2.33/tcp/(将窗口阈值一半变为的窗口阈值1/3——wt_)第一处:……if (cwnd_ < ssthresh_)slowstart = 1;if (precision_reduce_) {//halfwin = windowd() / 2; //wangtaohalfwin = windowd() / 3;第二处:……} else {int temp;//temp = (int)(window() / 2);//wangtaotemp = (int)(window() / 3);halfwin = (double) temp;……第三处:……switch (how) {case 0:/* timeouts *///ssthresh_ = int( window() / 2 );//wangtaossthresh_ = int( window() / 3 );if (ssthresh_ < 2)ssthresh_ = 2;cwnd_ = int(wnd_restart_);break;case 1:……第四处……case 4:/* Tahoe dup acks *///ssthresh_ = int( window() / 2 );//wangtaossthresh_ = int( window() / 3 );if (ssthresh_ < 2)ssthresh_ = 2;cwnd_ = 1;break;default:abort();……3.编写tcl代码,实现一个简单的3节点,2条链路的网络网络如下图,具体代码见附件中的源代码。
基于NS2的无线自组网路由协议的研究与仿真
仿真工具NS2
NS2(Network Simulator version 2)是面向 对象的、 离散事件驱动的网络环境模拟器,主要用 于解决网络研究方面的问题。NS2提供了在无线或有 线网络上的TCP/IP、路由、队列管理、IP QoS等多 种协议的模拟。
NS2使用C++和OTcl(具有面向对象特性的Tcl脚 本程序设计语言)作为开发语言。
不同平台对NS2的支持情况
仿真流程
无线自组网路由协议
无线自组网的路由协议作为影响网络性能的一 个重要因素,是确保移动自组网络正确运行的关键。 对该领域进行深入而广泛的研究将为移动自组网的 应用提供重要科学依据。
分类:根据源端何时获得路由信息
仿真的三种路由协议
❖ 动态源路由协议DSR ❖ 无线自组网按需平面距离矢量路由协议
❖ 在拓扑变化频繁的无线自组网环境中,采用 按需路由协议可减少实时路由维护的信道资 源消耗;在网络拓扑结构相对稳定的环境中, 如果业务对实时性要求较高时,应尽量采用 表驱动方式的路由协议。
主要内容:
无线自组网 仿真工具NS2 无线自组网路由协议 路由仿真
无线自组网
无线自组网是一个多跳、临时、可自 由移动无中心网络。它不需要现有信息 基础网络设施的支持,可以在任何时候、 任何地点快速构建。
特点: ❖ 自组织 ❖ 动态拓扑 ❖ 多跳路由 ❖ 无中心且所有节点地位平等 ❖ 灵活性好
应用领域: ❖ 军事应用 ❖ 无线传感器网络 ❖ 个人通信 ❖ 移动会议 ❖ 应用于紧急和突发场合 ❖ 与蜂窝移动通信系统等现有移动通
AODV ❖ 目的序列距离矢量路由协 NhomakorabeaDSDV
性能评价指标
丢包率 端到端时延 路由开销 吞吐量
基于NS2的网络仿真实验教学研究-最新教育文档

基于NS2的网络仿真实验教学研究网络的发展日新月异,作为电气信息类和计算机类专业的核心专业课――计算机网络,需要教师在教学的过程中不断更新和追踪最新网络技术,以更加适应“计算机网络”教学的要求。
但目前计算机网络教学中存在两个方面的突出问题,首先,缺少必要的实验设备。
像路由器、网关等实验设备比较昂贵,一般的院校无法为学生配备,只能在教学的过程中安排较多的演示,学生无法更好地通过真正的实验环境亲自动手来理解和掌握网络通信原理、锻炼网络工程应用能力[1]。
其次,网络技术和产品的更新换代速度非常快,像近年来无线网络技术飞速发展,对于想学习和研究无线网络的学生而言,再依靠原有局域网环境已无法验证无线网络协议的正确性以及对无线网络性能进行直观、可靠的测试。
因此,尝试将网络仿真软件NS2(Network Simulator Version 2)运用到计算机网络课程教学中,利用NS2,特别是Nam 工具的动画演示可以清晰地向学生演示网络协议的运行过程。
通过NS2进行教学,学生可以直观的看到网络协议的行为,了解各种环境或因素对网络的影响,将抽象的网络概念形象化,把枯燥的网络原理具体化。
1NS2原理和结构NS2是由加州大学伯克利分校(University of California at Berkeley)开发的一种面向对象的、离散事件驱动的网络环境模拟器。
NS2是一款源代码开放且免费的模拟软件,是用于教学、网络研究与分析等方面的网络模拟工具,它内含离散事件模拟引擎,构件库丰富,可以构建并仿真分析整个协议栈的运行情况,也可使用自带的Nam 动画演示程序来观察网络的运行效果,它集成了多种网络协议(如TCP、UDP),业务类型(如FTP、Telnet、Web、CBR等),路由排队机制(如Droptail、RED),路由算法(如Dijkstra算法)可以对固定、无线、卫星以及混合等多种网络进行仿真,实现了绝大多数常见的网络协议以及链路层的模型,利用这些类的实例可以搭建起整个网络的模型。
NS2简单无线网络模拟实验报告

HUNAN CITY UNIVERSITYNS2与网络模拟实验报告实验题目:简单无线网络模拟 __专业: ____班级学号_____ _2015年 10月 27日1.实验目的•熟悉NS2网络模拟的基本操作流程•练习TCL脚本代码的编写•理解基本的无线网络节点的配置过程、以及数据流的发生2.实验原理NS2是指 Network Simulator version 2,NS(Network Simulator)是一种针对网络技术的源代码公开的、免费的软件模拟平台,研究人员使用它可以很容易的进行网络技术的开发,而且发展到今天,它所包含的模块几乎涉及到了网络技术的所有方面。
所以,NS成了目前学术界广泛使用的一种网络模拟软件。
此外,NS也可作为一种辅助教学的工具,已被广泛应用在了网络技术的教学方面。
因此,目前在学术界和教育界,有大量的人正在使用NS。
NS2是一种面向对象的网络仿真器,本质上是一个离散事件模拟器,由UC Berkeley开发而成。
它本身有一个虚拟时钟,所有的仿真都由离散事件驱动的。
目前NS2可以用于仿真各种不同的IP网,已经实现的一些仿真有网络传输协议,比如TCP和UDP, 流量产生器,比如FTP, Telnet, Web CBR和VBR;路由队列管理机制,比如Droptail, RED和CBQ;路由算法,比如AODV、DSDV、DSR等无线路由协议。
NS2也为进行局域网的仿真而实现了多播以及一些MAC 子层协议。
3.实验内容和步骤•打开虚拟机播放器VMware Player•打开播放Ubuntu虚拟机镜像(Ubuntu.vmx)•登录系统后,打开控制台Terminal输入下列命令:•cd Desktop/EXP/•ns 6-simple-wireless.tcl•模拟运行完毕后,动画演示器NAM自动打开,播放动画,观察模拟过程。
4.实验结论•截取NAM动画演示结果。
••详细解释TCL脚本文件中与无线网络相关的代码。
NS2仿真实验分析报告

NS2仿真实验分析报告一引言1 NS2简介NS2是一款开放源代码的网络模拟软件,最初由UC Berkeley开发。
它是一种向象的网络模拟器,它本质上是一个离散事件模拟器,其本身有一个模拟时钟,所有的模拟都由离散事件驱动。
其采用了分裂对象模型的开发机制,采用C++和OTcl两种语言进行开发。
它们之间采用Tclcl 进行自动连接和映射。
考虑效率和操作便利等因素,NS2将数据通道和控制通道的实现相分离。
为了减少分组和事件的处理时间,事件调度器和数据通道上的基本网络组件对象都使用C++编写,这些对象通过Tclcl映射对OTcl解释器可见。
目前NS2可以用于模拟各种不同的通信网络,它功能强大,模块丰富,已经实现的主要模块有:网络传输协议,如TCP和UDP;业务源流量产生器,如FTP、Telnet、CBR、We b和VBR;路由队列管理机制,如DropTail、RED和CBQ;路由算法;以及无线网络WLAN、移动IP和卫星通信网络等模块,也为进行局域网的模拟实现了多播协议以及一些MAC子层协议。
2 基本概念(1)RED:随机早期探测(Random Early Detect,RED)。
RED属于主动队列管(Active Queue Management, AQW),是目前常见的TCP上防止拥塞的手段。
它通过以一定概率丢失或标记报文来通知端系统网络的拥塞情况。
RED使用平均队列长度度量网络的拥塞程度,然后以线性方式将拥塞信息反馈给端系统。
RED使用最小阈值,最大阈值和最大概率等几个参数。
RED的基本思想是通过监控路由器输出端口队列的平均长度来探测拥塞,一旦发现拥塞逼近,就随机地选择连接来通知拥塞,使它们在队列溢出导致丢包之前减少拥塞窗口,降低发送数据速度,缓解网络拥塞。
RED配置在路由器监视网络流量以便避免拥塞,当拥塞即将发生时,它随机丢弃进来的分组,而不是等到队列缓冲区满是才开始丢弃所有进来的分组,这样可以最少化全局同步的发生。
NS2在无线网络实验教学中的应用word精品文档4页

NS2在无线网络实验教学中的应用基金项目:本文系2010-2013年重庆邮电大学教改项目“通信网络虚拟体验系统建设与实验课程开发”(项目编号:XJG1002)的研究成果。
无线网络技术[1]是当前计算机网络中的最热点的研究领域,也是一门理论性比较强的课程,在传统的实验室中开展实验教学比较困难。
现有的针对无线网络的实验设备,成本非常昂贵,而且代码保密,学生很难深入理解网络协议和算法。
为此,我们将网络仿真工具NS2引入无线网络实验教学中,利用NS2的动画效果动态演示节点的收发包过程,不但可以帮助学生深刻理解网络协议和算法,提高学生学习无线网络的兴趣,而且利用NS2代码开源的特点,还可以使得学生深入到协议和算法的具体实践中去,从而提高学生的编程能力,激发学生对无线网络协议验证、改进和开发的兴趣。
一、NS2的介绍网络模拟是进行网络技术研究的一种基本手段,是指采用软件对网络的协议、拓扑和性能进行模拟分析。
网络模拟可以在硬件条件不具备的情况下帮助科研人员快速学习、设计、分析和改进协议和算法。
此外,网络模拟还可以在不需要建立实际网络系统的情况下比较、评估和验证新旧协议和算法的性能。
目前,常见的网络仿真软件主要有OPNET、SPD、Qualnet 和NS2等。
所有的仿真软件都支持有大量的网络协议,但是OPNET、SPD和Qualnet均为商业化产品,价格昂贵。
而NS2属于开源软件,有着良好的开放性和可扩展性,因此在网络模拟中使用最为广泛。
NS[2]是由UC Berkeley大学开发的一种面向对象的网络环境模拟器,来源于1989年的Real Network Simulator项目,目前最流行的是版本2,即NS2(Network Simulator 2)。
经过全世界各地研究者多年来不断的努力和完善,NS2已经成为一个涉及网络各个方面的优秀的网络模拟工具。
NS2集成的大量无线网络协议,以及其强大的二次开发能力使得NS2已经成为无线网络学术研究最常用的仿真平台。
计算机网络ns2实验报告

课程:计算机网络项目:实验4 ns2 实验一、实验目的安装并运行网络仿真器NS2,了解其功能模块及配套工具的使用,掌握利用NS2进行网络仿真的方法,为进一步的网络系统性能分析设计创造良好的条件。
二、实验原理NS2(Network Simulator version 2,网络仿真软件第二版)是一种面向对象的网络仿真器,本质上是一个离散事件模拟器。
最早来源于1989年哥伦比亚大学开发的Real Network Simulator项目,是一款开源免费的网络模拟软件。
由加州大学伯克利分校(UC Berkeley)开发而成。
它本身有一个虚拟时钟,所有的仿真都由离散事件驱动的。
目前NS2 可用于仿真各种不同的通信网络。
已经实现的仿真模块有:网络传输协议,如TCP 和UDP;业务源流量产生器,如FTP、Telnet、Web CBR 和VBR;路由队列管理机制,如Droptai、RED和CBQ;路由算法,如Dijkstra,以及无线网络的WLAN,Ad hoc路由,移动IP 和卫星通信网络等。
NS2也为进行局域网的仿真而实现了多播以及一些MAC子层协议。
NS2使用C++和OTcl作为开发语言。
NS2可以说是OTcl的脚本解释器,它包含仿真事件调度器、网络组件对象库以及网络构建模型库等。
事件调度器用于计算仿真时间,并且激活事件队列中的当前事件,执行一些相关的事件,网络组件通过传递分组来相互通信,但这并不耗费仿真时间。
所有需要花费仿真时间来处理分组的网络组件都必须要使用事件调度器,它先为这个分组发出一个事件,然后等待这个事件被调度回来之后,才能做下一步的处理工作。
事件调度器的另一个用处就是计时。
由于效率的原因,NS2将数据通道和控制通道的实现相分离,为了减少分组和事件的处理时间,事件调度器和数据通道上的基本网络组件对象都使用C++写出并编译的,这些对象通过映射对OTcl解释器可见。
三、实验内容(1)安装ns-allinone-2.35(2)NS2仿真示例-nam方式四、实验结果与分析:建立一个OTcl脚本文件set ns [new Simulator] /建立对象$ns color 1 Blue /设定颜色$ns color 2 Redset nf [open out.nam w] /打开跟踪文件$ns namtrace-all $nfproc finish {} { /定义结束过程global ns nf$ns flush-traceclose $nfexec nam out.nam &exit 0}set ns0 [$ns node]set ns1 [$ns node]set ns2 [$ns node]set ns3 [$ns node]$ns duplex-link $ns0 $ns2 1Mb 10ms DropTail$ns duplex-link $ns1 $ns2 1Mb 10ms DropTail$ns duplex-link $ns3 $ns2 1Mb 10ms DropTail$ns duplex-link-op $ns0 $ns2 orient right-down$ns duplex-link-op $ns1 $ns2 orient right-up$ns duplex-link-op $ns2 $ns3 orient right$ns duplex-link-op $ns2 $ns3 queuePos 0.5set udp0 [new Agent/UDP] /建立代理UDP $udp0 set class_ 1$ns attach-agent $ns0 $udp0set cbr0 [new Application/Traffic/CBR]$cbr0 set packetSize_ 500$cbr0 set interval_ 0.005$cbr0 attach-agent $udp0set udp1 [new Agent/UDP]$udp1 set class_ 2$ns attach-agent $ns1 $udp1set cbr1 [new Application/Traffic/CBR]$cbr1 set packetSize_ 500$cbr1 set interval_ 0.005$cbr1 attach-agent $udp1set null0 [new Agent/Null] /建立代理NULL$ns attach-agent $ns3 $null0$ns connect $udp0 $null0$ns connect$udp1 $null0$ns at 0.5 "$cbr0 start" /传送数据$ns at 1.0 "$cbr1 start"$ns at 4.0 "$cbr1 stop"$ns at 4.5 "$cbr0 stop"$ns at 5.0 "finish" /调用结束过程$ns run /仿真结果如下:实验分析:系统从n0开始传送数据实验分析:系统从n1开始传送数据实验分析:采用FIFO机制丢包,丢弃n0发送的数据包(3)代码:set ns [new Simulator]set f0 [open out0.tr w]set f1 [open out1.tr w]set f2 [open out2.tr w]for { set i 0 } { $i<5 } {incr i} {set n$i [$ns node]}$ns duplex-link $n0 $n3 1Mb 100ms DropTail$ns duplex-link $n1 $n3 1Mb 100ms DropTail$ns duplex-link $n2 $n3 1Mb 100ms DropTail$ns duplex-link $n3 $n4 1Mb 100ms DropTailproc finish {} {global f0 f1 f2close $f0close $f1close $f2exec xgraph out0.tr out1.tr out2.tr -geometry 800x400 & exit 0}proc attach-expoo-traffic { node sink size burst idle rate } { set ns [Simulator instance]set source [new Agent/UDP]$ns attach-agent $node $sourceset traffic [new Application/Traffic/Exponential]$traffic set packetSize_ $size$traffic set burst_time_ $burst$traffic set idle_time_ $idle$traffic set rate_ $rate$traffic attach-agent $source$ns connect $source $sinkreturn $traffic}proc record {} {global sink0 sink1 sink2 f0 f1 f2set ns [Simulator instance]set time 0.5set bw0 [$sink0 set bytes_]set bw1 [$sink1 set bytes_]set bw2 [$sink2 set bytes_]set now [$ns now]puts $f0 "$now [expr $bw0/$time*8/1000000]"puts $f1 "$now [expr $bw1/$time*8/1000000]"puts $f2 "$now [expr $bw2/$time*8/1000000]"$sink0 set bytes_ 0$sink1 set bytes_ 0$sink2 set bytes_ 0$ns at [expr $now+$time] "record"}set sink0 [new Agent/LossMonitor]set sink1 [new Agent/LossMonitor]set sink2 [new Agent/LossMonitor]$ns attach-agent $n4 $sink0$ns attach-agent $n4 $sink1$ns attach-agent $n4 $sink2set source0 [attach-expoo-traffic $n0 $sink0 200 2s 1s 100k]set source1 [attach-expoo-traffic $n1 $sink1 200 2s 1s 200k]set source2 [attach-expoo-traffic $n2 $sink2 200 2s 1s 300k]$ns at 0.0 "record"$ns at 10.0 "$source0 start"$ns at 10.0 "$source1 start"$ns at 10.0 "$source2 start"$ns at 50.0 "$source0 stop"$ns at 50.0 "$source1 stop"$ns at 50.0 "$source2 stop"$ns at 60.0 "finish"$ns run结果如下:实验分析:三条数据流的峰值分别为0.1Mbit/s, 0.2Mbit/s,0.3Mbit/s五、实验总结在nam辅助分析工具中发现ftp1在零秒开始启动,ftp2在第三秒时刻开始启动,都在第十秒停止,这符合设计目标。
基于NS2的无线传感器网络软件仿真实验

中南大学信息科学与工程学院《无线传感器网络》课程设计题目名称:基于NS2的无线传感器网络软件仿真实验姓名:董嘉伟学号:03专业:物联网工程1002班组员:裘铖、施国豪指导教师:何小贤时间:2013、07、11目录●课程设计目的●课程设计内容●课程设计实验原理⏹WSN路由协议⏹WSN MAC层协议⏹修改的路由协议●课程设计小组分工●课程设计实验流程●课程设计实验结果分析●课程设计心得体会●课程设计总结●参考文献●源代码一、课程设计目的无线传感器网络是物联网的基本组成部分,是物联网用来感知和识别周围环境的信息生成和采集系统,传感器网络对信息处理来说如同人体的感觉突触一样重要。
为了方便感知和部署并提高网络的可扩展性,传感器网络一般采用无线通信方式,从而形成了节点之间可自组织拓扑结构的无线传感器网络。
本课程设计的目的综合应用学生所学知识,建立系统和完整的传感器网络概念,理解和巩固无线传感器网络基本理论、原理和方法,掌握无线传感器网络开发的基本技能。
二、课程设计内容软件仿真实验。
要求使用相关软件仿真一个无线传感器网络,要求如下:●自行参考相关资料,成功安装NS2(或OPNET也可以);●利用NS2自带的范例,构建一个100个节点的无线传感器网络,能够成功运行;最好能有界面显示;●利用利用NS2自带的范例或其它已有脚本,仿真上述无线传感器网络一种路由协议(例如一种多播路由协议);●利用利用NS2自带的范例或其它已有脚本,仿真上述无线传感器网络采用一种MAC协议;●修改或自行编写一个简单路由协议或MAC协议,并进行仿真运行。
三、课程设计实验原理a)WSN路由协议传统计算机网络对路由协议要求如下:正确性,健壮性,稳定性,公平性,最优性。
除此之外,无线传感器网络对路由协议更注重以下特殊要求:能源有效性,简单性,多路性。
无线传感器网络是以数据为中心(Data Centric)进行路由的,不同于传统Ad hoc网络以地址为中心(Address Centric)进行路由的模式。
NS2实验报告

NS2实验报告一、实验平台和环境本实验是在Windows XP操作系统平台下安装了Cygwin软件以模仿Linux 下的编程环境,然后在Cygwin模仿的环境中安装了ns-allinone-2.34软件包,该软件包包含nam、otcl、tcl、tclcl、tk以及xgraph等软件包和辅助分析工具。
二、实验步骤2.1 安装与配置1.安装cygwina)在cygwin官方网站下载setup.exe。
b)运行setup.exe,使用默认配置选择unix安装。
c)在选择安装组件时确认安装以下内容:XFree86-base, XFree86-bin,XFree86-prog,XFree86-lib, XFree86-etc,make,patch,perl,gcc,gcc-g++,gawk,gnuplot,tar 和gzip。
Diffstat,diffutils,libXmu,libXmu-devel,libXmu6,libXmuu1,X-startup-scriptsxorg-x11-basexorg-x11-binxorg-x11-develxorg-x11-bin-dllsxorg-x11-bin-lndirxorg-x11-etcxorg-x11-fencxorg-x11-fntsxorg-x11-libs-dataxorg-x11-xwin2.安装NS2a)在NS2官方网站下载ns2-allinone-2.34.tar.gz安装包。
b)将ns2-allinone-2.34.tar.gz拷贝放入cygwin用户目录下。
c)运行cygwin,命令行下输入tar xvfz ns2-allinone-2.34.tar.gz。
d)进入ns2-allinone-2.34目录,执行./install开始安装。
e)安装结束后,会提示设定PATH,LD_LIBRARY_PATH,TCL_LIBRARY等内容,可在用户目录下修改.bashrc文件,添加以下内容:export NS_HOME=/home/Administrator/ns-allinone-2.34export PATH=$NS_HOME/nam-1.13:$NS_HOME/tcl8.4.18/unix:$NS_HOME/tk8.4.18/unix:$NS_HOME/bin:$PATHexport LD_LIBRARY_PATH=$NS_HOME/tcl8.4.18/unix:$NS_HOME/tk8.4.18/unix:$NS_HOME/otcl-1.13:$NS_HOME/lib:$LD_LIBRARY_PATHexport TCL_LIBRARY=$NS_HOME/tcl8.4.18/libraryf)进入~/ns-allinone-2.34/ns-2.34目录,可运行./validate进行验证。
(完整word版)NS2网络仿真实验

移动自组织网络实验报告NS2网络仿真实验何云瑞13120073电信研1301班1.实验目的和要求1.学会NS2的安装过程,并熟悉NS2的环境;2.观察并解释NAM动画,分析Trace文档。
3.学会用awk和gnuplot分析吞吐量、封包延迟、抖动率和封包丢失率。
2.实验环境先在PC上安装VMware虚拟机,再在虚拟机上安装Ubuntu系统,最后再Ubuntu系统上安装NS2软件,本次实验采用的是NS-2.34版本。
3.基本概念3.1 NS2简介NS2是一款开放源代码的网络模拟软件,最初由UC Berkeley开发。
它是一种面向对象的网络模拟器,它本质上是一个离散事件模拟器,其本身有一个模拟时钟,所有的模拟都由离散事件驱动。
其采用了分裂对象模型的开发机制,采用C++和OTcl两种语言进行开发。
它们之间采用TclCL进行自动连接和映射。
考虑效率和操作便利等因素,NS2将数据通道和控制通道的实现相分离.为了减少封包和事件的处理时间,事件调度器和数据通道上的基本网络组件对象都使用C++编写,这些对象通过TclCL映射对OTcl解释器可见。
目前,NS2可以用于模拟各种不同的通信网络,它功能强大,模块丰富,已经实现的主要模块有:网络传输协议,如TCP和UDP;业务源流量产生器,如FTP、Telnet、CBR、Web和VBR;路由队列管理机制,如Droptail、RED和CBQ;路由算法;以及无线网络WLAN、移动IP和卫星通信网络等模块。
也为进行局域网的模拟实现了多播协议以及一些MAC子层协议。
3。
2 NS2的功能模块NS2仿真器封装了许多功能模块,最基本的是节点、链路、代理、数据包格式等,下面对各个模块进行简单的介绍:(1)事件调度器:目前NS2提供了四种具有不同数据结构的调度器,分别是链表、堆、日历表和实时调度器。
(2)节点(node):是由TclObject对象组成的复合组件,在NS2中可以表示端节点和路由器.(3)链路(link):由多个组件复合而成,用来连接网络节点.所有的链路都是以队列的形式来管理封包的到达、离开和丢弃。
NS2网络模拟(精)

The application of wireless Ad-hoc network[Hospital mobile server]Lin QiuDepartment of Mathematics&Computing2009University of South QueenslandQueensland,AustraliaSupervised by Dr.ZhongWei,Zhangdan_n2003@ABSTRACTWireless ad-hoc networks have attracted many applicationsin part decade due to its feature of being wireless and with-outfixed nodes as router or gateway.This type of network has an important potential of being token in the healthcareor hospitals,where the physical connectivities is hard,or not economical.In this paper,we simulate a wireless ad-hoc network by using NS2,inspect its performance under manydifferent settings and models.General TermsWireless ad-hoc networkKeywordsInstantaneous throughput,Average throughput,Congestion win-dow size1.INTRODUCTIONA wireless ad-hoc network is actually decentralized wire-less network in which each node may transfer data for other nodes.Thisflexibility provide users with a potential to re-placing traditional networks anywhere,the physical connec-tivity is a concern.We also,however,realized that the TCP performance on wireless ad-hoc network has some sever lim-itions.2.BLUE POINTDesigning a blue point for whole hospital mobile server with wireless Ad-hoc network by NS2.Copyright c USQ2009.The design for NS2show as below:•Simulation Time:50sec•Topology:400m x400m•Mobility of nodes is defined as following:–Node A:(1,1–Node B:(1,399–Node C:(399,1–Node D:(200,200–Node E:(399,399–At time0,node A and C start moving towards the initial position of node E and B respectivelyat speed of30milesecond.–At time0,node E and B start moving towards the initial position of node A and C respectivelyat speed of30milesecond.–Once they reach the targeted location,reverse the direction and return to the original position atthe same speed.•There are two TCP connections:–Connection1:From A to E–Connection2:From C to B–Both start2seconds after the simulation starts.–Both congestion window size:50packets,packet.size:1000bytes,the minimum timeout period:0.2second.–Both traffic sources are FTP sources.•Scenarios:–llType:LL–IFQ Len:50–IFQ Type:QueueDropTailPriQueue–Antenna:Antenna/OmniAntenna–Propagation model:PropagationTwoRayGround–Physical layer:PhyWirelessPhy–Channel:ChannelWirelessChannel–Mac layer protocol:802.11–Network Routing Protocol:AODV–TCP protocol:TCP Reno•Other design:–Set Link layer type∗LL set mindelay50us∗LL set delay25us∗LL set bandwidth0–Set interface queue type∗QueueDropTailPriQueueset Prefer Routing protocols1–Unity gain,omni-directional antennas set up the antennas to be centered in the node and1.5me-ters above it∗AntennaOmniAntenna set X0∗AntennaOmniAntenna set Y0∗AntennaOmniAntenna set Z 1.5∗AntennaOmniAntenna set Gt 1.0∗AntennaOmniAntenna set Gr 1.0–Set network interface type Initialize the Shared-Media interface with parameters to make it worklike the914MHz Luccent WaveLAN DSSS radiointerface∗PhyWirelessPhy set CPThresh10.0∗PhyWirelessPhy set CSThresh 1.559e-11∗PhyWirelessPhy set RXThresh 3.652e-10∗PhyWirelessPhy set Rb2*1e6∗PhyWirelessPhy set Pt0.2818∗PhyWirelessPhy set freq914e+6∗PhyWirelessPhy set L 1.0•Collect the data from network topology by Perl –Average throughput data–Instantaneous throughput data–Congestion window size data•When t he thousands of data gained,plotting a few in-tuitionistic2D graphs with Gnuplot and Xgraph show its variability.–Instantaneous throughput graph–Congestion window size graph•Results presentation(units should be specified e.g.bytes/sec,bit/sec,etc–Explain the TCP performance changes over time.–Compare the TCP performance of the two WORK SIMULATIONAssume there are many hospital departments,mobile de-vice of staffs by a wide variety of healthcare professionals, with some crossover between departments,such as accident and emergency(A&Ewhere are likely to take in patientatfirst.Main diagnostic department in which building,Pa-tients,doctors and nurses are assessed and seen from the dif-ferent departments.Other department,like Elderly services department or General surgery department where has ex-pert doctors.Each department configure own wireless de-vice that directly communicate with the central diagnos-tic department in case of responding a emergency.To help achievement of wireless network c onfiguration,NS2software make a mirror for its configuration running.3.1Layer configurationThose basic parameters for simulation provide the simple information for different layers.set val(chanChannel/WirelessChannel;#channel typeset val(propPropagation/TwoRayGround;#radio-propagation model set val(netifPhy/WirelessPhy;#network interface typeset val(macMac/80211;#MAC typeset val(ifqQueue/DropTail/PriQueue;#interface queue typeset val(llLL;#link layer typeset val(antAntenna/OmniAntenna;#antenna modelset val(ifqlen50;#max packet in ifqset val(nn5;#number of mobile nodesset val(rpAODV;#routing protocolset val(x400;#X dimension of topographyset val(y400;#Y dimension of topographyset val(stop50;#time of simulation end3.2Nodes configurationHere is a nod es configuration shown blow[?],$ns node-config-adhocRouting$val(rp-llType$val(ll-macType$val(mac-ifqType$val(ifq-ifqLen$val(ifqlen-antType$val(ant-propType$val(prop-phyType$val(netif-channelType$val(chan-topoInstance$topo-agentTrace ON-routerTrace ON-macTrace ON-movementTrace OFF3.3Antennas,Network interfaceThose configurations of Antennas and Network interface configure like the requirement given,which has been shown above.3.4Network Topology#Create the number of nodesset node(A[$ns node]set node (B[$ns node]set node (C[$ns node]set node (D[$ns node]set node (E[$nsnode]Figure 1:Wireless Ad-hoc network topology Start doing project work,network model is shown in Fig-ure 1,which is a wireless ad hoc network consisting of 5nodes(A,B,C,D,E represent as 0,1,2,3,4.The nodes D which is a special node known as an router which is an access point manages communication among other nodes(A,B,D,E,and all other nodes can be considered as clients.$node (A setX 1.0$node (A setY 1.0$node (A setZ 0.0$node (B setX 1.0$node (B setY 399.0$node (B setZ 0.0$node (C setX 399.0$node(C setY 1.0$node (C setZ 0.0$node (D setX 200.0$node (D setY 200.0$node (D setZ0.0$node (E setX 399.0$node (E setY 399.0$node (E setZ 0.03.5TCP connectionThere are two TCP configur ations with 5nodes using Newreno TCPalgorithm.Newreno algorithm that is a ver-sion of Reno for deal with congestion on the network.When the packet is lost,using ”fast retransmit”and ”fast recov-ery”mechanism controls the congestion window.[?][?]NewReno algrithom processing approaches:•Step1:Resend the ACK packet for three timesIf the third ACK had received and fast recovery does not access process,to check the accumulative value whether it is greater than recover variable.If it is,then going to next step 2,or it is not,then going to next step 3.•Step2:Transfer fast retransmitSetup slow start threshold as max(FlighSize /2,2*SMSSFlighSize represents the data sent but it does not ar-rive at the destination yet.So the max serial number save into the recover variable and send out then going to step 4.•Step3:Do not transfer fast retransmitDo not access doing fast retransmit and fast recovery and do not change ssthresh.Going to step 6.•Step4:Fast retransmitRetransmit the packet that had been lost and setup the congestion window size as ssthresh+3*SMSS.•Step5:Fast recoveryDuring the fast recovery,to increase the congestion window size when every ACK packet resend have re-ceived.•Step6:Fast recovery continueContinue send a data segment if the congestion window size and receiver allow.•Step7:CheckoutWhen a new ACK packet had received,then doing checkout that has two conditions:1.Fully checkoutCheck every data from ACK including recover serial number and data information,and setup the CWND as min(ssthresh,FlighSize+SMSS.2.Part checkout Generate a part of ACK when the ACK does not full checkout,and retransmit first segment that has not been checkout.According to new ACK,to decrease CWND.•Step8:Retransmit timeoutwhen the packet retransmit timeout,to save the biggest serial number to recover variable then stop fast recov-ery.set tcp [new Agent/TCP/Newreno]$tcp set class 1$tcp set window 50$tcp set packetSize 1000Agent/TCPSink/DelAck set interval 200ms set sink [newAgent/TCPSink/DelAck]$ns attach-agent $node (E$sink $ns connect $tcp $sinkset ftp [new Application/FTP]$ftp attach-agent $tcp $ns at 2.0”$ftp start”set tcp2[new Agent/TCP/Newreno]$tcp2set class 2$tcp2set window 50$tcp2set packetSize 1000Agent/TCPSink/DelAck set interval 200ms set sink2[newAgent/TCPSink/DelAck]$ns attach-agent $node (C$tcp2$ns attach-agent $node(B$sink2$ns connect $tcp2$sink2set ftp2[new Application/FTP]$ftp2attach-agent $tcp2$ns at 2.0”$ftp2start”The design of TCP agent between node A to node E and Node C to Node B of which the packets in the black round signal have limited as 1000bytes,and their minimum time-out period also is set to 0.2second.The congestion window’s size setup 50packets[?].3.6Nodes’Movement5nodes are with initial positions at time 0.After that,the node A,B,C,E are moving to node D slowly and syn-chronously with 30milesecond.$ns at 0.0”$node (Asetdest 200.0200.030.0”$ns at 0.0”$node (Csetdest200.0200.030.0”$ns at 0.0”$node (Bsetdest 200.0200.030.0”$ns at 0.0”$node (Esetdest 200.0200.030.0”When the distance between adjacent client nodes is 199mile,the reverse time between client node and core node we can known as 199.0∗sqrt (2/30.0.$ns at [expr 199.0*sqrt(2/30.0]”$node (Asetdest 1.01.030.0”$ns at [expr 199.0*sqrt(2/30.0]”$node (Csetdest 399.01.030.0”$ns a t [expr 199.0*sqrt(2/30.0]”$node (Bsetdest 1.0399.030.0”$ns at [expr 199.0*sqrt(2/30.0]”$node (Esetdest 399.0399.030.0”The Figure 2show that all nodes converge at (200,200around 9.4seconds and return back at the sametime.Figure 2:Nodes flock together4.DATA ANALYSIS 4.1Congestion Window SizeXgraph is used to plot the graph for result analysis that is provded by network simulator.It allows to create postscript,Tgif files and others,by clicking on the botton of the NAM as “Hdcpy”.In this project,Xgraph commands process a con-gestion window size(CWND.The procedure called plotWin-dow is added in the TCL file that generate an outputfile.Figure 3:Congestion Window SizeIn this procedure,we also set up the instantaneous size of the window of TCP with the tim e intervals of 0.1second,and generate another file is ”win.tr”.We can monitor a plot of congestion window using the data from this file.Using TCP/Reno connection is the modern version take the FTP traffic.When the packet is lost,TCP connection is going to nex t step that is adopting ”fastrecovery”strategy control the congestion window.In other word,to setup size into the half of congestion window,then to increase the size of 1/congestion window.According to this theory,FTP traffic set up in this project will increase gradually during 20seconds when CWND start happen at 2second.However,at 19.41second,CWND goes down directly to 1and continue keep this value constantly because two FTP traffic stopped at 19.5second.In addition,each TCP also maintain a window called the Congestion Window or cwnd have defined size as ing congestion window (cwndadjust the transmis-sion rate in order to fix up the TCP network congestion.The congestion window either increases or decreases that depend on ACKs (acknowledgementsbeca use it reflects the status of link’s buffer queues.This chart shows the value of con-gestion window based on observed packets (duplicate ACKsand plots the value of congestion window against time.Theslope of the congestion window indicates the rate at which data is being transmitted.In the slow start phase-cwnd increases exponentially;in congestion avoidance-cwnd in-creases linearly subject to a maximum of2*mss per round trip time.4.2Sorting trafficfileNetwork smiulator can do a lot of process on data events when it happens at the network.The one thing is to analyze the data result that is to extract relevant information from traces and to manipulate them.There are two ways you can handle these tracesfiles.An example of a line in the ouput trace iss2.0000000000AGT—0tcp40[0000]——-[0:04:0 320][00]00•Thefirstfield is a letter that can have the values r,s,f,dfor”received”,”sent”,”forwarded”and”dropped”, respectively.It can also be M for giving a location or a movement indication was shown before.•The secondfield i s the time.•The thirdfield is the node number.•The fourthfield is MAC to indicate if the packet con-cerns a MAC layer,it is AGT to indicate a transport layer(e.g.tcppacket,or RTR if it concerns the routed packet.It can also be IFQ to indicate events related to the interference priority queue(like drop of packets.•After the dahses come the global sequence number of the packet(this is not the tcp sequence number.•At the nextfield comes more information on the packet type(e.g.tcp,ack or udp.•Then comes the p acket size in bytes.•The4numbers in thefirst square barkets concern mac layer information.Thefirst hexadecimal number0 which specifies the expected time in seconds to send this data packet over the wireless channel.The second number0,stands for the MAC-id of the sending node and the tird,0,is that of the receiveing node.The last 0,is the MAC type.•The next numbers in the second square brackets con-cern the IP source and destination addresses.•The third brackets concern the tcp information:its se-quence number and acknowledgement number.There are other formats shown in the trafficfile out.tr likethis:M0.000000(1.00,1.00,0.00,(200.00,200.00,30.00 where thefirst number is the moving time,the second is the node number,then comes the origin and destination loca-tions,and last one is given the speed.[?]To purify data that we need,Perl language help in the TCLfile can automatically generate the graph,but too many command lines write into the TCLfile will cause thebuffoverloaded.To address this problem,we may write Perl into otherfiles and executed commands by manually typing when we need to research these data.Because”out.tr”file track all traffic of nodes including ACK,AGT,MAC and soon,we must sort two TCPs through-put data out.In this case,the data are received by node E(node4from transport layer belong a TCP connection, while another data are received by node B(node1transfer-ring on the network,which is second TCP connection.grep”r”./traffic/out.tr|grep”tcp”|grep ”4”|grep”AGT”>./traffic/tcp1.tr&grep”r”./traffic/out.tr|grep”tcp”|grep”1”|grep”AGT”>./traffic/tcp2.tr&4.3Average throughputAfter sorting data,it is going to calculate average through-put.A parameter as granularity where we compute how many bytes were transmitted during time interval specified.In this case,all nodes must stop at50seconds.perl./perl/AvgTp.pl./traffic/tcp1.tr50& perl./perl/AvgTp.pl./traffic/tcp2.tr50&Figure4:Average throughputFigure4shows on the TCP1connection,the total through-put is373180bytes which start at2second and end at17.7 second so the average throughput is373180/(17.7-2=23769 bytes/second.TCP2connection start running a bitlaterFigure5:Average throughputand stop earlier than TCP1connection.So the total through-put is345620and average throughput during17.6seconds is22076bytes/second.4.4Instantaneous throughputTo record two TCPs Instantaneous throughput into the files,and every0.1is a small time interval for instantaneous throughput.perl./perl/tcp1InsTp.pl./traffic/tcp1.tr0.1 &perl./perl/tcp2InsTp.pl./traffic/tcp2.tr0.1& Plotting two TCPs Instantaneous throughput.plot’./traffic/tcp1Ins.tr’t”TCP1inst”w lines 1,’./traffic/tcp2Ins.tr’t”TCP2inst”w lines2as the life of patients.Wireless Ad-hoc netowrk operate in hospital,which has a centralized supporting structure like an access point assist other wireless device in orderto keep connected with the wireless system from one place to the other.Hospital mobile server,that is the aim of being salvage. When a dying patient sent into the hospital,doctor in charge of a case and assistant medical director s can immediately know the first information of patient before doing operation and they can read the state of illness at real time. However,traditional hospital information system that built in wired network for providing basic server is adapt for some settled position like pharmacal apartment,rest apartment and so on,which wired network has more secure,more bandwidth and more reliable than wireless Ad-hoc network. Therefore, building a wireless network combine working with wired network from a traditional hospital is really necessary. Figure 6: Two TCPs Instantaneous throughput In Figure6,we present both instantaneous throughput of TCP connection during every 0.1 second.On TCP1, traffic start 3.5 second and itfluctuantes dramatically in every second.There are 5 times traffic reach 50000 bytes respectively at 5 second,9 second,14 second, 15 second and 17.5 second.However,thetraffic go trhoughput TCP2 connection which quite difference from TCP1 connection, where start traffic at 5 second,and most of traffic has instantaneous throughput with 30000 bytes or 40000 bytes, although there are traffic reach 50000 bytes for 3 times at 9 second, 15 second and 16 second.The reason of both TCP connections have large traffic around at 5 second, 9 second and 15 second is that in 5 second,both nodes of a connection reach at the range of middle node D when they are moving, after that in 9 second, all nodes accumulate together and finally all nodes are going out of range of node D in 15 second.7. ACKNOWLEDGMENTS I would like to thank Dr. ZhongWei,Zhang for his help in studying TCL and Perl language. APPENDIX A. A.1 A.2 A.3 A.3.1 A.3.2 A.3.3 A.3.4 A.3.5 A.3.6 HEADINGS IN APPENDICES Introduction Blue point Network simulation Layer configuration Nodes configuration Antennas,Network interface Netwo rk Topology TCP connection Nodes’Movement 5. LIMITATIONS After the data analyse, the design of hospital mobile server can be come true, but there are some limitations for wireless ad-hoc network. • Limitation of throughput The total throughput is limited c ause more server join in and more bandwidth consume. • Interference Interference always is a mainproblem of wireless network.Without cable contained,a signal discover to impact with another signal,especially for hospital where have many electronic devices. • Lack of security Between node and node,there are traffics go through by wireless tunnel.Thosetraffics are easier be listening and attacking,and finally it causes whole network unreliable.A.4 A.4.1 A.4.2 A.4.3 A.4.4 Data Analysis Congestion Window Size So rting traffic file Average throughput Instantaneous throughput A.5 A.6 A.7 A.8 Limitations Conclusion Acknowledgments References 6. CONCLUSION In a conclusion, we already researched some contents are given a bird’s eye view of wireless Ad-hoc network based on the Network simulator. The Network exists to help in medical care system related to the historical evolution of hospitals until the present day by providing.A wireless network is a great way to save time in working hospital,actually。
NS2 仿真练习报告 实验名称随机数的产生

NS2 仿真练习报告实验名称:随机数产生器学院:信息与电子工程学院专业:通信工程班级:姓名:学号:指导老师:目录背景知识 (1)1. 了解随机数产生器 (2)1.1 种子(Seed)和分布(Distribution) (2)1.2 设置种子 (2)1.3 设置分布 (2)2. 测试随机数产生器 (3)2.1 代码 (3)2.2 运行结果 (4)3. 一个在网络仿真中应用到随机数产生器的完整实例 (4)3.1仿真的网络结构图 (4)3.2 效果评比指标:吞吐量(Throughput) (5)3.3 TCL程序代码 (5)3.4分析awk程序代码 (6)3.5执行方法 (7)4. 参数变化.............................................................................................4.1 种子数量变化 (7)4.2变量分布时 (9)4.3 FTP数据流数目变化 (11)5.参考资料 (13)实验目的:了解如何在网络仿真过程中应用随机数产生器。
背景知识:随机数的使用在网络仿真实验的过程中非常重要,凡是网络节点在一个仿真中的位置,或者是应用程序在何时开始传送或结束数据传输,都会用到随机数产生器。
因此,在本实验中,我们将学会如何使用NS2的随机数产生器及其应用。
1.了解随机数产生器1.1种子(Seed)和分布(Distribution)随机数产生器所产生的数值是由种子和分布所控制的,不同的种子或者是分布就会产生不同的随机数。
当一个种子和分布决定之后,随机数产生器会产生一出一个由一长串不同数字所组成的表格,当需要一个随机数时,随机数产生器就会去选取这个表格中的一个数字,当需要另一个随机数时,随机数产生器就会去选取这个表格中第二个数字,依此类推。
所以当使用种子和分布相同时,得到的随机数就会相同;若不同时,得到的随机数就会不同。
计算机网路实验-使用NS2模拟多媒体通讯与无线网路(实验...

2010/3/5
-Ma 0 -Md 0 -Ms 0 -Mt 0 該列給出了MAC層信息,標識以“-M”開始 -Ma: 持續時間 -Md: 目的乙太網址 -Ms: 來源乙太網址 -Mt: 乙太網類型 -Is 0.255 -Id -1.255 -It message -Il 32 -If 0 -Ii 0 -Iv 32
2010/3/5
7
else { #計算吞吐量 $throughput=$sum*8.0/$granularity; if ($throughput > $maxrate){ $maxrate=$throughput; } #輸出結果: 時間 吞吐量(bps) print STDOUT "$x[2]: $throughput bps\n"; #設定下次要計算吞吐量的時間 $clock=$clock+$granularity; $sum_total=$sum_total+$x[4]; $sum=$x[4]; }
2010/3/5
;# disable random motion
20
# Provide initial (X,Y, for now Z=0) co-ordinates for mobilenodes # # 設定節點0在一開始時,位置在(350.0, 500.0) $node_(0) set X_ 350.0 $node_(0) set Y_ 500.0 $node_(0) set Z_ 0.0
# Load the god object with shortest hop information # 在節點1和節點2之間最短的hop數為1 $god_ set-dist 1 2 1
毕业论文无线网络中多媒体信息传输的NS2仿真

摘要无线网络中多媒体信息传输的NS2仿真在无线多媒体通信系统中,视频信源在发送端按照一定的编码方式进行编码,形成视频帧,然后在网络层和传输层封装成IP数据包,再经过无线信道传输到达接收端,在接收端进行解包和恢复,得到视频帧,再形成重建后的视频流。
在此过程中,无线信道的传输特性会影响到视频的传输质量.本文在利用Evalvid 工具的基础上,综合NS2仿真工具,建立研究多媒体信息在无线网络中传输的平台。
在视频流仿真方面,本文采用了将视频流的Trace 文件引入NS仿真环境的方法,来模拟实际网络传送的视频流,并在tcl程序代码中设定G-E模型的参数变量,这样就可以得到经模拟网络传输后数据包的收发情况,并对无线信道对多媒体信息传输质量的影响进行评估。
实验中采用的网络拓扑结构为无线局域网拓扑结构。
仿真结果表明,由于无线信道特性的不理想,在接收端恢复视频信息与视频信源相比较,会出现一定的失真。
本文还综合利用多种工具对视频信息的质量变化进行评估,如数据封包的时延、视频的PSNR值、可解画面比例及原始图像和重建后的图像的差异等。
关键词:无线网络;多媒体信息;网络仿真;AbstractThe Simulation Of Multimedia Information Transmission in Wireless Network Video information are encoded by a certain means in the sending end among the system of wireless-multimedia communication,informing the video frames,and then they was encapsulated in the network layer and the transmission layer。
Before they reach the sink,they transmit across the wireless channel,and now they are download and renew,getting the new frames,which inform the rebuided video stream.Among this course,the characteristic of wireless channel could affect the quality of video transmission.Based the useage of Evalvid tool and integrated ns2 simulation tool,we construct the platform for researching the transmission of multimedia in wireless network。
NS2网络模拟(精)

NS2网络模拟(精)The application of wireless Ad-hoc network[Hospital mobile server]Lin QiuDepartment of Mathematics&Computing2009University of South QueenslandQueensland,AustraliaSupervised by Dr.ZhongWei,Zhang*********************ABSTRACTWireless ad-hoc networks have attracted many applications in part decade due to its feature of being wireless and with-out?xed nodes as router or gateway.This type of network has an important potential of being token in the healthcareor hospitals,where the physical connectivities is hard,or not economical.In this paper,we simulate a wireless ad-hoc network by using NS2,inspect its performance under manydi?erent settings and models.General TermsWireless ad-hoc networkKeywordsInstantaneous throughput,Average throughput,Congestion win-dow size1.INTRODUCTIONA wireless ad-hoc network is actually decentralized wire-less network in which each node may transfer data for other nodes.This?exibility provide users with a potential to re-placing traditional networks anywhere,the physical connec-tivity is a concern.We also,however,realized that the TCP performance onwireless ad-hoc network has some sever lim-itions.2.BLUE POINTDesigning a blue point for whole hospital mobile server with wireless Ad-hoc network by NS2.Copyright c USQ2009.The design for NS2show as below:Simulation Time:50secTopology:400m x400mMobility of nodes is de?ned as following:–Node A:(1,1–Node B:(1,399–Node C:(399,1–Node D:(200,200–Node E:(399,399–At time0,node A and C start moving towards the initial position of node E and B respectivelyat speed of30milesecond.–At time0,node E and B start moving towards the initial position of node A and C respectivelyat speed of30milesecond.–Once they reach the targeted location,reverse the direction and return to the original position atthe same speed.There are two TCP connections:–Connection1:From A to E–Connection2:From C to B–Both start2seconds after the simulation starts.–Both congestion window size:50packets,packet.size:1000bytes,the minimum timeout period:0.2second.–Both tra?c sources are FTP sources.Scenarios:–llType:LL–IFQ Len:50–IFQ Type:QueueDropTailPriQueue–Antenna:Antenna/OmniAntenna–Propagation model:PropagationTwoRayGround–Physical layer:PhyWirelessPhy–Channel:ChannelWirelessChannel–Mac layer protocol:802.11–Network Routing Protocol:AODV–TCP protocol:TCP RenoOther design:–Set Link layer typeLL set mindelay50usLL set delay25usLL set bandwidth0–Set interface queue typeQueueDropTailPriQueueset Prefer Routing protocols1–Unity gain,omni-directional antennas set up the antennas to be centered in the node and1.5me-ters above itAntennaOmniAntenna set X0AntennaOmniAntenna set Y0AntennaOmniAntenna set Z 1.5AntennaOmniAntenna set Gt 1.0AntennaOmniAntenna set Gr 1.0–Set network interface type Initialize the Shared-Media interface with parameters to make it worklike the914MHz Luccent WaveLAN DSSS radiointerfacePhyWirelessPhy set CPThresh10.0PhyWirelessPhy set CSThresh 1.559e-11PhyWirelessPhy set RXThresh 3.652e-10PhyWirelessPhy set Rb2*1e6PhyWirelessPhy set Pt0.2818PhyWirelessPhy set freq914e+6PhyWirelessPhy set L 1.0Collect the data from network topology by Perl –Average throughput data–Instantaneous throughput data–Congestion window size dataWhen t he thousands of data gained,plotting a few in-tuitionistic2D graphs with Gnuplot and Xgraph show its variability.–Instantaneous throughput graph–Congestion window size graphResults presentation(units should be speci?ed e.g.bytes/sec,bit/sec,etc–Explain the TCP performance changes over time.–Compare the TCP performance of the two WORK SIMULATIONAssume there are many hospital departments,mobile de-vice of sta?s by a wide variety of healthcare professionals, with some crossover between departments,such as accident and emergency(A&Ewhere are likely to take in patientat?rst.Main diagnostic department in which building,Pa-tients,doctors and nurses are assessed and seen from the dif-ferent departments.Other department,like Elderly services department or General surgery department where has ex-pertdoctors.Each department con?gure own wireless de-vice that directly communicate with the central diagnos-tic department in case of responding a emergency.To help achievement of wireless network c on?guration,NS2software make a mirror for its con?guration running.3.1Layer con?gurationThose basic parameters for simulation provide the simple information for di?erent layers.set val(chanChannel/WirelessChannel;#channel typeset val(propPropagation/TwoRayGround;#radio-propagation model set val(netifPhy/WirelessPhy;#network interface typeset val(macMac/80211;#MAC typeset val(ifqQueue/DropTail/PriQueue;#interface queue type set val(llLL;#link layer typeset val(antAntenna/OmniAntenna;#antenna modelset val(ifqlen50;#max packet in ifqset val(nn5;#number of mobile nodesset val(rpAODV;#routing protocolset val(x400;#X dimension of topographyset val(y400;#Y dimension of topographyset val(stop50;#time of simulation end3.2Nodes con?gurationHere is a nod es con?guration shown blow[?],$ns node-con?g-adhocRouting$val(rp-llType$val(ll-macType$val(mac-ifqType$val(ifq-ifqLen$val(ifqlen-antType$val(ant-propType$val(prop-phyType$val(netif-channelType$val(chan-topoInstance$topo-agentTrace ON-routerTrace ON-macTrace ON-movementTrace OFF3.3Antennas,Network interfaceThose con?gurations of Antennas and Network interface con?gure like the requirement given,which has been shown above.3.4Network T opology#Create the number of nodesset node(A[$ns node]set node (B[$ns node]set node (C[$ns node]set node (D[$ns node]set node (E[$nsnode]Figure 1:Wireless Ad-hoc network topology Start doing project work,network model is shown in Fig-ure 1,which is a wireless ad hoc network consisting of 5nodes(A,B,C,D,E represent as 0,1,2,3,4.The nodes D which is a special node known as an router which is an access point manages communication among other nodes(A,B,D,E,and all other nodes can be considered as clients.$node (A setX 1.0$node (A setY 1.0$node (A setZ 0.0$node (B setX 1.0$node (B setY 399.0$node (B setZ 0.0$node (C setX 399.0$node(C setY 1.0$node (C setZ 0.0$node (D setX 200.0$node (D setY 200.0$node (D setZ0.0$node (E setX 399.0$node (E setY 399.0$node (E setZ 0.03.5TCP connectionThere are two TCP con?gur ations with 5nodes using Newreno TCPalgorithm.Newreno algorithm that is a ver-sion of Reno for deal with congestion on the network.When the packet is lost,using ”fast retransmit”and ”fast recov-ery”mechanism controls the congestion window.[?][?]NewReno algrithom processing approaches:Step1:Resend the ACK packet for three timesIf the third ACK had received and fast recovery does not access process,to check the accumulative value whether it is greater than recover variable.If it is,then going to next step 2,or it is not,then going to next step 3.Step2:Transfer fast retransmitSetup slow start threshold as max(FlighSize /2,2*SMSSFlighSize represents the data sent but it does not ar-rive at the destination yet.So the max serial number save into the recover variable and send out then going to step 4.?Step3:Do not transfer fast retransmitDo not access doing fast retransmit and fast recovery and do not change ssthresh.Going to step 6.?Step4:Fast retransmit Retransmit the packet that had been lost and setup the congestion window size as ssthresh+3*SMSS.?Step5:Fast recoveryDuring the fast recovery,to increase the congestion window size when every ACK packet resend have re-ceived.?Step6:Fast recovery continueContinue send a data segment if the congestion window size and receiver allow.?Step7:CheckoutWhen a new ACK packet had received,then doing checkout that has two conditions:1.Fully checkoutCheck every data from ACK including recover serial number and data information,and setup the CWND as min(ssthresh,FlighSize+SMSS.2.Part checkout Generate a part of ACK when the ACK does not full checkout,and retransmit ?rst segment that has not been checkout.According to new ACK,to decrease CWND.Step8:Retransmit timeoutwhen the packet retransmit timeout,to save the biggest serial number to recover variable then stop fast recov-ery.set tcp [new Agent/TCP/Newreno]$tcp set class 1$tcp set window 50 $tcp set packetSize 1000Agent/TCPSink/DelAck set interval 200ms set sink [newAgent/TCPSink/DelAck]$ns attach-agent $node (E$sink $ns connect $tcp $sinkset ftp [new Application/FTP]$ftp attach-agent $tcp $ns at2.0”$ftp start”set tcp2[new Agent/TCP/Newreno]$tcp2set class 2$tcp2set window 50$tcp2set packetSize 1000Agent/TCPSink/DelAck set interval 200ms set sink2[newAgent/TCPSink/DelAck]$ns attach-agent $node (C$tcp2$ns attach-agent $node(B$sink2$ns connect $tcp2$sink2set ftp2[new Application/FTP]$ftp2attach-agent $tcp2$ns at 2.0”$ftp2start”The design of TCP agent between node A to node E and Node C to Node B of which the packets in the black round signal have limited as 1000bytes,and their minimum time-out period also is set to 0.2second.The congestion windo w’s size setup 50packets[?].3.6Nodes’Movement5nodes are with initial positions at time 0.After that,the node A,B,C,E are moving to node D slowly and syn-chronously with 30milesecond.$ns at 0.0”$node (Asetdest 200.0200.030.0”$ns at 0.0”$node (Csetdest200.0200.030.0”$ns at 0.0”$node (Bsetdest 200.0200.030.0”$ns at 0.0”$node (Esetdest 200.0200.030.0”When the distance between adjacent client nodes is 199mile,the reverse time between client node and core node we can known as 199.0?sqrt (2/30.0.$ns at [ex pr 199.0*sqrt(2/30.0]”$node (Asetdest 1.01.030.0”$ns at [expr 199.0*sqrt(2/30.0]”$node (Csetdest 399.01.030.0”$ns a t [expr 199.0*sqrt(2/30.0]”$node (Bsetdest 1.0399.030.0”$ns at [expr 199.0*sqrt(2/30.0]”$node (Esetdest 399.0399.030.0”The Figure 2show that all nodes converge at (200,200around 9.4seconds and return back at the sametime.Figure 2:Nodes ?ock together4.DATA ANALYSIS 4.1Congestion Window SizeXgraph is used to plot the graph for result analysis that is provded by network simulator.It allows to create postscript,Tgif ?les and others,by clicking on the botton of the NAM as “Hdcpy”.In this project,Xgraph commands process a con-gestion window size(CWND.The procedure called plotWin-dow is added in the TCL ?le that generate an outputle.Figure 3:Congestion Window SizeIn this procedure,we also set up the instantaneous size of the window of TCP with the tim e intervals of 0.1second,and generate another ?le is ”win.tr”.We can monitor a plot of congestion window using the data from this ?le.Using TCP/Reno connection is the modern version take the FTP tra?c.When the packet is lost,TCP connection is going to nex t step that is adopting ”fastrecovery”strategy control the congestion window.In other word,to setup size into the half of congestion window,then to increase the size of 1/congestion window.According to this theory,FTP tra?c set up in this project will increase gradually during 20seconds when CWND start happen at 2second.However,at 19.41second,CWND goes down directly to 1and continue keep this value constantly because two FTP tra?c stopped at 19.5second.In addition,each TCP also maintain a window called the Congestion Window or cwnd have de?ned size as ing congestion window (cwndadjust the transmis-sion rate in order to ?x up the TCP network congestion.The congestionwindow either increases or decreases that depend on ACKs (acknowledgementsbeca use it re?ects the status of link’s bu?er queues.This chart shows the value of con-gestion window based on observed packets (duplicate ACKsand plots the value of congestion window against time.Theslope of the congestion window indicates the rate at which data is being transmitted.In the slow start phase-cwnd increases exponentially;in congestion avoidance-cwnd in-creases linearly subject to a maximum of2*mss per round trip time.4.2Sorting traf?c?leNetwork smiulator can do a lot of process on data events when it happens at the network.The one thing is to analyze the data result that is to extract relevant information from traces and to manipulate them.There are two ways you can handle these traces?les.An example of a line in the ouput trace iss2.0000000000AGT—0tcp40[0000]——-[0:04:0 320][00]00The?rst?eld is a letter that can have the values r,s,f,dfor”received”,”sent”,”forwarded”and”dropped”, respectively.It can also be M for giving a location or a movement indication was shown before.The second?eld i s the time.The third?eld is the node number.The fourth?eld is MAC to indicate if the packet con-cerns a MAC layer,it is AGT to indicate a transport layer(e.g.tcppacket,or RTR if it concerns the routed packet.It can also be IFQ to indicate events related to the interference priority queue(like drop of packets.After the dahses come the global sequence number of the packet(this is not the tcp sequence number.At the next?eld comes more information on the packet type(e.g.tcp,ack or udp.Then comes the p acket size in bytes.The4numbers in the?rst square barkets concern mac layer information.The?rst hexadecimal number0 which speci?es the expected time in seconds to send this data packet over the wireless channel.The second number0,stands for the MAC-id of the sending node and the tird,0,is that of the receiveing node.The last 0,is the MAC type.The next numbers in the second square brackets con-cern the IP source and destination addresses.The third brackets concern the tcp information:its se-quence number and acknowledgement number.There are other formats shown in the tra?c?le out.tr likethis:M0.000000(1.00,1.00,0.00,(200.00,200.00,30.00 where the?rst number is the moving time,the second is the node number,then comes the origin and destination loca-tions,and last one is given the speed.[?]To purify data that we need,Perl language help in the TCL?le can automatically generate the graph,but too many command lines write into the TCL?le will cause thebu?overloaded.To address this problem,we may write Perl into other?les and executed commands by manually typing when we need to research these data.Because”out.tr”?le track all tra?c of nodes including ACK,AGT,MAC and soon,we must sort two TCPs through-put data out.In this case,the data are received by node E(node4from transport layer belong a TCP connection, while another data are received by node B(node1transfer-ring on the network,which is second TCPconnection.grep”r”./tra?c/out.tr|grep”tcp”|grep ”4”|grep”AGT”>./tra?c/tcp1.tr&grep”r”./tra?c/out.tr|grep”tcp”|grep”1”|grep”AGT”>./tra?c/tcp2.tr&4.3Average throughputAfter sorting data,it is going to calculate average through-put.A parameter as granularity where we compute how many bytes were transmitted during time interval speci?ed.In this case,all nodes must stop at50seconds.perl./perl/AvgTp.pl./tra?c/tcp1.tr50&perl./perl/AvgTp.pl./tra?c/tcp2.tr50&Figure4:Average throughputFigure4shows on the TCP1connection,the total through-put is373180bytes which start at2second and end at17.7 second so the average throughput is373180/(17.7-2=23769 bytes/second.TCP2connection start running a bitlaterFigure5:Average throughputand stop earlier than TCP1connection.So the total through-put is345620and average throughput during17.6seconds is22076bytes/second.4.4Instantaneous throughputTo record two TCPs Instantaneous throughput into the ?les,and every0.1is a small time interval for instantaneousthroughput.perl./perl/tcp1InsTp.pl./tra?c/tcp1.tr0.1 &perl./perl/tcp2InsTp.pl./tra?c/tcp2.tr0.1& Plotting two TCPs Instantaneous throughput.plot’./tra?c/tcp1Ins.tr’t”TCP1inst”w lines 1,’./tra?c/tcp2Ins.tr’t”TCP2inst”w li nes2as the life of patients.Wireless Ad-hoc netowrk operate in hospital,which has a centralized supporting structure like an access point assist other wireless device in orderto keep connected with the wireless system from one place to the other.Hospital mobile server,that is the aim of being salvage. When a dying patient sent into the hospital,doctor in charge of a case and assistant medical director s can immediately know the ?rst information of patient before doing operation and they can read the state of illness at real time. However,traditional hospital information system that built in wired network for providing basic server is adapt for some settled position like pharmacal apartment,rest apartment and so on,which wired network has more secure,more bandwidth and more reliable than wireless Ad-hoc network. Therefore, building a wireless network combine working with wired network from a traditional hospital is really necessary. Figure 6: Two TCPs Instantaneous throughput In Figure6,we present both instantaneous throughput of TCP connection during every 0.1 second.On TCP1, traf?c start 3.5 second and ituctuantes dramatically in every second.There are 5 times tra?c reach 50000 bytes respectively at 5 second,9 second,14 second, 15 second and 17.5 second.However,thetra?c go trhoughput TCP2 connection which quite di?erence from TCP1 connection, where start tra?c at 5 second,and most oftra?c has instantaneous throughput with 30000 bytes or 40000 bytes, although there are tra?c reach 50000 bytes for 3 times at 9 second, 15 second and 16 second.The reason of both TCP connections have large tra?c around at 5 second, 9 second and 15 second is that in 5 second,both nodes of a connection reach at the range of middle node D when they are moving, after that in 9 second, all nodes accumulate together and ?nally all nodes are going out of range of node D in 15 second.7. ACKNOWLEDGMENTS I would like to thank Dr. ZhongWei,Zhang for his help in studying TCL and Perl language. APPENDIX A. A.1 A.2 A.3 A.3.1 A.3.2 A.3.3 A.3.4 A.3.5 A.3.6 HEADINGS IN APPENDICES Introduction Blue point Network simulation Layer con?guration Nodes con?guration Antennas,Network interface Netwo rk Topology TCP connection Nodes’Movement 5. LIMITATIONS After the data analyse, the design of hospital mobile server can be come true, but there are some limitations for wireless ad-hoc network. ? Limitation of throughput The total throughput is limited c ause more server join in and more bandwidth consume. ? Interference Interference always is a mainproblem of wireless network.Without cable contained,a signal discover to impact with another signal,especially for hospital where have many electronic devices. ? Lack of security Between node and node,there are traf?cs go through by wireless tunnel.Thosetra?cs are easier be listening and attacking,and ?nally it causes whole network unreliable.A.4 A.4.1 A.4.2 A.4.3 A.4.4 Data Analysis Congestion Window Size So rting traf?c ?le Average throughput Instantaneous throughput A.5 A.6 A.7 A.8 Limitations ConclusionAcknowledgments References 6. CONCLUSION In a conclusion, we already researched some contents are given a bird’s eye view of wireless Ad-hoc network based on the Network simulator. The Network exists to help in medical care system related to the historical evolution of hospitals until the present day by providing.A wireless network is a great way to save time in working hospital,actually。
- 1、下载文档前请自行甄别文档内容的完整性,平台不提供额外的编辑、内容补充、找答案等附加服务。
- 2、"仅部分预览"的文档,不可在线预览部分如存在完整性等问题,可反馈申请退款(可完整预览的文档不适用该条件!)。
- 3、如文档侵犯您的权益,请联系客服反馈,我们会尽快为您处理(人工客服工作时间:9:00-18:30)。
移动自组织网络实验报告NS2网络仿真实验何云瑞13120073电信研1301班1.实验目的和要求1.学会NS2的安装过程,并熟悉NS2的环境;2.观察并解释NAM动画,分析Trace文档。
3.学会用awk和gnuplot分析吞吐量、封包延迟、抖动率和封包丢失率。
2.实验环境先在PC上安装VMware虚拟机,再在虚拟机上安装Ubuntu系统,最后再Ubuntu系统上安装NS2软件,本次实验采用的是NS-2.34版本。
3.基本概念3.1 NS2简介NS2是一款开放源代码的网络模拟软件,最初由UC Berkeley开发。
它是一种面向对象的网络模拟器,它本质上是一个离散事件模拟器,其本身有一个模拟时钟,所有的模拟都由离散事件驱动。
其采用了分裂对象模型的开发机制,采用C++和OTcl两种语言进行开发。
它们之间采用TclCL进行自动连接和映射。
考虑效率和操作便利等因素,NS2将数据通道和控制通道的实现相分离。
为了减少封包和事件的处理时间,事件调度器和数据通道上的基本网络组件对象都使用C++编写,这些对象通过TclCL映射对OTcl解释器可见。
目前,NS2可以用于模拟各种不同的通信网络,它功能强大,模块丰富,已经实现的主要模块有:网络传输协议,如TCP和UDP;业务源流量产生器,如FTP、Telnet、CBR、Web和VBR;路由队列管理机制,如Droptail、RED和CBQ;路由算法;以及无线网络WLAN、移动IP和卫星通信网络等模块。
也为进行局域网的模拟实现了多播协议以及一些MAC子层协议。
3.2 NS2的功能模块NS2仿真器封装了许多功能模块,最基本的是节点、链路、代理、数据包格式等,下面对各个模块进行简单的介绍:(1)事件调度器:目前NS2提供了四种具有不同数据结构的调度器,分别是链表、堆、日历表和实时调度器。
(2)节点(node):是由TclObject对象组成的复合组件,在NS2中可以表示端节点和路由器。
(3)链路(link):由多个组件复合而成,用来连接网络节点。
所有的链路都是以队列的形式来管理封包的到达、离开和丢弃。
(4)代理(agent):负责网络层封包的产生和接收,也可以用在各个层次的协议实现中。
每个agent连接到一个网络节点上,由该节点给它分配一个端口号。
(5)封包(packet):由头部和数据两部封包成。
一般情况下,packet只有头部、没有数据部分。
(6)应用层(Application):流量产生器(Traffic generators)创建了各种不同的概率模型来模拟产生实际网络中的业务流,它建立在UDP代理之上;应用模拟器(Simulated application)产生建立在TCP代理之上的业务流。
(7)数据记录:Trace,功能是能够详细记录模拟过程,同时,用户也可以根据自己的需要记录模拟过程中的任何一个细节,模拟结束后会产生out.tr文件;Monitor,NS2中有两种监测,队列监测(Queue Monitoring)和流量监测(Per-Flow Monitoring)。
(8)动画演示Nam,是基于Tcl/Tk的动画演示工具,用来把模拟的过程用可视化的方式呈现出来,模拟结束后会产生out.man文件。
(9)数据分析:gawk。
awk是一种程序语言。
它具有一般程序语言常见的功能。
由于awk语言具有使用直译器(Interpreter)不需先行编译;变量无型别之分(Typeless),可使用文字当数组的注标(Associative Array)等特色,所以使用awk 撰写程序比起使用其它语言更简洁便利且节省时间。
awk还具有一些内建功能,使得awk擅于处理具资料列(Record),字段(Field)型态的资料。
此外,awk内建有pipe的功能,可将处理中的资料传送给外部的Shell命令加以处理,再将Shell 命令处理后的资料传回awk程序,这个特点也使得awk程序很容易使用系统资源。
而gawk是GNU所开发的awk,最初在1986年完成,之后不断改进和更新,gawk包含awk的所有功能。
3.3 Trace文件的格式(1)Event发生的事件类型。
+ 表示封包进入链路队列(Enqueue)- 表示封包离开链路队列(Dequeue)r 表示目的队列接受(receive)事件d 表示队列丢弃(drop)封包事件(2)time表示事件发生的时间(3)From node表示封包发送节点的id(4)From node表示封包传送目的节点的id(5)Pkt type表示封包类型(6)Pkt size表示封包的大小(7)Flags表示标志项(8)Fid为Flow id的简写,流标识符(9)Src addr表示源地址,格式为:node.port。
node为封包发送节点的id,port代表发送封包节点的端口号。
(10)Dst addr表示目的地址,格式为:node.port。
node为封包接收节点的id,port代表接收封包节点的端口号。
(11)Seq num封包的序列号(12)Pkt id封包的唯一标识符,表示封包的id。
3.4 CBR和FTP简介CBR:Constant Bit Rate,固定传输速率。
这是一个用来形容通信服务质量(Quality of Service,QoS)的术语。
和该词相对应的词是可变码率或可变比特率(Variable Bit Rate,缩写VBR)。
当形容编解码器的时候,CBR编码指的是编码器的输出码率(或者解码器的输入码率)应该是固定制(常数)。
当在一个带宽受限的信道中进行多媒体通信的时候CBR是非常有用的,因为这时候受限的是最高码率,CBR可以更好的易用这样的信道。
但是CBR不适合进行存储,因为CBR将导致没有足够的码率对复杂的内容部分进行编码(从而导致质量下降),同时在简单的内容部分会浪费一些码率。
FTP:File Transfer Protocol,文件传输协议,中文简称为“文传协议”,用于Internet上的控制文件的双向传输。
同时,它也是一个应用程序(Application)。
用户可以通过它把自己的PC与世界各地所有运行FTP的服务器相连,访问服务器上的大量程序和信息。
FTP的主要作用,就是让用户连接上一个远程计算机(这些计算机上运行着FTP服务器程序)查看远程计算机有哪些文件,然后把文件从远程计算机上复制到本地计算机,或把本地计算机的文件送到远程计算机去。
3.5 其他概念(1)丢包率:是一个比率,表示在单位时间内未收到的数据封包数与发送的数据封包数的比率,由于信号衰减、网络质量等诸多因素的影响,可能产生数据封包的丢失。
(2)端到端时延:是由各种因素引起的,包括打包和解包时延,以及网络传送时延,本文中主要讨论的是网络传输时延。
(3)吞吐量:单位时间内某个节点发送和接受的数据量,单位一般为b/s。
(4)抖动率:网络延迟的变化量,它是由同一应用的任意两个相邻数据包在传输路由中经过网络延迟而产生的,由相邻数据包延迟时间差除以数据包序号差得到。
4.实验步骤4.1 NS2的安装本文NS2的安装参照博文:/s/blog_53e4f67d0101f5tr.html最终运行NS2自带simple.tcl得到图1,以示成功:图1 NS2安装成功4.2 Tcl脚本运行本实验中编写的脚本simulator.tcl见附录一。
实际模拟的网络结构图如图2所示。
包含4个node,各节点之间都是以全双工的链路相连。
n0和n2之间链路的带宽为2Mbps,延迟为10ms,为DropTail队列方式;n1和n2之间链路带宽为2Mbps,延迟为10ms,也为DropTail队列方式;n2和n3之间链路的带宽为1.7Mbps,延迟为20ms,也为DropTail方式。
n0处有一个FTP的TCP流量产生器,n1处为CBR的UDP流量产生器,n3有一个接收TCP的sink和接收UDP的NULL。
图2 网络结构图仿真结束后,会产生两个档案,一个是out.nam,这是给NAM用的,用来把仿真的过程用可视化的方式呈现出来,这可以让我们很直观的方式去了解封包传送是如何从来源端送到接收端。
另一个档案是out.tr,这个档案记录了仿真过程中封包传送中所有的事件,例如第一笔记录是一个CBR的封包,长度为1000bytes,在时间0.1秒的时候,从n1传送到n2。
4.3 吞吐量、封包延迟、抖动率和封包丢失率4.3.1 封包延迟测量CBR封包端点到端点间延迟时间的程序写在measure-delay.awk中。
measure-delay.awk的具体代码查看附录。
在终端输入如下命令:gawk -f measure-delay.awk out.tr > cbr_delay此指令将运行结果存储到cbr_delay文件中,以便进行绘图。
接着输入gnuplot,得到下图接着按下图输入,为接下来要画的时延图做标识:运行上图最后一条指令后得到图3:图3 封包延迟随时间的变化4.3.2 抖动率抖动率就是延迟时间变化量delay variance,由于网络的状态随时都在变化,有时候流量大,有时候流量小,当流量大的时候,许多封包就必需在节点的队列中等待被传送,因此每个封包从传送端到目的地端的时间不一定会相同,而这个不同的差异就是所谓的Jitter。
Jitter越大,则表示网络越不稳定。
量测CBR flow抖动率的代码写在measure-jitter.awk内,具体见附录。
运行方法仿照4.3.1,可得下图4:图4 抖动率随封包序列的变化4.3.3 封包丢失率测量CBR封包丢失率的代码写在measure-drop.awk内,具体见附录。
运行awk -f measure-drop.awk out.tr > cbr_drop后,可在cbr_drop中找到如下信息:其中第一行表示CBR总共送出了550个封包,丢失了8个。
第二行表示总的丢包率为0.014545。
接下来的几行中,第一列表示时间,第二列表示丢包率。
仿照上两例,只不不过为了利用gnuplot,要把先把前两行删除。
最终可得丢包率随时间的变化如图5所示:图5 封包丢失率随时间的变化4.3.4 吞吐量量测CBR吞吐量的代码写在measure-throughput.awk内,具体见附录。
图6 吞吐量随时间的变化5.实验结果分析从丢包率、时延、吞吐量和抖动率的变化图中,可以看出当丢包率增加时,端到端之间的时延也在增加,而吞吐量则下降,丢包率、时延和吞吐量在表示网络性能的好坏时有一定的关系。
在时延的变化图中,在一刚开始的时候,由于只有CBR的封包,所以端到端时延都是固定的,但在1.0秒后,网络多了FTP的封包,这使得CBR封包和FTP封包必须互相的抢夺网络的资源,因此端到端时延变得不在固定,但等到FTP传输结束后,CBR封包的端到端时延又变成是固定值了。