nike,costofcapital资本成本分析案例
cost of capital acca 计算

cost of capital acca 计算成本资本是指企业为了筹集资金所要支付的利息和股息的成本。
ACCA考试中的成本资本题目主要涉及到成本资本的计算和应用。
本文将通过解释成本资本的概念、计算方法以及应用案例,详细说明ACCA考试中与成本资本有关的内容。
首先,我们来了解成本资本的概念。
成本资本是企业为了融资所要支付的成本,它是企业投入资本的机会成本。
成本资本通常由债务和股权的成本构成。
债务的成本是企业支付借款利息所产生的成本,而股权的成本则是企业支付股息所产生的成本。
企业需要知道自己的成本资本,以便在决策过程中对不同项目进行评估和决策。
其次,我们要了解成本资本的计算方法。
成本资本的计算可以采用权益成本法和加权平均成本法。
权益成本法是基于股权的成本计算方法,它通过计算股息和股权市场价格得出成本资本。
加权平均成本法是基于债务和股权的比例计算方法,它通过将债务和股权的成本加权平均得出成本资本。
在ACCA考试中,一般会给出具体的数据,要求学员使用特定的计算方法来计算成本资本。
最后,我们来看一下成本资本在实际案例中的应用。
成本资本的使用通常涉及到投资决策、资本预算和市场估值。
企业在做投资决策时需要比较项目的收益率与成本资本的大小,以判断该项目的可行性。
同时,在资本预算过程中,企业也需要考虑成本资本,以确定投资项目的优先次序。
另外,市场估值也需要考虑成本资本,投资者通常会使用成本资本来计算股票的内在价值。
在ACCA考试中,成本资本经常出现在资本预算和投资决策的题目中。
学员需要掌握成本资本的概念和计算方法,以便在考试中准确回答相关问题。
此外,了解成本资本的应用案例也能帮助学员更好地理解和应用这一概念。
总结起来,ACCA考试中的成本资本题目涉及到成本资本的计算和应用。
学员需要掌握成本资本的概念、计算方法和应用案例,以便在考试中准确回答问题。
通过学习和理解这些内容,学员可以更好地应对ACCA考试中关于成本资本的题目。
资本成本问题研究TheCostofCapital
绝大部分分析者运用5%到 6.5%的 比率作 为市场风险补偿 (RPM)
贝他值的估计在资本资产定价模型中是一 个至关紧要的数据. 美国的有关贝他值数 据请登陆网站浏览 .
我国上市公司贝他值(β)的估计还不是 很规范,但通过有关证券分析机构可以获 得此类数据。
Coca-Cola (KO)
6.9 33.8%
H.J. Heinz (HNZ)
6.5 74.9%
Georgia-Pacific (GP)
5.9 69.9%
9-5
资本成本与企业财务管理
公司总资本成本 12%
A子公司资本成本 10%
B子公司资本成本 12%
C子公司资本成本 14%
甲项目资本成本 8%
乙项目资本成本 12%
9 - 12
债务成本
方法 1: 咨询投资银行适用于新增债务上 的利率水平.
方法 2: 以其他类似信用评级债券的利率 水平作为债务成本.
方法 3: 计算、估计公司债券的报酬率.
9 - 13
债务资本成本的估计
如果实际的融资成本不是很高,则可以 契约中商定的利率水平作为税前资本成 本。银行贷款等的资本成本大体可以这 样计算。
投资者选择问题
9 - 25
invest
S h a re ho ld e r
in ve st
F ir m
return
re tu rn
Financial M arket
P ro je c t
只有当企业投资项目的期望报酬率高于同等级风险的金融投资的报酬 率水平(即投资者的要求报酬率)的时候,股票投资者才会希望将资 金投入到企业中.
9 - 41
股利增长模型方法的优劣势
nike案例分析

Her risk free rate comes from 20-year T-bond rate Cohen uses average beta from 1996 to July 2001, 0.80. Cohen uses a geometric mean of market risk premium 5.9%
The WACC
Thus, my calculation of the WACC is as follow:
4.44%*0.101 + 9.81%*0.899 = 9.27%
What should Kimi Ford recommend regarding an investment in Nike?
Cost of debt
The WACC is used for discounting cash flows in the future, thus all components of cost must reflect firm’s concurrent or future abilities in raising capital. Cohen mistakenly uses the historical data in estimating the cost of debt. She divided the interest expenses by the average balance of debt to get 4.3% of before tax cost of debt. It may not reflect Nike’s current or future cost of debt.
Comments on cost of equity – The market risk premium
耐克公司案例中文版
耐克公司:资本成本2001年7月5日,KIMI FORD,NORTHPOINT 集团(实际是一家基金管理公司)的portforlio经理,仔细思考着分析人员关于耐克公司的积极评论。
耐克的股票价格从年初开始显著下跌。
FORD正在考虑为她管理的NORTHPOINT 大资本基金公司购买一些股份,这家基金公司主要投资财富杂志世界500强企业,其重点是价值投资。
它持有最多的股份包括埃克森公司、通用公司、麦当劳、3M及其它大企业,通常是经济历史悠久的股票。
虽然股票市场在过去18个月下跌,NORTHPOINT大资本基金公司却表现极好。
2000年,这家基金回报率20.7%,而S&P500甚至下跌了10.1%。
到2001年6月底,这家基金的YEAR-TO-DATE回报率为6.4%,而S&P500为7.3%。
一个星期前的2001年6月28日,耐克公司组织了分析人员会议,发布2001财政年度业绩(耐克的财务年度结束于每年5月份)。
不过,这次会议还有另外一个目的:耐克公司管理层希望沟通重振公司的战略。
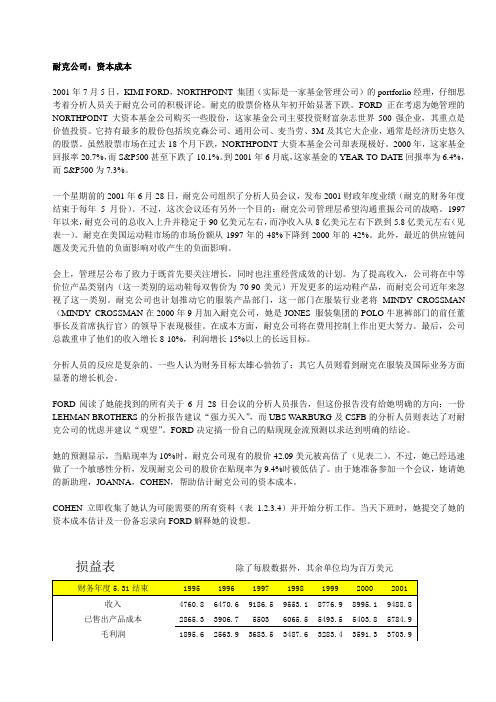
1997年以来,耐克公司的总收入上升并稳定于90亿美元左右,而净收入从8亿美元左右下跌到5.8亿美元左右(见表一)。
耐克在美国运动鞋市场的市场份额从1997年的48%下降到2000年的42%。
此外,最近的供应链问题及美元升值的负面影响对收产生的负面影响。
会上,管理层公布了致力于既首先要关注增长,同时也注重经营成效的计划。
为了提高收入,公司将在中等价位产品类别内(这一类别的运动鞋每双售价为70-90美元)开发更多的运动鞋产品,而耐克公司近年来忽视了这一类别。
耐克公司也计划推动它的服装产品部门,这一部门在服装行业老将MINDY CROSSMAN (MINDY CROSSMAN在2000年9月加入耐克公司,她是JONES 服装集团的POLO牛崽裤部门的前任董事长及首席执行官)的领导下表现极佳。
在成本方面,耐克公司将在费用控制上作出更大努力。
Nike, Cost of Capital 资本成本分析案例 PPT

该内在价值高于股票现价42.09美元,因此,股票价格被低估。可以进行投资。
案例问题
3
• Joanna计算的WACC有哪些错误? • 正确的计算方法是什么? • 计算正确的WACC • 计算每股的内在价值
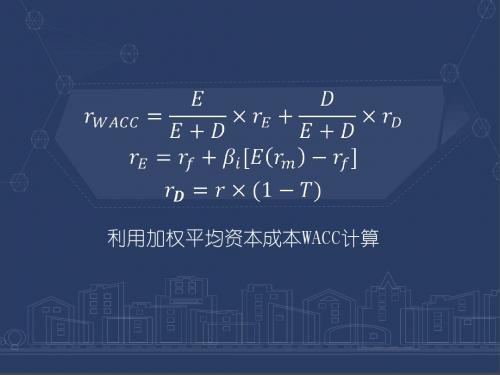
什么是WACC
4
加权平均资本成本:英文Weighted Average Cost of Capital的缩写。WACC代表公司整体平均资金 成本,
Joanna的错误有哪些?
正确的WACC算法
7
其中,T取38%,则可计算得: RWACC=90%*7.661%+10%*7.167%*(1-38%)=7.333%
每股内在价值
8
每股的内在价值需要先计算出公司的内在价值,扣除负债得到股东权益价值, 再通过股东权益价值除去流通股数量。 本案例报告使用现金流量法来估算NIKE公司的内在价值。
1 Nike,inc:cost of cApital
案例背景
2
NorthPoint集团是美国一家基金公司,主要投资 于财富杂志评出的世界500强企业。Kimi Rord是 NorthPoint集团的一名证券投资部经理, 正在考 虑是否投资Nike公司的股份。Joanna Cohen, 作 为Kimi的助理,向Kimi提交了她的资本成本评估 报告。
Nike 1964年由Philip H. Knight在奥勒冈州 (Beaverton,Oregon.)创立,是一家美国体育用 品生产商,主要生产运动鞋、运动服装、体育 用品,以自己的品牌销售,分销商遍布全球。 Nike成立以来发展迅速,已成为全球体育用品的 代表性品牌。但1997年-2001年以来,公司经营 业绩较差,因此部分投资者持观望态度。
Nike Inc., Cost of Capital案例原文

Graduate School of Business Administration University Version 2.0 of VirginiaUVA-F-1353 Version 2.0Nike, Inc.: Cost of Capital On July 5, 2001, Kimi Ford, a portfolio manager at NorthPoint Group, a mutual fund management firm, pored over analyst write-ups of Nike, Inc., the athletic shoe manufacturer. Nike’s share price had declined significantly from the start of the year. Kimi was considering buying some shares for the fund she managed, the NorthPoint Large-Cap Fund, which invested mostly in Fortune 500 companies with an emphasis on value investing. Its top holdings included ExxonMobil, General Motors, McDonald’s, 3M and other large-cap, generally old-economy stocks. While the stock market declined over the last 18 months, NorthPoint Large-Cap had performed extremely well. In 2000, the fund earned a return of 20.7 percent even as the S&P 500 fell 10.1 percent. The fund’s year-to-date returns at the end of June, 2001 stood at 6.4 percent versus the S&P 500’s minus 7.3 percent. Only a week ago, on June 28, 2001, Nike held an analysts’ meeting to disclose its fiscal year 2001 results1. However, the meeting had another purpose: Nike management wanted to communicate a strategy for revitalizing the company. Since 1997, Nike’s revenues had plateaued at around $9 billion, while net income had fallen from almost $800 million to $580 million (see Exhibit 1). Nike’s market share in U.S. athletic shoes had fallen from 48 percent in 1997 to 42 percent in 2000.2 In addition, recent supply-chain issues and the adverse effect of a strong dollar had negatively affected revenue. At the meeting, management revealed plans to address both top-line growth and operating performance. To boost revenue, the company would develop more athletic shoe products in the mid-priced segment3 – a segment that it had overlooked in recent years. Nike also planned to push its apparel line, which, under the recent leadership of industry veteran Mindy Grossman4 had performed extremely well. On the cost side, Nike would exert more effort on expense control. Finally, company executives reiterated their long-term revenue growth targets of 8-10 percent, and earnings growth targets of above 15 percent.Nike’s fiscal year ended in May. Robson, Douglas, “Just Do…Something: Nike’s insularity and foot-dragging have it running in place”, Business Week, July 2, 2001 3 Sneakers in this segment sold for $70-$90 a pair. 4 Mindy Grossman joined Nike in September 2000. She was the former president and chief executive of Jones Apparel Group's Polo Jeans division.2 1This case was prepared from publicly available information by Jessica Chan under the supervision of Professor Robert F. Bruner. The financial support of the Batten Institute is gratefully acknowledged. This case was written as a basis for class discussion rather than to illustrate effective or ineffective handling of an administrative situation. Copyright 2001 by the University of Virginia Darden School Foundation, Charlottesville, VA. All rights reserved. To order copies, send an e-mail to dardencases@. No part of this publication may be reproduced, stored in a retrieval system, used in a spreadsheet, or transmitted in any form or by any means— electronic, mechanical, photocopying, recording, or otherwise—without the permission of the Darden School Foundation. Rev. 10/02.-2-UVA-F-1353Analyst reactions were mixed. Some thought the financial targets to be too aggressive; others saw significant growth opportunities in apparel and in Nike’s international businesses. Kimi Ford read all the analyst reports that she could find about the June 28 meeting, but the reports gave her no clear guidance: a Lehman Brothers report recommended a ‘Strong Buy’ while UBS Warburg and CSFB analysts expressed misgivings about the company and recommended a ‘Hold’. Kimi decided instead to develop her own discounted-cash-flow forecast to come to a clearer conclusion. Her forecast showed that at a discount rate of 12 percent, Nike was overvalued at its current share price of $42.09 (see Exhibit 2). However, she had done a quick sensitivity analysis that revealed Nike was undervalued at discount rates below 11.2 percent. Since she was about to go into a meeting, she requested her new assistant, Joanna Cohen, to estimate Nike’s cost of capital. Joanna immediately gathered all the data she thought she might need (Exhibits 1 through 4) and set out to work on her analysis. At the end of the day, she submitted her cost of capital estimate and a memo (Exhibit 5) explaining her assumptions to Ms. Ford.-3-UVA-F-1353Exhibit 1 Nike, Inc.: Cost of Capital Consolidated Income StatementsYear Ended May 31 (In millions except per share data) Revenues Cost of goods sold Gross profit Selling and administrative Operating income Interest expense Other expense, net Restructuring charge, net Income before income taxes Income taxes Net income Diluted earnings per common share Average shares outstanding (diluted) Growth (%) Revenue Operating income Net income Margins (%) Gross margin Operating margin Net margin Effective tax rate (%)* 1995 1996 1997 1998 1999 2000 20014,760.8 2,865.3 1,895.6 1,209.8 685.8 24.2 11.7 649.9 250.2 399.7 1.36 294.06,470.6 3,906.7 2,563.9 1,588.6 975.3 39.5 36.7 899.1 345.9 553.2 1.88 293.69,186.5 5,503.0 3,683.5 2,303.7 1,379.8 52.3 32.3 1,295.2 499.4 795.8 2.68 297.09,553.1 6,065.5 3,487.6 2,623.8 863.8 60.0 20.9 129.9 653.0 253.4 399.6 1.35 296.08,776.9 5,493.5 3,283.4 2,426.6 856.8 44.1 21.5 45.1 746.1 294.7 451.4 1.57 287.58,995.1 5,403.8 3,591.3 2,606.4 984.9 45.0 23.2 (2.5) 919.2 340.1 579.1 2.07 279.89,488.8 5,784.9 3,703.9 2,689.7 1,014.2 58.7 34.1 921.4 331.7 589.7 2.16 273.335.9 42.2 38.442.0 41.5 43.94.0 (37.4) (49.8)(8.1) (0.8) 13.02.5 15.0 28.35.5 3.0 1.839.6 15.1 8.5 38.540.1 15.0 8.7 38.636.5 9.0 4.2 38.837.4 9.8 5.1 39.539.9 10.9 6.4 37.039.0 10.7 6.2 36.0*The U.S. statutory tax rate was 35%. The state tax varied yearly from 2.5% to 3.5%. Source: Company's 10-K SEC filing, UBS Warburg-4Exhibit 2 Nike, Inc.: Cost of Capital Discounted Cash Flow Analysis2002 Assumptions: Revenue growth (%) COGS/Sales (%) S&A/Sales (%) Tax rate (%) Current assets/Sales (%) Current liabilities/Sales (%) Yearly depreciation and capex equal each other. Cost of capital (%) Terminal value growth rate (%) Discounted Cash Flow Operating income Taxes NOPAT Capex, net of depreciation Change in NWC Free cash flow Terminal value Total flows Present value of flows Enterprise value Less: current outstanding debt Equity value Current shares outstanding Equity value per share at 12% Sensitivity of equity value to discount rate: Discount rate 8.00% 8.50% 9.00% 9.50% 10.00% 10.50% 11.00% 11.17% 11.50% 12.00% 2003 2004 2005 2006 2007 2008 2009UVA-F-1353201020117.0 60.0 28.0 38.0 38.0 11.5 12.0 3.06.5 60.0 27.5 38.0 38.0 11.56.5 59.5 27.0 38.0 38.0 11.56.5 59.5 26.5 38.0 38.0 11.56.0 59.0 26.0 38.0 38.0 11.56.0 59.0 25.5 38.0 38.0 11.56.0 58.5 25.0 38.0 38.0 11.56.0 58.5 25.0 38.0 38.0 11.56.0 58.0 25.0 38.0 38.0 11.56.0 58.0 25.0 38.0 38.0 11.51,218.4 463.0 755.4 8.8 764.1 764.1 682.3 11,415.7 1,296.6 10,119.1 271.5 $ 37.271,351.6 513.6 838.0 (174.9) 663.1 663.1 528.61,554.6 590.8 963.9 (186.3) 777.6 777.6 553.51,717.0 652.5 1,064.5 (198.4) 866.2 866.2 550.51,950.0 741.0 1,209.0 (195.0) 1,014.0 1,014.0 575.42,135.9 811.7 1,324.3 (206.7) 1,117.6 1,117.6 566.22,410.2 915.9 1,494.3 (219.1) 1,275.2 1,275.2 576.82,554.8 970.8 1,584.0 (232.3) 1,351.7 1,351.7 545.92,790.1 1,060.2 1,729.9 (246.2) 1,483.7 1,483.7 535.02,957.5 1,123.9 1,833.7 (261.0) 1,572.7 17,998.7 19,571.5 6,301.5Current share price:$42.09Note: Terminal value is estimated using the constant growth model: Equity value $ 75.80 67.85 61.25 55.68 50.92 46.81 43.22 42.09 40.07 37.27 TV = FCF10 * (1 + Terminal value growth rate) WACC - g TV = $1,572.7 * (1.03) 12% - 3%-5Exhibit 3 Nike, Inc.: Cost of Capital Consolidated Balance SheetsMay 31, As of (In millions) Assets Current Assets: Cash and equivalents Accounts receivable Inventories Deferred income taxes Prepaid expenses Total current assets Property, plant and equipment, net Identifiable intangible assets and goodwill, net Deferred income taxes and other assets Total assets Liabilities and shareholders' equity Current Liabilities: Current portion of long-term debt Notes payable Accounts payable Accrued liabilities Income taxes payable Total current liabilities Long-term debt Deferred income taxes and other liabilities Redeemable preferred stock Shareholders' equity: Common stock, par Capital in excess of stated value Unearned stock compensation Accumulated other comprehensive income Retained earnings Total shareholders' equity Total liabilities and shareholders' equity 2000 2001UVA-F-1353$254.3 1,569.4 1,446.0 111.5 215.2 3,596.4$304.0 1,621.4 1,424.1 113.3 162.5 3,625.31,583.4 410.9 266.2 $ 5,856.91,618.8 397.3 178.2 $ 5,819.6$50.1 924.2 543.8 621.9 2,140.0 470.3 110.3 0.3$5.4 855.3 432.0 472.1 21.9 1,786.7 435.9 102.2 0.32.8 369.0 (11.7) (111.1) 2,887.0 3,136.0 $ 5,856.92.8 459.4 (9.9) (152.1) 3,194.3 3,494.5 $ 5,819.6Source: Company 10-K SEC filing.-6-UVA-F-1353Exhibit 4 Nike, Inc.: Cost of Capital Capital Market and Financial Information On or Around July 5, 2001Current yields on U.S. Treasuries 3-month 6-month 1-year 5-year 10-year 20-year 3.59% 3.59% 3.59% 4.88% 5.39% 5.74%Nike Share Price Performance Relative to S&P500: January 2000 to July 5, 20011.3 1.2 1.1 1.0 0.9 0.8 0.7 0.6 0.5 0.4 Feb-00 Aug-00 May-00 Sep-00 Feb-01 May-01 Nov-00 Jan-00 Jun-00 Jan-01 Jun-01 Jul-00 Mar-00 Apr-00 Mar-01 Dec-00 Oct-00 Apr-01 Jul-01Historical Equity Risk Premiums (1926-1999) Geometric mean 5.90% Arithmetic mean 7.50% Current Yield on Publicly Traded Nike Debt* Coupon 6.75% paid semi-annually Issued 07/15/96 Maturity 07/15/21 Current Price $ 95.60 Nike Historic Betas 1996 1997 1998 1999 2000 YTD 06/30/00 AverageNikeS&P 5000.98 0.84 0.84 0.63 0.83 0.69 0.80Nike share price on July 5, 2001: Dividend History and Forecasts Paymt Dates 31-Mar 30-Jun 1997 0.10 0.10 1998 0.12 0.12 1999 0.12 0.12 2000 0.12 0.12 2001 0.12 0.12$42.0930-Sep 0.10 0.12 0.12 0.1231-Dec 0.10 0.12 0.12 0.12Total 0.40 0.48 0.48 0.48Consensus EPS estimates: FY 2002 FY 2003 $ 2.32 $ 2.67Value Line Forecast of Dividend Growth from '98-00 to '04-'06: 5.50%* Data have been modified for teaching purposes. Sources of data: Bloomberg Financial Services, Ibbotson Associates Yearbook 1999, Value Line Investment Survey, IBES-7Exhibit 5 Nike, Inc.: Cost of Capital Joanna’s Analysis TO: FROM: DATE: SUBJECT: Kimi Ford Joanna Cohen July 6, 2001 Nike’s Cost of CapitalUVA-F-1353Based on the following assumptions, my estimate of Nike’s cost of capital is 8.4 percent: I. Single or Multiple Costs of Capital? The first question I considered was whether to use single or multiple costs of capital given that Nike has multiple business segments. Aside from footwear, which makes up 62 percent of revenue, Nike also sells apparel (30 percent of revenue) that complement its footwear products. In addition, Nike sells sport balls, timepieces, eyewear, skates, bats, and other equipment designed for sports activities. Equipment products account for 3.6 percent of revenue. Finally, Nike also sells some non-Nike branded products such as Cole-Haan dress and casual footwear, and ice skates, skate blades, hockey sticks, hockey jerseys and other products under the Bauer trademark. Non-Nike brands account for 4.5 percent of revenue. I asked myself whether Nike’s business segments had different enough risks from each other to warrant different costs of capital. Were their profiles really different? I concluded that it was only the Cole-Haan line that was somewhat different; the rest were all sports-related businesses. However, since Cole-Haan makes up only a tiny fraction of revenues, I did not think it necessary to compute a separate cost of capital. As for the apparel and footwear lines, they are sold through the same marketing and distribution channels and are often marketed in "collections" of similar design. I believe they face the same risk factors, as such, I decided to compute only one cost of capital for the whole company. II. Methodology for Calculating the Cost of Capital: WACC Since Nike is funded with both debt and equity, I used the Weighted Average Cost of Capital (WACC) method. Based on the latest available balance sheet, debt as a proportion of total capital makes up 27.0 percent and equity accounts for 73.0 percent:-8Capital sources Book Values Debt Current portion of long-term debt $ 5.4 Notes payable 855.3 Long-term debt 435.9 $ 1,296.6 Equity III. Cost of Debt $3,494.5UVA-F-135327.0% of total capital 73.0% of total capitalMy estimate of Nike’s cost of debt is 4.3 percent. I arrived at this estimate by taking total interest expense for the year 2001 and dividing it by the company’s average debt balance.5 The rate is lower than Treasury yields but that is because Nike raised a portion of its funding needs through Japanese yen notes, which carry rates between 2.0 percent to 4.3 percent. After adjusting for tax, the cost of debt comes out to 2.7 percent. I used a tax rate of 38 percent, which I obtained by adding state taxes of 3 percent to the U.S. statutory tax rate. Historically, Nike’s state taxes have ranged from 2.5 percent to 3.5 percent. IV. Cost of Equity I estimated the cost of equity using the Capital Asset Pricing Model (CAPM). Other methods such as the Dividend Discount Model (DDM) and the Earnings Capitalization Ratio can be used to estimate the cost of equity. However, in my opinion, CAPM is the superior method. My estimate of Nike’s cost of equity is 10.5 percent. I used the current yield on 20-year Treasury bonds as my risk-free rate, and the compound average premium of the market over Treasury bonds (5.9 percent) as my risk premium. For beta I took the average of Nike’s beta from 1996 to the present. V. Putting it All Together Inputting all my assumptions into the WACC formula, my estimate of Nike’s cost of capital is 8.4 percent. WACC = Kd (1-t) * D/(D+E) + Ke * E/(D+E) = 2.7% * 27.0% + 10.5% * 73.0% = 8.4%5Debt balances as of May 31, 2000 and 2001 were $1,444.6 and $1,296.6 respectively.。
Nike企业管理分析

历经峥嵘的”JIST DO IT””JIST DO IT",是美国著名的运动鞋生产商Nike的企业口号,也是其文化个性鲜明的体现——“体育、表演、洒脱自由的运动员的精神”,这一反传统观念的企业形象的树立与发扬,甚至输出国际,都要从其创办人菲利浦·奈特的汽车行李箱里诞生Nike的传奇性故事开始。
第一集Nike的崛起如果要问是谁造就了Nike的今天,很多人会指向Nike公司创建者和CEO菲利浦·奈特,但最根本的我认为是阿迪达斯的嚣张。
由于阿迪达斯的高价位使很多热爱运动的穷人望而却步,具有商业头脑的奈特抓住了最广大的群体,又随着“慢跑热"的兴起,在商业巨头的眼皮底下跑步进入了运动服饰的市场,开始了传奇的谱写。
一个故事的开始肯定会有一个主旨贯穿全文,而奈特的目标很简单——干掉阿迪达斯。
但是想把拥有市场三分之一的阿迪达斯并非易事,不光要有勇气,还有上帝的青睐。
为了能在运动产品市场站住脚,奈特并没有过度激进的与当时的三巨头正面对决(当然他也没有那个实力),他抓住了当时的社会趋势——运动的普及。
随着运动的大众化,专业领域的产品便显得有些过时,市场要求更富有美感和多元化的产品,所以奈特便从最普通的跑鞋下手,打造出符合大众的跑鞋。
因此确立了Nike的首要一个战略目标—-占据美国市场。
树立了目标之后,接下来便要围绕这个目标进行战略分析,了解内外部环境是第一步。
1。
外部环境当时的美国的市场大部分由Adidas,Puma,Tiger三家瓜分,怎样做才能占有一席之地呢?先由最为经典的SWOT分析法对Nike的市场开拓进行分析:2。
内部环境Nike创建初期,各种制度不完善,资金不足,很容易导致资本的流失,仅仅凭借自己的专利技术想在市场站稳脚是不可能的,必须寻找一个切实的突破口,才能打进市场。
但是这正是Nike早起能迅速崛起的一个动因,由于制度的不健全,菲尔·奈特和鲍尔曼才能控制Nike的全部运营,在企业行为反应较快的情况下能将设想迅速变成现实,这是Nike初期内部环境的一大优势。
Nike
计算税后债务资本成本资Fra bibliotek三本案例中无数据表明应付票据带息,即不会对债务资本成本产生影响, 所以债务资本仅含一个营业周期内到期的长期负债和长期负债。 而Joanna Cohen将应付票据计入债务,不合理。
重新计算:2000年末债务=50.1+470.3=520.4 2001年末债务=5.4+435.9=441.3 2001年平均债务=(520.4+441.3)/2=480.85
计算税后债务资本成本
资料一
计算权益资本成本
资料四
计算综合资本成本
资料三
公司带息债务的市场价值D为5.4+435.9=441.3 公司权益的市场价值Joanna Cohen采用的是合并资
产负债表中的3494.5,不能反映未来的情况。
计算综合资本成本
资 料 二
耐克案例分析
耐克公司:资本成本案例分析一案例背景1997年以来,耐克公司的总收入上升并稳定于90亿美元左右,而净收入从8亿美元左右下跌到5.8亿美元左右(见表一)。
耐克在美国运动鞋市场的市场份额从1997年的48%下降到2000年的42%。
2001年6月28日,耐克公司发布2001财政年度业绩(耐克的财务年度结束于每年5月份)。
借此次会议,公司管理层希望沟通重振公司的战略。
会上,管理层公布了致力于既首先要关注增长,同时也注重经营成效的计划。
为了提高收入,公司将在中等价位产品类别内(这一类别的运动鞋每双售价为70-90美元)开发更多的运动鞋产品,同时计划推动它的服装产品部门。
在成本方面,耐克公司将在费用控制上作出更大努力。
最后,公司总裁重申了他们的收入增长8-10%,利润增长15%以上的长远目标。
KIMI FORD,NORTHPOINT 集团(实际是一家基金管理公司)的portforlio 经理,正在考虑为她管理的NORTHPOINT 大资本基金公司购买一些耐克公司的股份。
而不同的分析人员所提供的报告,给了她完全相反的建议。
一份LEHMAN BROTHERS的分析报告建议“强力买入”,而UBS WARBURG及CSFB的分析人员则表达了对耐克公司的忧虑并建议“观望”。
于是,FORD请她的新助理,JOANNA,COHEN,帮助估计耐克公司的资本成本。
COHEN立即收集了她认为可能需要的所有资料(表1.2.3.4)并开始分析工作,并得出了耐克公司的资本成本为8.3%的结论。
二案例分析我们组经过数次认真的讨论,对JOANNA 用以估计耐克公司资本成本的每一步骤进行了论证,一致不同意她关于耐克资本成本的计算方法及结果。
下面简要分述我组的分析结果。
1资本成本是单重或多重:在这个问题上我们同意JOANNA的分析结果。
耐克公司虽然有多个业务划分,占销售收入62%的鞋类,30%的服装类以及3.6%的运动设备,由此可见95.6%的产品都是与运动相关的业务,他们都是通过同样的市场和分销渠道来销售,而至于Cole-Haan服装及休闲服以及BAUER商标下的其它产品等非耐克商标仅占销售收入的4.5%,不足以因此影响整个公司的资本成本,所以我组也认为耐克公司应该以一个资本成本进行计算2计算资本成本方法:WACC和大部分的公司一样,耐克公司的资本主要来源于:债务资本和权益资本。
成本领先案例范文
成本领先案例范文成本领先是企业在同行业中以较低的成本生产产品或提供服务的能力。
它是企业获得竞争优势的一种重要方式,可以通过降低成本来提高利润率或以更低的价格销售产品,从而吸引更多的顾客。
以下是一些成功的成本领先案例:1. 沃尔玛(Wal-Mart):沃尔玛是全球最大的零售商之一,其成本领先地位是其成功的关键之一、沃尔玛通过建立高度有效的供应链管理系统,在采购、库存管理和物流等方面实现了规模经济,从而降低了成本。
此外,沃尔玛还通过大规模采购来获得更好的价格,并通过精确的定价策略来确保其产品的竞争力。
2. 耐克(Nike):作为世界领先的运动鞋和运动服饰制造商之一,耐克通过与供应商建立长期合作伙伴关系,实现了成本领先。
耐克通过全球范围内的供应链网络,将制造成本最小化,并通过技术创新和研发投资来提高生产效率。
此外,耐克还通过合理的定价、品牌营销和渠道管理来确保其产品的市场占有率和利润率。
3. 亚马逊(Amazon):作为全球最大的电子商务公司之一,亚马逊通过高效的物流和配送系统实现了成本领先。
亚马逊通过在全球建立大型仓库和物流中心,实现了规模经济,并通过自动化技术和先进的物流管理系统,提高了物流和配送效率。
此外,亚马逊还通过高度优化的网站和智能算法来提供个性化的购物体验,从而吸引更多的顾客。
4. 海尔(Haier):作为中国最大的家电制造商之一,海尔通过减少成本和提高效率来实现了成本领先。
海尔通过优化供应链和生产流程,实现了规模经济,并通过智能制造和自动化技术来提高生产效率。
此外,海尔还通过全球化战略和多品牌战略来扩大市场份额,并通过创新的销售模式和服务模式来提高利润率。
5. 麦当劳(McDonald's):作为全球最大的连锁快餐公司之一,麦当劳通过高效的供应链和标准化的菜单来实现了成本领先。
麦当劳通过与供应商建立长期合作伙伴关系,以大量采购来获得更好的价格,并通过自动化设备和流程来提高餐厅的生产效率。
Nike--Cost-of-Capital-资本成本分析案例

1. What is the WACC and why is it important to estimate a firm’s cost of capital? Do you agree with Joanna Cohen’s WACC calculation? Why or why not?1.1 The definition of WACCWeighted average cost of capital(WACC), is a weighted-computational method of analyzing the cost of capital based on the whole capital structure of a firm. The result of WACC is the rate a firm use to monitor the application of the current assets because it represents the return the firm MUST get. For example this rate could be used as the discount rate of evaluating an investment, and maintaining the price of firm’s stock.1.2 Analysis of Johanna Cohen’s calculationWe analyzed the process of Johanna Cohen’s calculation, and found some flaws we believe caused computational mistakes.i. When using the WACC method, the book value of bond is available as themarket value since bonds are not quite active in the market, but the book value of equity isn’t. Instead of Johanna’s using equity’s book value, we should multiply the current price of Nike’s stock price by the numbers of shares outstanding.ii. When calculating the YTM of the firm’s bond, Johanna only used the interest expense of the year divided by the average debt balance, which fully ignored the discounted cash flow of the cost of debt.2. If you do not agree with Cohen’s analysis, calculate your own WACC for Nike and be prepared to justify your assumptions. Combining the analysis above, we now give our own WACC calculation as following: 2.1 The value of debt(based on EXIHIBIT 3).Since the book value of debt may represent the market value, we merely need to sum up the values of Long-term debt, Notes payable, and the Current portion of long-term debt:435.9+855.3+5.4=$1,296.6 m2.2 The cost of debt (based on EXIHIBIT 4):PV: -95.6FV: 100n: 40Pmt: 6.75/2= 3.375 (as it pays semiannually)So, we get the YTM is i*2=3.58*2=7.16%2.3 The value of equity (based on EXIHIBIT 1&4):Price of stock * numbers of shares outstanding= 42.09*273.3=$11,503.2m2.4 The cost of equity (based on EXIHIBIT 4):E(R i) = R f +【E(R m) - R f】* βiBecause the government bond yield is 5.74%, Geometrical historical risk premium is 5.90%, and the average historical βof Nike is 0.80, then we get:E(R i)= 5.74%+5.90%* 0.8=10.46%2.5 Weights of each security (based on 2.1&2.3)Weight of debt=1,296.6/(1,296.6+11,503.2)=10.13%Weight of equity=11427.44/(1,296.6+11,503.2)=89.87%2.6 Cost of capital by WACC method (based above):Cost of capital = Weight of debt * Cost of debt * (1 – Tax rate) + Weight of equity * Cost of equity = 10.13% * 7.16%* (1-0.38) + 89.87% * 10.46% = 9.85%3. Calculate the costs of equity using CAPM, the dividend discount model, and the earnings capitalization ratio. What are the advantages and disadvantages of each method?3.1 Calculating the costs of equity by CAPM, and its advantages & disadvantagesi. Calculation:According to 2.4, we have already got the result of CAPM, which is 10.46%.ii. AdvantagesFirst, because CAPM is a theory based on the whole market, it obviously includes the effects between the market as the integrity and each individual stock. Second, with the counterbalance among each stock in the entire market, CAPM only needs the consideration of systematic risk, which much simplifies the calculation. Third, CAPM also bypasses the specific values of future cash flow because the equation is actually the relation between systematic risk and return rate, which is also another simplification of calculating. Fourth, merely depending on the systematic risk, CAPM could offer the investors a reliable discounting rate to assess the value of a certain investment.iii. Disadvantages:First, involving the counterbalance among the entire market, CAPM acquiesces an effective, active and healthy market environment. Second, comparing the consideration of market risk, CAPM may omit the subtle risk differences among each single firm. Third, the crucial systematic risk, the beta coefficient, is obviously hard to calculate.3.2 Calculating the costs of equity by DDM, and its advantages & disadvantagesi. Calculation (based on EXIHIBIT 4)::Based on the dividend discount model, P0 = D0 * (1+g) / (k – g), then we get the return rate (the cost of equity) k = D0 * (1+g) / P0 + g = 0.48 * (1 + 0.055) /42.09 + 0.055 = 6.7%ii. AdvantagesFirst, DDM fully considers the time value of consistent cash flow of an investment. Second, it is pretty easy to get the necessary historical data. Third DDM is flexible enough for the adjustment of any future situation. Fourth, once the growth pattern is confirmed, it is very straightforward to get the discount rate of assessing an investment.iii. DisadvantagesFirst, without enough consideration of risk cost, DDM may underestimate theequity cost. Second, all of the data is based on historical record, so the resultis not reliable considering of the future situations. Third, with thepredetermined growth rate, it is obviously practical for the stock investors toestimate the possible profit, but may mislead the stock issuing firm from abetter budgeting decision to a comparatively unsubstantial investment.3.3 Calculating the costs of equity by the earnings capitalization ratio, and itsadvantages & disadvantagesi. Calculation (based on EXIHIBIT 1&4)According to the earnings capitalization model, we have cost of equity = E1 / P0 = 2.16 / 42.09 = 5.13%ii. AdvantagesFirst, it’s very e asy to calculate and understand. Second, it’s easy to get the necessary accounting dataiii. DisadvantagesWithout any consideration of the risk and the growth of the firm, it doesn’t reflect the true value of an investment or the cost of the budgeting at all.4. What should Kimi Ford recommend regarding an investment inNike?According to EXIHIBIT 2, the market’s forecasting sensitivity of equi ty value of Nike is 11.17%. But based on our own analysis by WACC, we believe the discount rate of Nike is around 9.85%. That means the market underestimated the value of Nike. So we recommend the Northpoint to purchase the stock of Nike.。
nike 成本管理方法

nike 成本管理方法标题:探究Nike的成本管理策略成本管理是企业经营中的重要环节,对于提升企业盈利能力和市场竞争力具有重要意义。
作为全球知名的运动品牌,Nike在成本管理方面有着独特的方法和策略。
本文将详细探究Nike的成本管理方法,以期为我国企业提供一些借鉴和启示。
一、Nike成本管理概述ike成立于1964年,经过五十多年的发展,已成为全球最大的运动鞋和运动服装供应商。
在其发展过程中,Nike始终重视成本管理,通过优化供应链、提高生产效率、降低生产成本等手段,实现了企业的可持续发展。
二、Nike成本管理方法1.供应链优化ike在全球范围内建立了庞大的供应链体系,通过与世界各地的优质供应商建立长期合作关系,实现了原材料和产品的快速采购与运输。
此外,Nike还采用了先进的供应链管理系统,实时监控库存和销售数据,确保产品能够及时满足市场需求,降低库存成本。
2.生产效率提升ike注重提高生产效率,通过引入自动化设备和精益生产技术,缩短了生产周期,降低了生产成本。
同时,Nike还与供应商共同研发新型材料和生产工艺,进一步降低产品成本。
3.外包策略ike采用外包生产模式,将生产环节委托给具有成本优势的发展中国家。
这一策略有助于降低劳动力成本,提高生产效率。
同时,Nike通过与外包供应商建立紧密的合作关系,确保产品质量和交货时间得到保障。
4.采购成本控制ike在采购环节实行严格的成本控制,通过与供应商进行价格谈判、批量采购和长期合作协议等方式,降低原材料和产品采购成本。
此外,Nike还通过共享供应商资源,与其他企业共同采购,进一步降低采购成本。
5.信息化管理ike高度重视信息化建设,通过建立全球范围内的信息系统,实现供应链、生产、销售等环节的实时监控和数据分析。
这有助于提高决策效率,降低运营成本。
三、总结ike的成本管理方法体现了其在全球范围内的资源配置和生产组织能力。
通过供应链优化、生产效率提升、外包策略、采购成本控制和信息化管理等一系列措施,Nike成功降低了生产成本,提高了市场竞争力。
如何进行企业的财务分析(以Nike为例)(英文)

ContentChapter 1: Introduction (1)1.1 Background of Nike (1)1.2 Management of Nike (1)1.3 Successful Story (2)1.4 Background of Puma (3)1.5 Management of Puma (3)1.6 Successful Story (4)Chapter 2: Financial Analysis (5)2.1 Vertical Analysis (5)2.2 Trend Analysis (6)2.3 Ratio Analysis (7)2.3.1 Profitable Ratio (7)2.3.2 Liquidity Ratio (9)2.3.3 Asset management ratio (10)2.3.4 Debt Utilization Ratio (12)2.3.5 Investments (14)Chapter 3: Financial Market and Impact (17)3.1 Global Economy (17)3.2Currency Fluctuations (17)3.3 Changes in Tax (18)3.4 Rising Input Cost (18)3.5 Intense Competitive Landscape (18)3.6 Product Counterfeiting Risk (19)Chapter 4: Challenges Faced and Solutions (19)4.1 High Inventory (19)4.1.1 Solution (20)4.2 High Production Cost (20)4.2.1 Solution (20)4.3 Selling and administrative expense (21)4.3.1 Solution (21)4.4 Tax rate (21)4.4.1 Solution (22)5. Summary and Future Outlook (22)5.1 Performance in Operating (22)5.1.1 Future Outlook (22)5.2 Performance in Financial Market (23)5.2.1 Future Outlook (23)Reference (24)Appendix 1:Nike Annual Report (27)Appendix 2 :Puma Annual Report (30)Appendix 3: Process of Calculation (33)Chapter 1: Introduction1.1 Background of NikeNike Inc., (Nike) was founded on January 25, 1964 as Blue Ribbon Sports by Bill Bowerman and Phil Knight and officially became Nike, Inc. on May 30, 1971. Headquartered in Beaverton, Oregon, Nike is the largest seller of athletic footwear and athletic apparel in the world and is traded on the New York Stock Exchange. The Company sells its products to retail accounts, through Nike owned retail stores and Internet sales, and through a mix of independent distributors and licensees, in approximately 190 countries around the world. Nike is a leader company in athletic footwear industry, which has strong corporate image and brand value delivering to its customers. Sustaining innovation lead Nike develop high technology in their effort to stay ahead of their competitors with its products (Nike Inc., 2013). Nike’s successful based on three main factors: engaged with effective marketing strategies, vividly advertising campaigns and outsourcing the production at low cost labor market as developing countries.1.2 Management of NikeNominating and Corporate Governance Committee of Nike the “Committee” considers and evaluates candidates for appointment or election to the Board of Directors. In evaluating potential candidates for suitability, the Committee considers many factors to identify individuals with the requisite intelligence, education, experience, and character to make significant contributions to the Board of Directors.Source From: Nike Board of Director and Executive /pages/executives1.3 Successful StoryBy the mid-1980s, Nike had slipped from its position as the industry leader, the debut of a new signature shoe for an NBA rookie by the name of Michael Jordan in 1985 helped bolster Nike’s bottom line. In 1989, Nike built on its momentum from the ‘Revolution’ campaign with the tagline “Just Do It.” In 1990s, Nike signed the World Cup-winning Brazilian National Team began designing the team’s distinctive uniform. Nike Golf landed named Eldrick “Tiger” Woods for a reported $5 million per year. Competitors lau ghed and critics howled at Nike’s "folly," until Tiger won the 1997 Masters by a record 12 strokes. In 2010, Nike signed Chinese tennis player Li Na, Algerian- French dancer Sofia Boutella, British hurdler Perri Shakes-Drayton, Russian-born tennis star Mar ia Sharapova, running a new project “Make Y ourself” campaign to target women customers (Roy, 2012). The Nike+ FuelBand mobile app launched in 2012, which can be seen as a transition from traditional advertising to new media there are series of interactive campaigns designed to engage consumers on a whole new level and stimulate conversation in the athletic community (Nike Inc., 2013).1.4 Background of PumaPuma AG Rudolf Dassler Sport (Puma) is a major German multinational company that produces athletic and casual footwear, as well as sportswear, headquartered in Herzogenaurach, Bavaria, Germany. The company was formed in 1924 as Gebrüder Dassler Schuhfabrik by Adolf and Rudolf Dassler. The relationship between the two brothers deteriorated until the two agreed to split in 1948, forming two separate entities, Adidas and Puma (Puma, 2013). Both companies are currently based in Herzogenaurach, Germany. Puma is one of the world’s largest providers of sport lifestyle footwear, apparel and accessories under the leading brands such as Alexander McQueen, Mihara, Rudolf Dassler Schuhfabrik, and P uma the black label. The company through its subsidiaries operates in more than 120 countries globally. The company, under its Footwear segment, is engaged in the designing, manufacturing and marketing of wide range of shoes for men, women, and juniors for various sports, including football, motor sport, cricket and golf.1.5 Management of PumaBoard of Directors: consists of both internal management directors and independent directors. The two groups of directors bring benefits to Nike the different knowledge and experience contributes into management it also provides another frame of overall board in thinking. Puma’s board would b e classified as an oversight board, playing an active role with regards to management’s decisions making of strategy. On the corporate level Puma’s strategy based on the mission “to be the first truly virtual sports company” that focus on building network of independent firm, suppliers and customers instead of managing activities of the value chain through direct ownership (Puma, 2013). In order to achieve this goals Puma has decentralized its structure and develop a virtual corporate structure which supported by organizational matrix. Managing the virtual structure, Puma create the group executive committee that incorporates the functions of brand management, product, and finance and growth management, legal and organizational structure in the central part.Source From:Puma Managing Director /category/company/managingdirectors/ 1.6 Successful StoryIn 1970, Brazilian football star Pele helped Brazil to win the World Cup in mexico wearing Puma football boots. Germany’s Boris Becker won Wimbledon wearing Puma shoes and playing with a Puma racket. Eight years later, Puma sold in big department stores for very little money that result in its shoes become expensive and no more competitive advantage. In 1993, Jochen Zeitz named chairman and CEO of Puma he cutting costs by 40% and then pushes Puma IPO on the German stock exchange. Shortly, Jochen Zeitz was offshoring Puma’s pro duction from German to Asia. Due to those business movements, Puma stop losing and earned $29 million on sales in 1996 (Puma, 2013).Chapter 2: Financial AnalysisThe global economic recession resulted in a significant slow-down in international trade and a sharp rise in protectionist actions around the world. These trends are affecting many global manufacturing and service sectors, and the footwear and apparel industries, as a whole, are not immune. Companies in our industry are facing trade protectionist challenges in many different regions, and in nearly all cases we are working together to address trade issues to reduce the impact to the industry, while observing applicable competition laws. Notwithstanding our efforts, such actions, if implemented, could result in increases in the cost of our products, which may in turn adversely affect our sales or profitability and the imported footwear and apparel industry as a whole. Accordingly, we are actively monitoring the developments described below.2.1 Vertical AnalysisWe choose one year to compare this two company and we can see the figures shown in the table, Nike more profitable than Puma in 2012. Nike’s cost of revenue is 56.60%, compare to Puma’s 51.70%. This means that for every $1 in net sales, Nike got almost $0.56 in 2012, and Puma got almost 0.51% in2012 is spent on cost of revenue. Nike’s percentage of net income to revenue is 10.5%. That means 10.5% of revenue results in profit for the company’s stockholders. On the other hand, Puma’s percentage of net income to revenue is 2.5%.Nike sells to thousands of retail accounts and operates 16 distribution centers outside of the United States. In many countries and regions, including Canada, Asia, Europe and some Latin American countries we have a futures ordering pro gram for retailers similar to the United States futures program, the common-size statement highlights Nike advantage over Puma.2.2 Trend AnalysisAssume Nike and Puma total revenues were 10,000,000 in 2009 and rose to 2,3331,000 in 2012, the base the is 2009,so that year’s percentage is set equal to 100 .We can see the figures shown in the table: Nike’s net sales has been continued increasing during these three years, especially year of 2012. Puma’s net sales also keep an increasing trend, but still cannot compete with Nike; Nike sells products to retail accounts, through Nike’s own direct to consumer operations, and through a mix of independent distributors, licensees and sales representatives around the world. Compare with Puma, the sales figures of Nike higher than Puma, this is weakness for puma, cannot fight with Nike to getleader industry during these three years. Puma is still a small player relative to Nike. But has crept up in recent years, and in 2011, has reached its highest Global 500 brand value, Puma has the ingredients and heritage to increase its brand value and rise up the table. Selecting the right rising athletic and sports stars, clearly differentiating themselves against Nike and Adidas, capitalizing on their sporting heritage and treading a delicate path between product innovations and continuing their success of producing more style driven, non-performance-related product lines will all play a part. We can see puma has been prepared to challenge the Nike from many ways; puma is strength of the competitor in the next few years, in response to threats, Nike also has a lot of way to meet threats and more details shown in another chapter.2.3 Ratio AnalysisWe have to say, Nike is a leader of the industry, the company compare with Puma and analysis some representative ratios to explain why Nike can be a leader in industry depend on the annual ratio result that calculated by us in sheet of excel. (All industry averages taken from “Thomson Reuters”),2.3.1 Profitable RatioNet profit margin: Measures the percentage of each sales dollar remaining after all costs and expenses, including interest, taxes, and preferred stock dividends, Nike‘s net profit margin have been deducted. Net profit margins vary widely across industries. Puma s’ net profit margin decreased from 2010 to 2012, the problem very s erious in 2012, Nike’s advantage over Puma during this three years.Gross profit margin: The higher the gross profit margin the better, and for the Nike has continued to decrease from 2010 to 2012. So the company got a little problem in the area of each sales dollar remaining after the firms has paid for its goods. The situation of Puma is quite good.Return on assets:Indicates how efficient management is at using its assets to generate earnings. The higher the number the better, because of the company can earn more money on less investment. For the Nike, the ratio of ROA has been increasing in the past three years, Puma has huge decreased from 2011 to 2012, the condition is not very stability, Nike in this area got a generate earnings more than his competitors.Return on equity:measure of a corporation's profitability that reveals how much profit a company generates with the money shareholders have invested. ROE is useful for comparing the profitability of a company to other firms in the same industry. Nike made a lot of profit to theirshareholder, because of the ratio of ROE keep rising during these three years (2010-2012); Puma has huge decreased from 2011 to 2012, the condition is not very stability, the Nike has a high profitability than Puma.Overview: A class of financial metrics that are used to assess a business's ability to ge nerate earnings as compared to its expenses and other relevant costs incurred during a specific period of time. For most of these ratios, having a higher value relative to a competitor's ratio or the same ratio from a previous period is indicative that the company is doing well.so the result shown that the Nike is doing well compare to Puma.2.3.2 Liquidity RatioQuick ratio: This is a more stringent measure of liquidity than the Current Ratio because it excludes inventory. This ratio is more relevant than the Current Ratio for some industries where inventories are not liquid. The quick ratio from 2010 to 2012 there is little reduce in Nike company , puma also,but Nike’s quick ratio is above the industry average of 1.86 (Routers) being above the industry indicates that we could sell our inventory than what other companies in the industry would have to sell to meet current obli gations. Puma’s quick ratio is lower than Nike and below the industry average of 1.86 (Routers).Cash ratio:The cash ratio is most commonly used as a measure of company liquidity. It can therefore determine if, and how quickly, the company can repay its short-term debt. Nike’s cash ratio has continued falling from year 2010 to 2012, we unexpected to see this downgrade, we would be willing to extend to the asking party. Even thought, the cash ratio of Nike is still higher than Puma.Overview: A class of financial metrics that is used to determine a company's ability to pay off its short-terms debts obligations. Generally, the higher the value of the ratio, the larger the margin of safety that the company possesses to cover short-term debts. A company's ability to turn short-term assets into cash to cover debts is of the utmost importance when creditors are seeking payment. Bankruptcy analysts and mortgage originators frequently use the liquidity ratios to determine whether a company will be able to continue as a going concern.2.3.3 Asset management ratioTotal asset turnover: The amount of sales generated for every dollar's worth of assets. Measures a firm's efficiency at using its assets in generate sales or revenue, the higher the number the better. The ratio of asset turnover keep stable in 2010 and 2011 is 1.37, but in the 2012 has a quite changes, raised up to 1.57 .It indicates pricing strategy: Nike with low profit margins tend to have high asset turnover, while those with high profit margins have low asset turnover. There is a little distance between Nike and Puma, but Puma’s amount of asset turnover still lower than Nike.Inventory turnover:Nike’s inventory turnover of 4.56 below the industry average of 5.91 (Router).Nike’s ratio of inventory turnover decreased from year 2010 to2012, so reducing inventory turnover levels were a key initiative for Nike in fiscal year. Due to our ability to quickly turnover inventory, Nike benefits from greater cash flows, reduced storage costs, and less spoilage. In addition, quick turnover reduces Nike’s inventory of out-of-style shoes and clothing. Company management stated, "We put a considerable amount of effort into improving product buying power patterns and as a result the composition and levels of inventory resulted in improved gross margins relative to a year ago." Inventory levels are being reduced due to increased sales in the company's own branch retail stores. Puma also stay a decreased trend, but the ratio of inventory turnover is lower than Nike, for Puma is not a bad condition.Receivable turnover: An accounting measure used to quantify a firm's effectiveness in extending credit as well as collecting debts. The receivables turnover ratio is an activity ratio, measuring how efficiently a firm uses its assets. A high ratio implies either that a company operates on a cash basis or that its extension of credit and collection of accounts receivable is efficient. A low ratio implies the company should re-assess its credit policies in order to ensure the timely collection of imparted credit that is not earning interest for the firm. Nike’s A/C ratio keeps increasing from year 2010 to 2012, Nike account receivable is efficient. By maintaining accounts receivable, Nike is indirectly extending interest-free loans to their clients. Nike’s condition is still better than Puma.Overview: Asset management ratios are the key to analyzing how effectively and efficiency business is managing its assets to produce sales. Asset management ratios are also called turnover ratios or efficiency ratios. If the company has too much invested in their company's assets, operating capital will be too high. If don't have enough invested in assets, the company will lose sales and that will hurt profitability, free cash flow, and stock price. So the result shown that the Nike can easy to efficiency and effectively to managing its asset to produce sales, Nike do a quite performanc e compares to Puma. Nike is doing well compare to Puma.2.3.4 Debt Utilization RatioTotal debt ratio: What is acceptable varies by industry. A high debt/equity ratio generally means that a company has been aggressive in financing its growth with debt. This can result in volatile earnings as a result of the additional interest expense. Nike’s total debt ratio is 0.06, which is below the industry average of 0.07. The debt ratio which is dealing from year 2010 to 2012, the figures are sho wn in the table, because of previous years the company has been aggressive in financing area with debt, create a stable basis, and during this three year the debt ratio reduces is normal. New products become more and more mature than before, the brand has been known in the world. But for Puma, they have to develop new product and put new technology into products to attract more customers, they are on the raising period, so the debt ratio a little higher than Nike.Long term debt ratio:Similar to total debt ratio but focused only on long-term debt. In these three years, the long term debt ratio of Nike in a downward trend and the reason similar to debt ratio, Puma also.Interest coverage: Also known as times interest earned used to determine how easily a company can pay interest on outstanding debt. The lower the ratio, the more the company is burdened by debt expense. Nike keep increasing during these three years ,floating is not big,It is good for Nike to pay short-termdebt,the company has ability to raise money. The debt condition of Puma is not very good, the burden become more and the company cannot easy to pay interest on outstanding debt.Overview: debt utilization ratio helps company measure ability to sell inventory, collec t receivable, and pay current liabilities. We can see the figures shown in previous tables, obviously Nike’s performance quite good, the higher ability to pay their debt, create a very good reputation. Puma need some times to develop themselves.2.3.5 InvestmentsEPS(*shown in annual income statement )EPS:Nike‘s EPS which is in maintaining growth, floating is not very big, represent the company got profit and this is good for the company's stock investors. Puma is doing well compare to Nike.P/E ratio :The price to earnings ratio (PE Ratio) is the measure of the share price relative to the annual net income earned by the firm per share. PE ratio shows current investor demand for a company share. The PE ratio has units of years, which can be interpreted as the number of years of earnings to pay back purchase price. Many factors led to the changes in the stock market, Nike’s P/E ratio has a float is normal, from year 2011 to 2012, the P/E ratio increased by two percent,A high PE ratio generally indicates increased demand because investors anticipate earnings growth in the future. Even though the P/E ratio of Puma is lower than Nike, but from 2010 to 2012, Puma keep an increase trend and performance not bad.Share price: closing prices provide a useful marker for investors to assess changes in stock prices over time, the closing price of one day can be compared to the previous closing price in order to measure market sentiment for a given security over a trading day. Stock market has four performances: the opening price, closing price, the highest and the lowest price, the closing price is most important because it is a basic data used to analysis of the stock market, only the closing price is the benchmark of profit or loss. Nike is a potential stock which is to attract people to buy. From year 2010 to 2012, Puma’s share price has been decreased but still more higher than Nike.Dividend coverage: Measure of the ability of an organization to pay dividends. A higher or lower dividend cover may be appropriate depending on the level of stability in earnings of the organizations. Nike’s dividend coverage ratio has been decreased from year 2010 to2012; the level of earning got a big floating in a company, the dividend cover ratio is not safety of the current dividend rate of a particular stock. The condition of Puma is quite good; keep an increase trend during this three years and higher dividend than Nike.Overview: investors purchase stock to earn a return on their investment, gain or losses from selling the stock at a price, dividend which is help analysis evaluation stock investment. Puma’s performance is quite good, and the investment condition of Puma become very attract investors, so Nike need to work on so continuing to increase EPS so that it is more competitive with other companies in its industry.At the end of May 31, 2012, it appears that Nike is in an optimal financial condition. Not only does it exceed the industry averages in liquidity, solvency, and profitability, but they also have well-structured plans to combat any threat that may arise. Ni ke’s current situation showcases their ability to survive in the long-run and grow. Nike’s cash management leaves no room for immediateliabilities to go unpaid, thus granting the company the ability to function fluidly. The bottom line is that Nike will continue to be a leader and one of the most preferred, iconic brands in its industry.Chapter 3: Financial Market and ImpactThe global economic recession resulted in a significant slow-down in international trade and a sharp rise in protectionist actions around the world. These trends are affecting many global manufacturing and service sectors, and the footwear and apparel industries, as a whole, are not immune.3.1 Global EconomyThe uncertain state of the global economy continues to impact businesses aro und the world. The current political and economic global environment has resulted in continued economic unpredictability, particularly in Europe where there are concerns regarding the increased debt levels of certain countries and their ability to meet future financial obligations, as well as the overall stability of the Euro currency (Nike Annual Report, 2012). Continuing volatility and disruption in the global capital and credit markets have led to a tightening of business credit and liquidity, a contraction of consumer credit, business failures, higher unemployment, and declines in consumer confidence and spending in many parts of the world. The economy depression direct impact on Athletic industry by influenced the purchasing power of customers that may lead Nike and Puma sales decreased, particularly to Puma which currency significant influenced by Europe economy.3.2Currency FluctuationsA majority of products of Nike and Puma are sold outside of the domestic market. As a result, companies conduct transactions in various currencies, which increase the exposure to fluctuations in foreign currency exchange rates relative to the domestic currency (Nike Annual Report, 2012). International revenues and expenses generally are derived from sales and operations in foreign currencies, and these revenues and expenses could be affected by currency fluctuations.3.3 Changes in TaxThe effective income tax rate in the future could be adversely affected by a number of factors, including: changes in the mix of earnings in countries with differing statutory tax rates, changes in the valuation of deferred tax assets and liabilities, changes in tax laws, the outcome of income tax audits in various jurisdictions around the world, and any repatriation of non-domestic earnings for which companies (Nike Annual Report, 2012). The trend of income tax is going up that arise the operational cost and decline the revenue of Nike and Puma.3.4 Rising Input CostThe increasing price of raw materials and labor costs could be a cause for concern to the company. The athletic industry uses raw materials including natural and synthetic rubber, nylon, leather, canvas, polyurethane films and plastic compounds. Raw material, especially rubber, is a key component in the production. The cost of rubber has been gradually increasing, owing to the increase in the oil prices. According to industry analysts, the average world natural rubber price was increased by more than two percentage points during 2009-2012 (Rubber Economist Report, 2013). With the political strife in Libya, the oil prices have soared across all markets. The entire industry faces challenges in maintaining pricing pressure on its products due to increase raw material cost. Nike and Puma heavily dependent on Asian sourcing markets, the increased raw material costs in Asian sourcing markets may impact the growth of the companies.3.5 Intense Competitive LandscapeThe profit and market share could be impacted by the growing competition in the marketplace. With rising competition, the industry has been realizing consolidation wherein the smaller entities are being acquired by or merged with major players. The influx of private labels in the industry is also on the rise. To survive and succeed in a stiff competitive environment, it becomes very important for companies to distinguish its product and service offerings through a clear and unique value proposition. The key players such as Nike Inc., Adidas Group, PUMA AG Rudolf Dassler Sport, Polo Ralph Lauren, Fila USA, Inc., Reebok International Ltd. and Callaway Golf Company. Some of these players enjoy a strong financialand marketing in the global market. Rising competition may also force Nike and Puma to reduce its prices, which could affect its profit margins adversely.3.6 Product Counterfeiting RiskAthletic business could be adversely affected due to the huge influx of counterfeit products across the global market. Such high penetration of counterfeit merchandise may lower the sales of Nike and Puma adversely affect its profit margins. Moreover, as the customers end up buying counterfeit products bearing the look-alike brand labels, the low quality of these counterfeits affects the perception of consumer and also tarnishes the brand image of the genuine company. Since 1982, the global trade in illegitimate goods has increased from $5.5 billion to about $600 billion annually (Congressional Record, 2005). These challenges and any under performance of the counterfeit products will have a major effect on revenues of Nike and Puma.Chapter 4: Challenges Faced and Solutions4.1 High InventoryThe inventory turnover of Nike declined that limited its profitability and increases its inventory cost. In the past three years, it reported decline in inventory turnover ratio. Nike reported an increase in its inventories for the fiscal year ended May 2012, which reflect it not able to turn its inventory into sales. The company’s inventories as a percentage of total assets increased to 21.6% in 2012 from 18% in 2011. Inventories were up 23.4% in 2012 versus that in the previous year. This may result in pushing up its inventory costs. Decline in inventory turnover reflects that the company would require 89.5 days to sell its inventory on hand in 2011, as compared to 87.2 and 73 days in 2010 (Nike Annual Report, 2012), respectively. The increase in days of inventory on hand indicates the company’s weak sales or negative purchasing. The rise in inventory could lead the company to reduce the product’s price via providing a discount. This shows the company is not effective to turn its inventory to sales. Failure to reduce its excess inventory will affect its operating margins and net profitability.。
管理经济学案例一-耐克、壳牌
管理经济学案例一-耐克、壳牌1. 耐克公司案例分析1.1 公司背景介绍耐克公司是全球领先的运动鞋、运动服装和运动设备制造商之一。
该公司成立于1964年,总部位于美国俄勒冈州,是全球最大的体育用品公司之一。
耐克公司以其创新的产品设计、强大的品牌影响力和全球营销策略而闻名。
1.2 管理经济学分析1.2.1 市场定位和竞争优势耐克公司在运动鞋和运动服装市场上具有强大的竞争优势。
他们通过不断创新和产品差异化来满足不同消费者的需求。
耐克公司广泛使用大量的研发资金,以推动技术创新,并提供先进的产品,从而在市场上取得竞争优势。
1.2.2 成本控制和供应链管理耐克公司通过有效的成本控制和高效的供应链管理来保持其竞争力。
他们与全球各地的供应商建立了长期合作关系,并通过流程改进和减少非价值增加环节来降低生产成本。
这使得耐克公司能够以合理的价格向消费者提供高品质的产品。
1.2.3 品牌建设和市场营销耐克公司注重品牌建设和市场营销。
他们通过在顶级体育比赛上的赞助和宣传活动来提升品牌知名度。
耐克公司还利用社交媒体和在线平台与消费者进行互动,以进一步推广其产品和品牌。
1.2.4 国际化战略和全球市场扩张耐克公司具有强大的国际化战略,已在全球多个国家和地区设立了办事处和分公司。
他们通过了解不同市场的文化差异和消费者需求,来调整产品和营销策略,从而在全球市场上实现持续增长。
1.3 案例总结耐克公司通过技术创新、成本控制、品牌建设和国际化战略等方面的管理经济学方法,成功地在全球市场上取得了竞争优势。
他们不断推动产品和营销创新,以满足不同消费者的需求,并通过有效的成本控制来提供具有竞争力的产品。
耐克公司的成功案例为其他公司提供了有益的经验和启示。
2. 壳牌公司案例分析2.1 公司背景介绍壳牌公司是一家全球综合性石油和石化公司,总部位于荷兰和英国。
壳牌公司成立于1907年,是全球最大的石油公司之一。
他们涉及各个领域,包括勘探、生产、炼油、销售和分销。
耐克公司:资本成本

耐克公司:资本成本耐克公司:资本成本2001年7月5日,KIMI FORD,NORTHPOINT 集团(实际是一家基金管理公司)的portforlio经理,仔细思考着分析人员关于耐克公司的积极评论。
耐克的股票价格从年初开始显著下跌。
FORD正在考虑为她管理的NORTHPOINT 大资本基金公司购买一些股份,这家基金公司主要投资财富杂志世界500强企业,其重点是价值投资。
它持有最多的股份包括埃克森公司、通用公司、麦当劳、3M及其它大企业,通常是经济历史悠久的股票。
虽然股票市场在过去18个月下跌,NORTHPOINT大资本基金公司却表现极好。
2000年,这家基金回报率20.7%,而S&P500甚至下跌了10.1%。
到2001年6月底,这家基金的YEAR-TO-DATE回报率为6.4%,而S&P500为7.3%。
一个星期前的2001年6月28日,耐克公司组织了分析人员会议,发布2001财政年度业绩(耐克的财务年度结束于每年5月份)。
不过,这次会议还有另外一个目的:耐克公司管理层希望沟通重振公司的战略。
1997年以来,耐克公司的总收入上升并稳定于90亿美元左右,而净收入从8亿美元左右下跌到5.8亿美元左右(见表一)。
耐克在美国运动鞋市场的市场份额从1997年的48%下降到2000年的42%。
此外,最近的供应链问题及美元升值的负面影响对收产生的负面影响。
会上,管理层公布了致力于既首先要关注增长,同时也注重经营成效的计划。
为了提高收入,公司将在中等价位产品类别内(这一类别的运动鞋每双售价为70-90美元)开发更多的运动鞋产品,而耐克公司近年来忽视了这一类别。
耐克公司也计划推动它的服装产品部门,这一部门在服装行业老将MINDY CROSSMAN(MINDY CROSSMAN在2000年9月加入耐克公司,她是JONES 服装集团的POLO牛崽裤部门的前任董事长及首席执行官)的领导下表现极佳。
在成本方面,耐克公司将在费用控制上作出更大努力。
NIKE 主要资产项目分析

ห้องสมุดไป่ตู้
(四)固定资产
根据该公司资产负债表和财务报表附注的相关资 料,对耐克公司固定资产净值变动情况分析如下: 该公司本年固定资产为2279百万美元,上一年为 2115百万美元,增长了164百万美元,增长率为 7.75%,而本年的累计折旧为-2965百万美元,比 上一年减少了174百万美元,固定资产的增长有 可能是累计折旧减少而导致的。
(二)应收款项
1.应收账款 根据耐克公司提供的会计报表及会计报表附注可知,该公 司本年应收账款余额为3280百万美元,上年应收账款余额 3138百万美元,本年应收账款增加了142百万美元,增长率 为4.53% 。这说明公司的信用政策和收账政策比较稳定, 应收账款的变化幅度比较小。从本年营业收入增长4.89%来 看,应收账款的增长要略略低于营业收入的增长。 2.其他应收款 根据耐克公司提供的会计报表及附注可知,该公司本年其 他应收款余额为0。
(三)存货
该公司本年存货为3350百万美元,上一年为2715 百万美元,本年增长了635百万美元,增长的比 率为23.39%,增长比率还是较大的,原因有可能 一企业规模扩大,导致对存货的需求量增加;二 企业销量不好,存货积压。从财产/工厂/设备总资 产可以看出,本年增长了448百万美元,所以有 可能是工厂规模的增大所导致的。这表明存货资 产实物量的绝对增加。
NIKE 主要资产项目分析
(一)货币资金
根据耐克公司的资产负债表的水平分析和垂直分析,可以对耐克公 司的货币资金存量规模,比重及变动情况作如下分析评价: (1)从存量规模及变动情况看,本年该公司货币资金比上年增加了 362百万美元,增长了18.52%,其原因之一是营业收入增长 4.89%,是货币资金相应增加;二是应付票据和应付账款增长了 119百万美元,是现金支付减少;三是经营活动现金流的改善,本 年经营活动现金流量净额比上年增长87百万美元。 (2)从比重及变动情况看,该公司期末货币资金比重为20.09%,期 初比重为17.31%,货币资金比重上升了2.78%(可以说,货币资 金的比重还是较高的),而且有增长的趋势,公司应注意控制其 存量规模及比重。
资本成本的分析及应用案例
资本成本的分析及应用案例摘要:资本成本实际上是一种预测成本。
在市场经济环境中,诸多因素的综合作用决定企业资本成本的高低,并且与资本的时间价值有关,有特定的计算对象和计算方法。
资本成本是企业进行筹资决策的基本依据,同时也是企业进行投资决策的基本依据,在实践中有广泛的应用基础。
关键词:资本成本;预测成本;时间价值;分类;应用企业资本成本是企业进行筹资决策,投资决策的基本依据。
分析资本成本对加强企业管理,提高企业盈利能力有深远的意义。
一、资本成本的定义资本成本是指企业为筹集和使用资本而付出的代价。
资本成本包括资本筹集费用和资本占用费用两部分。
资本筹集费用指资本筹集过程中支付的各种费用,如为股票、债券发行支付的印刷费、律师费、公证费、担保费、广告宣传费等。
需要注意的是,企业发行股票和债券时,支付给发行公司的手续费不作为企业筹集费用。
资本占用费是指占用他人资本应支付的费用,或者说是资本所有者凭借其对资本所有权向资本所有者取得的报酬。
如股息、红利、债券及银行借款支持的利息。
二、资本成本实际上是一种预测成本设计方案在前,实施方案在后。
通过资本成本大小的比较来设计筹资方案,从而为将要实施的投资方案提供依据。
作为设计筹资方案的一种有效手段,计算不同筹资方式下的成本,有利于降低其投资成本,提高投资效益。
因此,资本成本计算是设计筹资方案的一项基础性工作,其计算结果即为预测数。
如股票筹资成本,它着眼于投资者希望付出多大的成本(股票发行价)以及对于股票未来收益的期望值是否得到满足等因素而定。
三、决定资本成本高低的因素在市场经济环境中,多方面因素的综合作用决定着企业资本成本的高低,其中主要有:经济环境、证券市场条件、内部的经营和融资状况、融资规模。
①经济环境。
经济环境决定了整个经济中资本的供给和需求,以及预期通货膨胀的水平。
经济环境变化的影响,反映在无风险报酬率上。
如果整个社会经济中的资金需求和供给发生变动,或者通货膨胀水平发生变动,投资者应改变其所需求的收益率。
耐克公司资本成本估算
投资组合案例1耐克公司资本成本估算陈润城(韦昭亦陈明)2014-10-28目录一、前言 (1)二、资本成本的计算 (2)2.1计算权益资本成本 (2)2.2计算债务资本成本 (2)三:资本结构中负债和权益占的比重计算 (3)3.1债务占的资本资产的比重 (3)3.2.权益占资本资产的比重 (3)四:计算加权平均资本成本 (3)五:结论 (4)附录 (5)案例目标我们小组在本投资组合案例中先运用CAPM模型计算出权益资本成本,再加上计算得来的债务资本成本,从而估算出2001年耐克公司的资本成本WACC。
一、前言NIKE是全球著名的体育运动品牌,英文原意指希腊胜利女神,中文译为耐克。
公司总部位于美国俄勒冈州。
公司生产的体育用品包罗万象,例如服装,鞋类,运动器材等。
耐克商标图案是个小钩子。
耐克一直将激励全世界的每一位运动员并为其献上最好的产品视为光荣的任务。
耐克首创的气垫技术给体育界带来了一场革命。
运用这项技术制造出的运动鞋可以很好地保护运动员的膝盖,在其在作剧烈运动落地时减小对膝盖的影响。
耐克公司的销售收入从1997年开始一直在90亿美元左右徘徊,而净利润已经从8亿美元下降到5.8亿美元左右(见表1-3)。
耐克在美国运动鞋市场的份额由1997年的48%下降到2000年的42%。
耐克公司于2001年6月28日召开了分析员会议,发布其2001年会计年度业绩(耐克公司的会计年度截止于每年5月份)。
耐克公司在这次会议的另外一个目的:耐克公司管理层希望在会上介绍公司重振雄风的战略。
在会议上,管理层披露了公司的最高产量增长计划和经营业绩预测。
为了增加销售收入,公司将在中档价位板块开发更多的运动鞋产品,还计划进一步开拓服装业务。
在成本方面,耐克公司将加强成本控制。
最后,公司高管重申了他们的长期销售收入增长目标是8%至10%,利润增长目标在15%以上。
当时,一份雷曼兄弟公司的报告建议福特“强力买入”,而瑞银华宝及瑞士信贷第一波士顿的分析员则表达了对公司的担忧,并建议她“按兵不动”,于是福特就决定自己进行计算预测来得出更加清晰的结论。
第11章 耐克公司综合案例分析

★ 运营资本出现显著性增长,表明公司的资产流动性趋好;
★ 流动比率也有显著提升,也是公司资产流动性趋好的信号; ★ 速动比率明显增大,从流动性角度看,这也是一个很好的 趋势; ★ 现金比率明显增长也是流动性趋好的积极表现; ★ 运营资本周转率明显下降,表明销售的增长速度慢于运营 资本的增长速度。这是一个负面的信号; ★ 经营现金流量/到期长期负债和应付票据之和这个指标显著
★ 耐克公司存货的流动性明显比业内平均水平低。其财政年
度截止日期5月31日是一个原因,另一个可能的原因是其他公司采
用不同的存货成本计算方法; ★ 耐克公司的经营周期明显比同业公司长。主要是因为其应
收账款和存货流动性较差;
★ 耐克公司的现金比率远高于行业平均水平; ★ 耐克公司的销售与运营资本比率明显低于行业平均水平。
第11章 耐克公司综合案例分析
11.1 11.2
耐克公司背景 其 他
11.3
11.4
总 结
耐克公司2002年度财务报表
11.1
耐克公司背景
1964年,俄勒冈大学田径教练比尔· 鲍尔曼和他以前的学生费 利浦· 奈特一起创立了蓝色彩虹运动公司。1972年蓝色彩虹运动公 司更名为耐克公司,一个象征速度的希腊女神的名字。
114114耐克公司耐克公司20022002年度财务报表年度财务报表第三项法律诉讼10第四项股东投票表决事项11第五项注册人普通股权益市场和相关股东事项11第六项经选择的财务数据12第七项管理层对财务状况和经营结果的评论与分析13第七项a市场风险的定性与定量披露25第八项财务报告及补充数据29第九项在会计和财务披露方面与会计师的分歧及相关变更54第十项公司董事和执行官54第十一项高级人员薪酬54第十二项特定利益所有人和管理层持股情况54第十三项关联关系及关联交易54第十四项主表财务报表附表及8k格式报告55签名s1我们耐克公司均指耐克公司和它的前身子公司及分支机构
- 1、下载文档前请自行甄别文档内容的完整性,平台不提供额外的编辑、内容补充、找答案等附加服务。
- 2、"仅部分预览"的文档,不可在线预览部分如存在完整性等问题,可反馈申请退款(可完整预览的文档不适用该条件!)。
- 3、如文档侵犯您的权益,请联系客服反馈,我们会尽快为您处理(人工客服工作时间:9:00-18:30)。
1. What is the WACC and why is it important to estimate a firm’s cost of capital Do you agree with Joanna Cohen’s WACC calculation Why or why notThe definition of WACCWeighted average cost of capital(WACC), is a weighted-computational method of analyzing the cost of capital based on the whole capital structure of a firm. The result of WACC is the rate a firm use to monitor the application of the current assets because it represents the return the firm MUST get. For example this rate could be used as the discount rate of evaluating an investment, and maintaining the price of firm’s stock.Analysis of Johanna Cohen’s calculationWe analyzed the process of Johanna Cohen’s calculation, and found some flaws we believe caused computational mistakes.i. When using the WACC method, the book value of bond is availableas the market value since bonds are not quite active in the market, but the book value of equity isn’t. Instead of Johanna’s using equity’s book value, we should mult iply th e current price of Nike’s stock price by the numbers of shares outstanding.ii. When calculating the YTM of the firm’s bond, Johanna only used the interest expense of the year divided by the average debt balance, which fully ignored the discounted cash flow of the cost of debt.2. If you do not agree with Cohen’s analysis, calculate your own WACC for Nike and be prepared to justify your assumptions.Combining the analysis above, we now give our own WACC calculation as following:The value of debt(based on EXIHIBIT 3).Since the book value of debt may represent the market value, we merely need to sum up the values of Long-term debt, Notes payable, and the Current portion of long-term debt:++=$1, mThe cost of debt (based on EXIHIBIT 4):PV:FV: 100n: 40Pmt: 2= (as it pays semiannually)So, we get the YTM is i*2=*2=%The value of equity (based on EXIHIBIT 1&4):Price of stock * numbers of shares outstanding= *=$11, The cost of equity (based on EXIHIBIT 4):E(Ri ) = Rf+【E(Rm) - Rf】* βiBecause the government bond yield is %, Geometrical historical risk premium is %, and the average historical βof Nike is , then we get:E(Ri)= %+%* =%Weights of each security (based on &Weight of debt=1,(1,+11,=%Weight of equity=(1,+11,=%Cost of capital by WACC method (based above):Cost of capital = Weight of debt * Cost of debt * (1 –Tax rate) + Weight of equity * Cost of equity = % * %* + % * % = %3. Calculate the costs of equity using CAPM, the dividend discount model, and the earnings capitalization ratio. What are the advantages and disadvantages of each method Calculating the costs of equity by CAPM, and its advantages & disadvantagesi. Calculation:According to , we have already got the result of CAPM, which is %.ii. AdvantagesFirst, because CAPM is a theory based on the whole market, it obviously includes the effects between the market as the integrity and each individual stock. Second, with the counterbalance among each stock in the entire market, CAPM only needs the consideration of systematic risk, which much simplifies the calculation. Third, CAPM also bypasses the specific values of future cash flow because the equation is actually the relation between systematic risk and return rate, which is also another simplification of calculating.Fourth, merely depending on the systematic risk, CAPM could offer the investors a reliable discounting rate to assess the value of a certain investment.iii. Disadvantages:First, involving the counterbalance among the entire market, CAPM acquiesces an effective, active and healthy market environment. Second, comparing the consideration of market risk, CAPM may omit the subtle risk differences among each single firm.Third, the crucial systematic risk, the beta coefficient, is obviously hard to calculate.Calculating the costs of equity by DDM, and its advantages & disadvantagesi. Calculation (based on EXIHIBIT 4)::Based on the dividend discount model, P0 = D* (1+g) /(k – g), then we get the return rate (the cost of equity) k = D0 * (1+g) / P+ g = * (1 + / + = %ii. AdvantagesFirst, DDM fully considers the time value of consistent cash flow of an investment. Second, it is pretty easy to get the necessary historical data. Third DDM is flexible enough for the adjustment of any future situation. Fourth, once the growth pattern is confirmed, it is very straightforward to get the discount rate of assessing an investment.iii. DisadvantagesFirst, without enough consideration of risk cost, DDM may underestimate the equity cost. Second, all of the data is based on historical record, so the result is not reliable considering of the future situations. Third, with the predetermined growth rate, it is obviously practical for the stock investors to estimate the possible profit, but may mislead the stock issuing firm froma better budgeting decision to a comparatively unsubstantialinvestment.Calculating the costs of equity by the earnings capitalization ratio, and its advantages & disadvantagesi. Calculation (based on EXIHIBIT 1&4)According to the earnings capitalization model, we have costof equity = E1 / P= / = %ii. AdvantagesFirst, it’s very e asy to calculate and understand. Second, it’s easy to get the necessary accounting dataiii. DisadvantagesWithout any consideration of the risk and the growth of the firm, it doesn’t reflect the true value of an investment or the cost of the budgeting at all.4. What should Kimi Ford recommend regarding an investment in NikeAccording to EXIHIBIT 2, the market’s forecasting sensitivity of equity value of Nike is %. But based on our own analysis by WACC, we believe the discount rate of Nike is around %. That means the market underestimated the value of Nike. So we recommend the Northpoint to purchase the stock of Nike.。