毕业设计中关于温度检测的外文及翻译
单片机温度控制系统毕业论文中英文资料外文翻译文献

单片机温度控制系统中英文资料外文翻译文献英文原文DescriptionThe at89s52 is a low-power, high-performance CMOS 8-bit microcomputer with 4K bytes of Flash Programmable and Erasable Read Only Memory (PEROM) and 128 bytes RAM. The device is manufactured using Atmel’s h igh density nonvolatile memory technology and is compatible with the industry standard MCS-51™ instruction set and pinout. The chip combines a versatile 8-bit CPU with Flash on a monolithic chip, the Atmelat89s52 is a powerful microcomputer which provides a highly flexible and cost effective solution to many embedded control applications.Features:• Compatible with MCS-51™ Products• 4K Bytes of In-System Reprogrammable Flash Memory• Endurance: 1,000 Write/Erase Cycles• Fully Static Operation: 0 Hz to 24 MHz• Three-Level Program Memory Lock• 128 x 8-Bit Internal RAM• 32 Programmable I/O Lines• Two 16-Bit Timer/Counters• Six Interrupt Sources• Programmable Serial Channel• Low Power Idle and Power Down ModesThe at89s52 provides the following standard features: 4K bytes of Flash, 128 bytes of RAM, 32 I/O lines, two 16-bit timer/counters, a five vectortwo-level interrupt architecture, a full duplex serial port, on-chip oscillator and clock circuitry. In addition, the at89s52 is designed with static logic for operation down to zero frequency and supports two software selectable power saving modes. The Idle Mode stops the CPU while allowing the RAM, timer/counters, serial port and interrupt system to continue functioning. The Power Down Mode saves the RAM contents but freezes the oscillator disabling all other chip functions until the next hardware reset.Pin Description:VCC Supply voltage.GND Ground.Port 0Port 0 is an 8-bit open drain bidirectional I/O port. As an output port each pin can sink eight TTL inputs. When is are written to port 0 pins, the pins can be used as high impedance inputs.Port 0 may also be configured to be the multiplexed loworderaddress/data bus during accesses to external program and data memory. In this mode P0 has internal pullups.Port 0 also receives the code bytes during Flash programming, and outputs the code bytes during program verification. External pullups are required during program verification.Port 1Port 1 is an 8-bit bidirectional I/O port with internal pullups. The Port 1 output buffers can sink/source four TTL inputs. When 1s are written to Port 1 pins they are pulled high by the internal pullups and can be used as inputs. As inputs, Port 1 pins that are externally being pulled low will source current (IIL) because of the internal pullups.Port 1 also receives the low-order address bytes during Flash programming and verification.Port 2Port 2 is an 8-bit bidirectional I/O port with internal pullups. The Port 2 output buffers can sink/source four TTL inputs. When 1s are written to Port 2 pins they are pulled high by the internal pullups and can be used as inputs. As inputs, Port 2 pins that are externally being pulled low will source current (IIL) because of the internal pullups.Port 2 emits the high-order address byte during fetches from external program memory and during accesses to external data memory that use 16-bit addresses (MOVX @ DPTR). In this application it uses strong internalpull-ups when emitting 1s. During accesses to external data memory that use 8-bit addresses (MOVX @ RI), Port 2 emits the contents of the P2 Special Function Register.Port 2 also receives the high-order address bits and some control signals during Flash programming and verification.Port 3Port 3 is an 8-bit bidirectional I/O port with internal pullups. The Port 3 output buffers can sink/source four TTL inputs. When 1s are written to Port 3 pins they are pulled high by the internal pullups and can be used as inputs. As inputs, Port 3 pins that are externally being pulled low will source current (IIL) because of the pullups.Port 3 also serves the functions of various special features of theat89s52 as listed below:Port 3 also receives some control signals for Flash programming andverification.RSTReset input. A high on this pin for two machine cycles while theoscillator is running resets the device.ALE/PROGAddress Latch Enable output pulse for latching the low byte of theaddress during accesses to external memory. This pin is also the program pulse input (PROG) during Flash programming.In normal operation ALE is emitted at a constant rate of 1/6 theoscillator frequency, and may be used for external timing or clockingpurposes. Note, however, that one ALE pulse is skipped during each access to external Data Memory.If desired, ALE operation can be disabled by setting bit 0 of SFRlocation 8EH. With the bit set, ALE is active only during a MOVX or MOVC instruction. Otherwise, the pin is weakly pulled high. Setting the ALE-disable bit has no effect if the microcontroller is in external execution mode.PSENProgram Store Enable is the read strobe to external program memory. When the at89s52 is executing code from external program memory, PSEN is activated twice each machine cycle, except that two PSENactivations are skipped during each access to external data memory.EA/VPPExternal Access Enable. EA must be strapped to GND in order to enable the device to fetch code from external program memory locations starting at 0000H up to FFFFH. Note, however, that if lock bit 1 is programmed, EA will be internally latched on reset. Port pinalternate functions P3.0rxd (serial input port) P3.1txd (serial output port) P3.2^int0 (external interrupt0) P3.3^int1 (external interrupt1) P3.4t0 (timer0 external input) P3.5t1 (timer1 external input) P3.6^WR (external data memory write strobe) P3.7 ^rd (external data memory read strobe)EA should be strapped to VCC for internal program executions.This pin also receives the 12-volt programming enable voltage(VPP) during Flash programming, for parts that require 12-volt VPP.XTAL1Input to the inverting oscillator amplifier and input to the internal clock operating circuit.XTAL2Output from the inverting oscillator amplifier.Oscillator CharacteristicsXTAL1 and XTAL2 are the input and output, respectively, of an inverting amplifier which can be configured for use as an on-chip oscillator, as shown in Figure 1. Either a quartz crystal or ceramic resonator may be used. To drive the device from an external clock source, XTAL2 should be left unconnected while XTAL1 is driven as shown in Figure 2. There are no requirements on the duty cycle of the external clock signal, since the input to the internal clocking circuitry is through a divide-by-two flip-flop, but minimum and maximum voltage high and low time specifications must be observed.Idle ModeIn idle mode, the CPU puts itself to sleep while all the onchip peripherals remain active. The mode is invoked by software. The content of the on-chip RAM and all the special functions registers remain unchanged during this mode. The idle mode can be terminated by any enabled interrupt or by a hardware reset.It should be noted that when idle is terminated by a hard ware reset, the device normally resumes program execution, from where it left off, up to two machine cycles before the internal reset algorithm takes control. On-chip hardware inhibits access to internal RAM in this event, but access to the port pins is not inhibited. To eliminate the possibility of an unexpected write to a port pin when Idle is terminated by reset, the instruction following the one that invokes Idle should not be one that writes to a port pin or to external memory.Status of External Pins During Idle and Power Down Modesmode Program memory ALE ^psen Port0 Port1Port2Port3idle internal 1 1 data data data Data Idle External 1 1 float Data data Data Power down Internal 0 0 Data Data Data Data Power down External 0 0 float data Data data Power Down ModeIn the power down mode the oscillator is stopped, and the instructionthat invokes power down is the last instruction executed. The on-chip RAMand Special Function Registers retain their values until the power down modeis terminated. The only exit from power down is a hardware reset. Resetredefines the SFRs but does not change the on-chip RAM. The reset shouldnot be activated before VCC is restored to its normal operating level andmust be held active long enough to allow the oscillator to restart andstabilize.Program Memory Lock BitsOn the chip are three lock bits which can be left unprogrammed (U) orcan be programmed (P) to obtain the additional features listed in the tablebelow:Lock Bit Protection ModesWhen lock bit 1 is programmed, the logic level at the EA pin issampled and latched during reset. If the device is powered up without a reset,the latch initializes to a random value, and holds that value until reset isactivated. It is necessary that the latched value of EA be in agreement with the current logic level at that pin in order for the device to function properly. Programming the Flash:The at89s52 is normally shipped with the on-chip Flash memory array in the erased state (that is, contents = FFH) and ready to be programmed.The programming interface accepts either a high-voltage (12-volt) or alow-voltage (VCC) program enable signal.The low voltage programming mode provides a convenient way to program the at89s52 inside the user’s system, while the high-voltage programming mode is compatible with conventional third party Flash or EPROM programmers.The at89s52 is shipped with either the high-voltage or low-voltage programming mode enabled. The respective top-side marking and device signature codes are listed in the following table.Vpp=12v Vpp=5vTop-side mark at89s52xxxxyywwat89s52xxxx-5yywwsignature (030H)=1EH(031H)=51H(032H)=FFH (030H)=1EH (031H)=51H (032H)=05HThe at89s52 code memory array is programmed byte-bybyte in either programming mode. To program any nonblank byte in the on-chip Flash Programmable and Erasable Read Only Memory, the entire memory must be erased using the Chip Erase Mode.Programming Algorithm:Before programming the at89s52, the address, data and control signals should be set up according to the Flash programming mode table and Figures 3 and 4. To program the at89s52, take the following steps.1. Input the desired memory location on the address lines.2. Input the appropriate data byte on the data lines.3. Activate the correct combination of control signals.4. Raise EA/VPP to 12V for the high-voltage programming mode.5. Pulse ALE/PROG once to program a byte in the Flash array or the lock bits. The byte-write cycle is self-timed and typically takes no more than 1.5 ms. Repeat steps 1 through 5, changing the address and data for the entire array or until the end of the object file is reached.Data Polling: The at89s52 features Data Polling to indicate the end of a write cycle. During a write cycle, an attempted read of the last byte written will result in the complement of the written datum on PO.7. Once the write cycle has been completed, true data are valid on all outputs, and the next cycle may begin. Data Polling may begin any time after a write cycle has been initiated.Ready/Busy: The progress of byte programming can also be monitored by the RDY/BSY output signal. P3.4 is pulled low after ALE goes high during programming to indicate BUSY. P3.4 is pulled high again when programming is done to indicate READY.Program Verify: If lock bits LB1 and LB2 have not been programmed, the programmed code data can be read back via the address and data lines for verification. The lock bits cannot be verified directly. Verification of the lock bits is achieved by observing that their features are enabled.Chip Erase: T he entire Flash Programmable and Erasable Read Only Memory array is erased electrically by using the proper combination of control signals and by holding ALE/PROG low for 10 ms. The code array is written with all “1”s. The chip erase operation must be executed before the code memory can be re-programmed.Reading the Signature Bytes: The signature bytes are read by the same procedure as a normal verification of locations 030H, 031H, and 032H, except that P3.6 and P3.7 must be pulled to a logic low. The values returned are as follows.(030H) = 1EH indicates manufactured by Atmel(031H) = 51H indicates 89C51(032H) = FFH indicates 12V programming(032H) = 05H indicates 5V programmingProgramming InterfaceEvery code byte in the Flash array can be written and the entire array can be erased by using the appropriate combination of control signals. The write operation cycle is selftimed and once initiated, will automatically time itself to completion.中文翻译描述at89s52是美国ATMEL公司生产的低电压,高性能CMOS8位单片机,片内含4Kbytes的快速可擦写的只读程序存储器(PEROM)和128 bytes 的随机存取数据存储器(RAM),器件采用ATMEL公司的高密度、非易失性存储技术生产,兼容标准MCS-51产品指令系统,片内置通用8位中央处理器(CPU)和flish存储单元,功能强大at89s52单片机可为您提供许多高性价比的应用场合,可灵活应用于各种控制领域。
温度控制系统论文中英文资料对照外文翻译

温度控制系统论文中英文资料对照外文翻
译
本文将介绍温度控制系统的关键技术,涉及环境温度探测、数
据处理、控制策略等内容。
以下是部分资料的中英文对照外文翻译。
环境温度探测
中文资料
传感器是环境温度控制系统的关键组件之一。
目前市场上主流
的温度传感器有热敏电阻、热电偶、红外线传感器等。
温度控制系
统还需要考虑传感器的输出精度和响应速度等因素。
英文资料
数据处理
中文资料
数据处理是温度控制系统的核心部分。
常用的数据处理方法有滤波、线性化处理、校准等。
数据处理的目的是提高控制精度和稳定性。
英文资料
控制策略
中文资料
控制策略主要包括开环控制和闭环控制。
其中,闭环控制具有更高的控制精度和稳定性,但需要采集反馈信号、进行数据处理等多个步骤。
英文资料
Control strategies mainly include open-loop control and closed-loop control. Among them, closed-loop control has higher control accuracy and stability, but requires multiple steps such as collecting feedback signals and data processing.。
温湿度测量仪外文文献翻译、中英文翻译

外文翻译英文原文:Temperature and humidity measuring instrumentIntroductionTemperature and humidity measurement is a modern newly developed measurement field, especially the humidity measurement is to continue moving forward. Experienced a length method, dry and wet until today the course of the measurement, humidity measurement technology is maturing. Today, we are no longer satisfied with the measurement of the temperature and humidity, especially in some places to monitor directly the requirements of real-time measure and record the temperature and humidity changes in the whole process, and based on these changes identified during storage and transportation security, led to a new temperature and humidity measuring instrument was born. Temperature and humidity measuring instrument is the temperature and humidity parameters were measured according to a predetermined time interval stored in the internal memory, in the completion of the recording function will be coupled to a PC, use the adapter software data stored in accordance with values time analysis instrument. The instrument can determine the storage and transportation process, experiment process without any compromise product safety incident.MSP430F437 IntroducedThe MSP430 MCU main features are as follows:1)Ultra-low power consumption. MSP430 MCU supply voltage 1.8 to 3.6V low voltage RAM data retention mode power consumption of only 0.1uA active mode power 250uA/MIPS, IO input port leakage current of only 50nA.2)Powerful processing capability. The MSP430 MCU 16-bit microcontroller, reduced instruction set architecture with the most popular one clock cycle to execute an instruction, the MSP430 instruction speeds of up to 8MHz oscillator is 8MIPS.3)High-performance analog technology and a wealth of on-chip peripheral modules. The MSP430 monolithic organic combination of TI's high-performance analog technology, each member of the rich on-chip peripherals are integrated. Depending on the model of the different possible combinations of the following modules: watchdog,analog comparator A timer A, timer B, serial 0,1, hardware multiplier, LCD driver, 10/12/14-bit ADC, 12 DAC IIC bus, direct data access, port 1 to 6, the basic timer. 4)The system is stable. Power-on reset, first initiated by the DC0 CPU, to ensure that the program starts executing from the correct position to ensure crystal oscillator start-up and stabilization time. The software can then set the appropriate control bits of the register to determine the final system clock frequency. If the crystal oscillator is used as the CPU clock MCLK failure, the DCO will start automatically, in order to ensure the normal operation of the system. This structure and operational mechanism in the current series microcontroller is unique.5)Convenient and efficient development environment. MSP430 series OTP type, three types of FLASH-ROM, the domestic large-scale use FLASH. The development of these devices means, after the successful development of the OTP and ROM-type device using a dedicated emulator programmer or chip cover touch. FLASH type is very convenient development and debugging environment, because the device on-chip JTAG debug interface, as well as the electric flash FLASH memory using the first through the JTAG interface to download the program to the FLASH, run by the JTAG interface control program read the on-chip CPU status, and memory contents and other information for designers debug the entire development can be carried out in the same software integrated environment. Which only requires a PC and a JTAG debugger, without the need for a dedicated emulator and programmer. Temperature And Humidity SensorThe SHT7x temperature and humidity sensor characteristics are as follows:1)The temperature and humidity sensor signal is amplified conditioning, A / D converter, all integrated on one IIC bus interface;2)Given calibration relative humidity and temperature output;3)IIC bus with industry-standard digital output interface;4)With dewpoint calculation output function;5)With excellent long-term stability;6)Humidity value output resolution of 14 The temperature output resolution of 12 bits, and programmable;7)Small size (7.65 x 5.08 x 23.5mm) Surface Mount;8)Having reliable the CRC data transmission checking function;9)The chip load calibration coefficients can guarantee 100% interchangeability;AT25256 IntroductionTemperature and humidity data storage chip SPI interface uses ATMEL Corporation's low-voltage serial EEPROM AT25256. AT25256 is mainly applied to low-power occasion the internal accordance with 32K x 8-bit organization, can work at 3.3V, the maximum serial clock frequency as to 2.1MHz. Support for 64-byte page write mode and byte write mode. AT25256 by setting the write-protect pin / WP level to set the chip read-only or writable state. Serial Peripheral Interface (SPI) bus technology is a synchronous serial interface, the hardware features a strong, SPI software is quite simple, so that the CPU has more time to deal with other matters. SPI bus can be connected to multiple host MCU, equipped with SPI interface output devices, output devices, such as LCD drivers, A / D conversion and other peripherals can also be a simple connection to a single TTL shift register chip. The bus allows you to connect multiple devices, but only one device at any moment as the host.SPI bus clock line is controlled by the host, in addition to data lines: host input / output line from the machine and the host output / slave input line. Host and which slave communication through the slave strobe line selection.Application SPI system can be simple, complex and can take many forms: (1) a host MCU and the slave MCU; (2) multiple MCU are connected to each other into a multi-host system; (3) a host MCU and slave peripherals.Segment LCD Display PrincipleLCD display principle is to use the physical characteristics of the liquid crystal born, when power is turned on, arranged order so light by; arranged confusion is not energized, to prevent the light to pass through. Light to pass through and not through a combination of an image is displayed on the screen. In layman's terms, the liquid crystal display is the middle of the two glass clip a layer of liquid crystal material, the liquid crystal material to change their light transmission in the signal under the control of the state, so you can see the image in front of the glass panel. LCD ambient light to display information, the LCD itself is not self-luminous, LCD power consumption is very low, more suitable for single-chip low-power applications. In addition, the LCD can only use low-frequency AC voltage drive, the DC voltage will damage the LCD. There are many types of LCD segment liquid crystal character LCD, graphical LCD. Segment LCD inexpensive, simple to use, is widely used in a variety of microcomputer application system.MSP430 LCD driver module has four driving method, respectively, for static drive, 2MUX drive, 3MUX, Drivers, 4MUX drive. Static driving method, in additionto the public badly in need of a pin, each section of the drive each one pin. If the design involves a lot of number of segments, you need to take up the many pin. In order to reduce the pin number, you can select multiple drive needed: 2MUX drive, drive, 3MUX 4MUX driving method. Increase the number of public-pole, can greatly reduce the number of pins. Need to drive more segments, the more obvious effects. ConclusionThe design requirements to simultaneously detect the temperature and humidity. From the temperature and humidity sensor signal IIC bus to enter MSP430F437 MSP430F437, temperature and humidity data on the one hand to send the LCD display; the other hand, the temperature and humidity data is stored in AT25256 stored temperature and humidity data can be transmitted via RS232 bus to the PC, In the PC application, you can curve shows the temperature and humidity data, and can print the report.This design uses the MSP430 MCU measurement of temperature and humidity, display, storage, transmission, printing and other functions. But also through the button on the temperature and humidity measurement time interval, whether storage, starting time and other parameters set. In addition, the entire system can be connected to external 9V DC power supply, you can use a 9V lithium battery-powered, low-power design ultra-low power MSP430 MCU, and program design, making the whole system very power, particularly suitable for hand-held meter.中文翻译:温湿度测量仪1 引言温湿度测量是现代测量新发展出来的一个领域,尤其湿度的测量更是不断前进。
外文翻译 室内环境温度监测(英文原文)
Sustainable Cities and Society 13(2014)57–68Contents lists available at ScienceDirectSustainable Cities andSocietyj o u r n a l h o m e p a g e :w w w.e l s e v i e r.c o m /l o c a t e /s csMonitoring building energy consumption,thermal performance,and indoor air quality in a cold climate regionTanzia Sharmin a ,Mustafa Gül a ,∗,Xinming Li a ,Veselin Ganev b ,Ioanis Nikolaidis b ,Mohamed Al-Hussein aa Department of Civil and Environmental Engineering,University of Alberta,9105116th Street,Edmonton,Alberta,Canada bDepartment of Computing Science,2-21Athabasca Hall,University of Alberta,Edmonton,Alberta,Canadaa r t i c l ei n f oKeywords:Sensor-based monitoring system Energy usageBuilding envelope thermal performance Indoor air qualityBuilding management systema b s t r a c tBuildings are major consumers of the world’s energy.Optimizing energy consumption of buildings during operation can significantly reduce their impact on the global environment.Monitoring the energy usage and performance is expected to aid in reducing the energy consumption of occupants.In this regard,this paper describes a framework for sensor-based monitoring of energy performance of buildings under occupancy.Different types of sensors are installed at different locations in 12apartment units in a building in Fort McMurray,Alberta,Canada to assess occupant energy usage,thermal performance of the building envelope,and indoor air quality (IAQ).The relationship between heating energy consumption and the thermal performance of building envelope and occupant comfort level is investigated by analyzing the monitoring data.The results show that the extent of heat loss,occupant comfort level,and appliance usage patterns have significant impacts on heating energy and electricity consumption.This study also identifies the factors influencing the poor IAQ observed in some case-study units.In the long term,it is expected that the extracted information acquired from the monitoring system can be used to support intelligent decisions to save energy,and can be implemented by the building management system to achieve financial,environmental,and health benefits.©2014Elsevier Ltd.All rights reserved.1.IntroductionThe building sector accounts for about 30%of total green-house gas (GHG)emissions in Canada (NRC,2006).Furthermore,the construction and operation of buildings are responsible for over a third of the world’s energy consumption (Straube,2006).Data shows that energy consumption and GHG emissions in build-ing sector are growing at an advanced rate than in other sectors (Akashi &Hanaoka,2012).As a result,reducing energy consump-tion has become essential to planning,construction,and use of buildings from the environmental point of view (Stoy,Pollalis,&Fiala,2009).This also entails that the building sector has con-siderable potential for energy and energy-related CO 2emissionssavings (Gökc¸e &Gökc ¸e,2013).According to the International Energy Agency,the building sector can reduce energy consump-tion with an estimated energy savings of 1509Mtoe (million tonnes of oil equivalent)by 2050.Furthermore,through energy-efficient building design,carbon dioxide (CO 2)emissions can be reduced,∗Corresponding author.Tel.:+17804923002.E-mail address:mustafa.gul@ualberta.ca (M.Gül).which can possibly mitigate 12.6Gt (gigatonnes)of CO 2emissions by 2050(International Energy Agency,2010).Energy consumption by built environments can be reduced through new designs,technologies,and materials;proper control;and the use of effective energy management systems by consider-ing factors such as building orientation,shape,wall–window ratio,insulation,use of high-efficiency windows,and natural ventila-tion (Dawood,Crosbie,Dawood,&Lord,2013).However,electrical loads,especially miscellaneous electrical loads (involving a range of products,devices,and electrical equipment in some combina-tion,common in every household)consume a significant portion of total building energy (Hendron &Eastment,2006).In Canada,the residential building sector consumes approximately 16%of total secondary energy usage (NRC,2006).According to Statistics Canada,in 2007the average Canadian household consumed 106GJ (gigajoules)of energy,with the national total reaching 1,368,955TJ (terajoules)(Statistics Canada,2007).A substantial share of total energy consumption is due to improper use of appliances,and elim-inating this wastage can reduce the overall energy consumption by approximately 30%in buildings (US DOE Energy Information Administration,2003).Today it is important to focus on greater energy efficiency to reduce our impact on the environment by/10.1016/j.scs.2014.04.0092210-6707/©2014Elsevier Ltd.All rights reserved.58T.Sharmin et al./Sustainable Cities and Society13(2014)57–68reducing fossil fuel consumption(Gua,Sun,&Wennersten,2013; Sharmin,Li,Gökc¸e,Gül,&Al-Hussein,2012).Built environments also have a significant impact on human health.The extent of a building’s impact on human health and the environment depends on the building design,materials,and the methods used for construction and operation(Vittori,2002). According to the Science Advisory Board of the United States Envi-ronmental Protection Agency(EPA),indoor environment stands among the topfive environmental risks to public health.In Canada, people spend an average of89%of their time indoors and66%of their time indoors at home(Leech,Wilby,McMullen,&Laporte, 1996),and there is a possibility that people with weak immune systems may suffer from asthmatic symptoms or other respiratory health problems as a result of exposure to poor indoor air quality (Vittori,2002).Considering the fact that human health is affected by poor indoor air quality(IAQ),it is important to maintain a healthy IAQ in the interest of occupant health.Continuous monitoring of indoor environmental quality(IEQ)can thus play a significant role in maintaining healthy indoor environments.A significant aspect of assessing the sustainability of a building is the monitoring of energy performance(Berardi,2012).Recent innovations in sensing,data logging,and computing technologies have improved monitoring of indoor environment and energy per-formance of buildings.“Real-time”energy performance and IEQ monitoring are significant from the perspective of real-time feed-back to promote energy-saving behavior,and also for maintaining healthy IAQ.Proper targeting and monitoring of energy consump-tion and continuous energy management can be effective strategies for improved energy performance of buildings,and can result in reductions in operating costs of facilities(Lee&Augenbroe,2007; Sapri&Muhammad,2010).Research studies examining the effect of energy feedback information on occupant behavior have shown that real-time feedback can be a powerful impetus for behavioral change.McClelland and Cook(1980)first tested the impact of con-tinuous energy feedback on electricity usage.The results showed that on average electricity usage was lowered by12%in the homes with continuous electricity usage feedback compared to the homes with no usage feedback system(as cited in Allen&Janda,2006). In another study,a technical research university has monitored energy usage to reduce energy costs through an energy awareness program that offered departments a chance to receive payments of up to30%of the savings achieved.The departments had accom-plished energy savings(saving about$300,000per year)after one and half years of monitoring through improved operations and maintenance procedures and reduced their usage from about44 million kWh to40million kWh(Energy Star,2002).Hutton,Mauser, Filiatrault,and Antola(1986)have shown how the feedback pro-vided by monitoring helped to conserve energy for over75%of the subjects in25households in three cities.In a case regarding water usage,the city of Boston,MA,USA was unable to account for the use of50%of the water used in its municipal water system and,after installing meters,water that was unaccounted for had dropped to 36%(Grisham&Fleming,1989).Another study has shown that an effective energy management system can identify problems in an operating system which might not otherwise have been identified (Mills&Mathew,2009).Yang and Wang(2013)has shown that energy management systems can also provide comfortable building environments with high energy efficiency.Literature reviews from the last ten years show that usage of energy can be reduced from0%to20%by using a variety of feed-back mechanisms(Abrahamse,Steg,Vlek,&Rothengatter,2005). However,despite the fact that providing appropriate feedback can significantly reduce the overall energy consumption,relying only on occupants’awareness and behavioral change might not be an effective approach.In a recent study,wireless AC plug-load meters and light sensors were deployed in a computer science laboratory as a case study in energy monitoring.The study reported that more than30%energy savings were achieved immediately after installing a monitoring system,but that the savings were subse-quently reduced to less than4%of the week one level by the fourth week of the study.It light of this case,it might be considered that an effective solution for reducing energy consumption could be an automated energy management system,in addition to user coop-eration(Jiang,Van Ly,Taneja,Dutta,&Culler,2009).Major progress has been made in recent years in accomplish-ing greater awareness(Jiang et al.,2009),showing that advanced measurement of energy usage enables reduction of energy con-sumption.While the approach of monitoring energy usage is useful to achievefinancial benefits,a holistic monitoring of the perfor-mance of the building system can also be used to identify the factors influencing irregular energy usage or non-standard IEQ.Any information pertaining to irregularity of building system perfor-mance can contribute to building management systems intended to support operational improvement,and can also provide the infor-mation needed to encourage behavioral and operational changes by building occupants and operators.Monitoring is essential to achieving an energy-efficient building management system,but sensor-based monitoring is sometimes costly.In recent years more cost-effective high performance sensor technologies have been introduced,such that the benefits of utilizing this technology outweigh the associated costs.Continuous collection of the indi-vidualized energy use information would translate into increased energy use awareness,identification of problems in the building management system,and notification of irregular energy usage and non-standard indoor environmental parameters,all of which can lead to more sustainable building operations.However,it remains an open question whether the apparent additional understanding would be enough to justify the cost of installation,maintenance, and calibration of sensors.This paper thus offers a methodological approach by which to extract useful information by establishing relationships and studying patterns across different components of a building management system,facilitated by the installation of various sensors in a case study,the“Stony Mountain Plaza”project in Fort McMurray,Alberta,Canada.1.1.Objective and scopeThe objective of the sensor-based monitoring system adopted in this research is to provide relevant information regarding effec-tive management of building systems in cold-climate regions.The implemented monitoring system can be used for increasing energy performance and occupant comfort while reducing energy and water consumption.In this study,the ASHRAE standard specifying environmental parameter ranges(indoor air temperature,RH,CO2 level)has been used to define occupant comfort.A holistic exam-ination of the performance of the building system(energy usage, thermal performance,and IEQ)helps to determine whether or not the system is working efficiently by identifying correlations across different monitoring components.A more advanced understand-ing of the recorded data is expected to result in changes in building operations through the use of intelligent controls that automati-cally adjust to environmental requirements.It is expected that the extracted information and strategies acquired from the monitor-ing system can be implemented within the building management system to achievefinancial,environmental,and health benefits. 2.Methodological approachIn order to conduct a holistic examination of the performance of the building system under consideration,operating energy usage (e.g.,electrical energy usage,space heating energy usage,andT.Sharmin et al./Sustainable Cities and Society13(2014)57–6859Fig.1.Objective and methodological approach.household water usage);thermal performance of the building; and IAQ under occupancy are monitored.Twelve sample units are chosen in the building to be monitored for energy performance. Different types of sensors are installed in these individual units in order to monitor different components.Finally,recorded data are analyzed in order to extract useful information.Fig.1shows the objective and the monitored components for building energy performance under occupancy.2.1.Sample case-study unitTwo four-storey residential buildings have been constructed as part of the“Stony Mountain Plaza”project in Fort McMurray, Alberta,Canada.Both buildings are oriented with their longer axis facing north and south.Building1has70units while building2has 55units.There are two types of units in building1:one-bedroom and two-bedroom units.For monitoring building energy perfor-mance,three case-study units in eachfloor of building1with the same relativefloor plan position are selected:(1)Type‘A’unit (one-bedroom)facing north,(2)Type‘A’unit(one-bedroom)facing south,and(3)Type‘B’unit(two-bedroom)facing south.The sam-ple households are assigned code numbers1–12,and the specific locations of the units in theirfloors are not revealed for the sake of privacy.Fig.2displays the12case-study units.2.2.Types and locations of installed sensorsDifferent types of sensors are used for different types of required information in this assessment of building energy performance under occupancy.For electrical energy usage,Brultech ECM-1240 power meters are used.Each apartment receives power from two phases(phases A and B).Two power meters,one for each phase, recording the total energy for each load(in Ws)are therefore installed in each case-study unit.One Kamstrup MULTICAL601 heating meter is used for monitoring the energy from the water circulation heating system.Three sensors are also used for this purpose:oneflow meter and two temperature probes(for supply temperature,T s,and return temperature,T r).The heating meter records the total volume(L),total mass(g),currentflow(L/s),cur-rent T s and T r(◦C),and total energy(Wh).The energy consumed by the water circulation heating system can be calculated satisfying Eq.(1).E=V(T s−T r)k(1) where V:volume;T s:supply temperature;T r:return temperature; k:thermal coefficient.For monitoring household water usage,Minomess130water meters are used.There are two water meters in each apartment, one monitoring total incoming water and one monitoring output (cumulative hot water usage in the apartment)of the hot water tank.Two heatflux sensors(HFT3Soil Heat Flux Plate)are used for monitoring thermal performance of the building envelope:one measuring the heatflux(W/m2)through the studs and the other measuring the heatflux through the insulation.The sensor used for IAQ measurement is the IAQ Point air monitoring device man-ufactured by Honeywell Analytics.This device records real-time values of CO2(ppm),RH(%),and temperature(◦C)(Sharmin et al., 2012).The locations of the sensors for one-bedroom units and two-bedroom units are as shown in Fig.3.2.3.Development of system architectureThe power consumption meters(Brultech ECM-1240)commu-nicate using ZigBee with four EtherBee gateways(one on each floor),which are connected by a CAT5Ethernet cable to a single-board computer through a5-port switch.The energy meter andthe Fig.2.Case-study building and selection of case-study units.60T.Sharmin et al./Sustainable Cities and Society 13(2014)57–68Fig.3.Location of sensors in case-study units.IAQ sensor use the LonTalk protocol to communicate with an iLON smart server,which is also connected to the single-board computer where the data are being encrypted and transmitted to a database server through a secured connection over the Internet.The heat flux sensors are connected to the CR1000data logger (Campbell Scientific,Inc.)through a Solid State Multiplexer (Campbell Scien-tific,Inc.),which makes it possible to connect all 24of the heat flux sensors to a single data logger.The data logger converts the ana-log signal from the heat flux sensors into digital values and sends these values to the SBC through an Ethernet interface (Sharminet al.,2012).Fig.4provides a flowchart of the data collection system adopted in this project.3.Data analysisThis section discusses findings based on the collected data to assess building energy performance under occupancy.The data sets used for the analysis presented in this paper have been collected during regular operation of thebuilding.Fig.4.System architecture for data collection.T.Sharmin et al./Sustainable Cities and Society13(2014)57–6861Fig.5.Data analysis framework for electrical energy consumption.3.1.Measurement of electrical energy usageAccording to Statistics Canada(2007),Alberta’s average per household use of electricity in2007was the lowest among all provinces(26GJ).A possible reason for this low electricity con-sumption might be the comparably high rate of natural gas consumption in Alberta due to the low price of natural gas.In this paper,26GJ is set as the annual per household usage threshold. We consider the electricity consumption for individual appliances and the total electricity consumption for the case-study units. By measuring the electricity consumption of occupants,building management can pursue appropriate measures(i.e.,setting an opti-mum usage limit)if the electricity usage continuously exceeds the threshold of electricity usage established.Fig.5shows the data analysis framework for electrical energy consumption,while Fig.6shows the total electricity consump-tion by case-study unit(except unit8,because of missing data). It is observed in Fig.6that the electricity consumption by units7 (Type A)and9(Type A)in2012exceeds the26GJ threshold.Even though units7and9are type A(one-bedroom)units,the electric-ity consumption of these units is higher than the other case-study units.The data analysis framework(Fig.5)adopted in this study identi-fies factors that influence higher electricity consumption by a given unit by comparing the electricity consumption of different appli-ances of the selected unit with the average electricity consumption of individual appliances of all the case-study units.Fig.7presents the influencing factors for higher electricity consumption of3case-study units(units7,9and10).These three units are chosen as examples since two of them(units7and9)exceed the26-GJ thresh-old and the other unit(unit10)has comparatively higher electricity usage but appears to be influenced by different factors than units7 and9.Our data analysis shows that the primary factors influencing the higher electricity consumption in unit7are the bedroom appli-ances,electrical duct heating,kitchen plug,and kitchen-bathroom lighting,since electricity consumption by these appliances in unit 7is much higher than the average of the11case-study units for these appliances.A possible reason for higher electricity consump-tion in the bedroom of unit7may be the use of electrical heating radiators by occupants.On the other hand,bedroom appliances and oven usage for unit9and hot water tank and refrigerator usage for unit10are identified as the primary influencing factors accounting for the higher electricity consumption of the respective units.It is worth noting that household energy use can vary based on a number of factors,including the number of occupants,lifestyle, and usage of different appliances.With the continuous monitor-ing of electrical energy consumption,it is possible to identify the influencing factors of higher electricity consumption of occupants and to set an optimum value for electrical energy usage accord-ingly.Based on the monitoring of electricity usage carried out in this study,building management can set an appropriate optimum range of yearly energy usage by occupants.3.2.Measuring thermal performance of building envelope and space heating energy usageFor this research,the heatflux—the rate of heat energy transfer—through studs and insulation is also monitored.Since studs(working as thermal bridges between outdoor and indoor environments)lose more heat than does insulation,this research measures heatflux through studs and insulation separately.In order to assess the impact of orientation on heatflux for the case-study units,annual average heatflux through studs and annual average heatflux through insulation are compared for north-facing and south-facing units.At eachfloor level,one north-facing unit and one south-facing type A(one-bedroom)unit are selected in order to compare heatflux.As expected,the collected data in Fig.8shows that north-facing units have greater heat loss than south-facing units when considering the2nd and3rdfloor.However,contrary to expectations,at the ground(stud)and topfloor,south-facing units have greater heat loss than north-facing units.The recorded data in Fig.8gives an inconclusive result.In order to identify long-term patterns(if any)of heatflux for different orientations,it is impor-tant to monitor the data for a few years.If patterns of heatflux for differentfloor levels(variations with respect to height)or differ-ent orientations are identified,measures(i.e.,increasedinsulation) Fig.6.Electricity consumption for case-study units.62T.Sharmin et al./Sustainable Cities and Society 13(2014)57–68Fig.7.Electricity consumption of individual appliances by units 7,9and10.Fig.8.Heat flux for different orientations and floor levels in 2012.can be taken to reduce heat flux for the units with higher rates.Increasing the thermal performance of the building envelope also provides an opportunity to reduce significantly the heating loss of a building,but this is beyond the scope of this study.Fig.9shows the data analysis framework adopted in this study for heating energy consumption.The framework examines the impact of heat flux and outdoor temperature on heating energy consumption.The indoor air temperature maintained in the unit is also compared with the standard indoor temperature range in order to gain understanding of the relationship between occupant comfort level and heating energy consumption.As expected,the recorded data (Fig.10)shows that apart-ments consume more heating energy as the outside temperature decreases.Fig.10also shows the relationship between heat flux and heating energy consumption such that units with higher heat flux in general have higher heating energy consumption,with some exceptions,e.g.,unit 12in October and unit 7in January;(in these exceptions,even though heat loss was high,heating energy con-sumption was comparatively low).In general,variations in theoccupancy,such as vacations and other absences,can directly impact the energy consumption,and the absence of residents ren-ders the heat comfort level of individuals irrelevant with respect to its impact on energy consumption over these periods of absence.Another exception is with respect to unit 7in November and December.Data shows that even though heat flux was lower in unit 7,heating energy consumption was higher (compared to unit 12)in November and December.There is a possibility that occupant comfort level with a higher temperature range may have resulted in higher heating consumption in unit 7.Recorded data indicates that the indoor air temperature in unit 7has always been maintained at a higher level (sometimes exceeding the standard temperature range)compared to unit 12,indicating that occupant preference for a higher temperature range may be the reason for higher heat-ing consumption during October-December in unit 7,even though heat loss was less than for unit 12.It should be noted that occupant lifestyle and comfort level may affect the heating energy consump-tion significantly.In order to manage heating energy effectively,it is necessary to monitor and analyze the heating energy usageT.Sharmin et al./Sustainable Cities and Society 13(2014)57–6863Fig.9.Data analysis framework for heating energyconsumption.Fig.10.Heat flux and heating energy consumption in north-(unit 7)and south-facing (unit 12)units.regularly and to set realistic targets for improving energy effi-ciency.3.3.Measurement of household water usageHousehold water usage is also being monitored as part of this study.According to Environment Canada ,in 2009average resi-dential water use was 72.38gallons per capita per day,which corresponds to 26,420gallons per capita per year (Municipal Water Use Report,2011).Fig.11shows the water consumption by case-study unit in 2012.The results indicate that even though unit 9is a one-bedroom unit (assumed to be accommodating fewer residents than two-bedroom units),it exhibits the highest water consumption.By measuring the water usage of occupants,build-ing management can pursue appropriate measures (i.e.,optimum usage range)if the water usage per person for a particular unit is continuously higher than the Canadian average residential water usage per capita per day.The recorded data in Fig.11shows that hot water consumption typically accounts for more than 30%of total water consumption in the case-study units,with the exception of unit 11.Since in thisproject energy is drawn from used hot water through drain water heat recovery (DWHR),there is a possibility that this gray water could be used for toilet flushing.It should be noted that the use of gray water in the case-study units is beyond the scope of this study.3.4.Indoor air quality (CO 2concentration and relative humidity)measurementElevated CO 2levels affect occupant comfort and IAQ.With ele-vated CO 2levels,occupants may complain of perceived poor air quality and may face health problems such as headaches,fatigue,and eye and throat irritation.Poor air quality may reduce the effi-ciency of the occupants (Wyon &Wargocki,2006)and this loss can be reduced through proper design strategy (Wyon,1996).The rela-tionship between indoor CO 2concentration and IAQ is in terms of the impact of elevated CO 2on comfort,and the correlation between CO 2and ventilation (Aglan,2003).According to the American Soci-ety of Heating,Refrigerating and Air-conditioning Engineers Inc.(ASHRAE),buildings with proper ventilation should have CO 2lev-els not in excess of 1000ppm (Quinn,2011).Exceeding this level is likely indicative of inadequate ventilation.In consideration of this,64T.Sharmin et al./Sustainable Cities and Society13(2014)57–68Fig.11.Total water consumption of case-study units in2012.Fig.12.IAQ data analysis framework for CO2.Fig.13.IAQ data analysis framework for RH.T.Sharmin et al./Sustainable Cities and Society 13(2014)57–6865Fig.14.Monthly average CO 2concentration level in case-studyunits.Fig.15.Average CO 2level and ERV electricity consumption in case-study units for February and March,2012.Figs.12and 13show the framework of IAQ data analysis (CO 2and RH,respectively)considered in this project.The results of data analysis (Fig.14)show that CO 2concentra-tion levels exceed the 1000ppm threshold in units 1,3,4,5,8,and 9for several months of 2012.In order to determine if lack of energy recovery ventilation (ERV)usage is the reason for the elevated level of CO 2,electricity consumption by the ERV is inves-tigated for the case-study units for February and March,2012.These two months are chosen as examples since most of the units exceed the threshold during these two months.Fig.15shows the CO 2con-centration and ERV electricity consumption by unit,exhibiting that the units with higher ERV usage have in general relatively lowerCO 2concentration (units 7,10,and 11),while units with lower ERV usage have higher CO 2concentration (units 1,3,4,5,and 9).An improper heating,ventilation,and air conditioning system (HVAC),as well as unvented appliances (space heaters,dryers,stoves,and any other unvented gas appliances)in a house,can lead to high levels of indoor CO 2(Health Canada,1995).Complementing the recorded data (ERV usage record),interviews with occupants may be helpful for identifying the factors influencing higher CO 2levels in the identified units.Once the causal factors are identified,necessary steps (e.g.,imposing the use of ERV,proper maintenance of HVAC system and appliances)should be taken in the interest of occupant health.。
外文翻译(供热站温度实时监测)
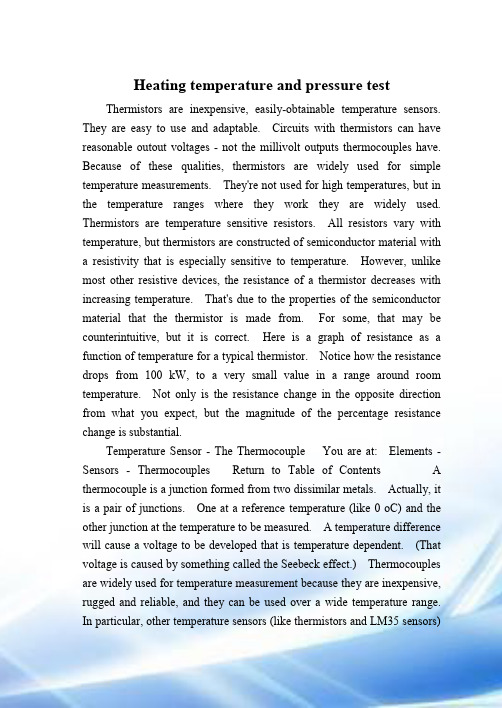
Heating temperature and pressure test Thermistors are inexpensive, easily-obtainable temperature sensors. They are easy to use and adaptable. Circuits with thermistors can have reasonable outout voltages - not the millivolt outputs thermocouples have. Because of these qualities, thermistors are widely used for simple temperature measurements. They're not used for high temperatures, but in the temperature ranges where they work they are widely used. Thermistors are temperature sensitive resistors. All resistors vary with temperature, but thermistors are constructed of semiconductor material with a resistivity that is especially sensitive to temperature. However, unlike most other resistive devices, the resistance of a thermistor decreases with increasing temperature. That's due to the properties of the semiconductor material that the thermistor is made from. For some, that may be counterintuitive, but it is correct. Here is a graph of resistance as a function of temperature for a typical thermistor. Notice how the resistance drops from 100 kW, to a very small value in a range around room temperature. Not only is the resistance change in the opposite direction from what you expect, but the magnitude of the percentage resistance change is substantial.Temperature Sensor - The Thermocouple You are at: Elements - Sensors - Thermocouples Return to Table of Contents A thermocouple is a junction formed from two dissimilar metals. Actually, it is a pair of junctions. One at a reference temperature (like 0 oC) and the other junction at the temperature to be measured. A temperature difference will cause a voltage to be developed that is temperature dependent. (That voltage is caused by something called the Seebeck effect.) Thermocouples are widely used for temperature measurement because they are inexpensive, rugged and reliable, and they can be used over a wide temperature range. In particular, other temperature sensors (like thermistors and LM35 sensors)are useful around room temperature, but the thermocouple can The Thermocouple Why Use thermocouples To Measure Temperature? They are inexpensive. They are rugged and reliable. They can be used over a wide temperature range. What Does A Thermocouple Look Like? Here it is. Note the two wires (of two different metals) joined in the junction. What does a thermocouple do? How does it work? The junction of two dissimilar metals produces a temperature dependent voltage. For a better description of how it works, click here. How Do You Use A Thermocouple? You measure the voltage the thermocouple produces, and convert that voltage to a temperature reading. It may be best to do the conversion digitally because the conversion can be fairly nonlinear. Things You Need To Know About Thermocouples A junction between two dissimilar metals produces a voltage. In the thermocouple, the sensing junction - produces a voltage that depends upon temperature. Where the thermocouple connects to instrumentation - copper wires? - you have two more junctions and they also produce a temperature dependent voltage. Those junctions are shown inside the yellow oval. When you use a thermocouple, you need to ensure that the connections are at some standard temperature, or you need to use an electronically compensated system that takes those voltages into account. If your thermocouple is connected to a data acquisition system, then chances are good that you have an electronically compensated system. Once we obtain a reading from a voltmeter, the measured voltage has to be converted to temperature. The temperature is usually expressed as a polynomial function of the measured voltage. Sometimes it is possible to get a decent linear approximation over a limited temperature range. There are two ways to convert the measured voltage to a temperature reading. Measure the voltage and let the operator do the calculations. Use the measured voltage as an input to a conversion circuit - either analog or digital. Let us look at some other types of base-metal thermocouples. Type T thermocouples arewidely used as are type K and Type N. Type K (Ni-Cr/Ni-Al) thermocouples are also widely used in the industry. It has high thermopower and good resistance to oxidation. The operating temperature range of a Type K thermocouple is from -269 oC to +1260 oC. However, this thermocouple performs rather poorly in reducing atmospheres. Type T (Cu/Cu-Ni) thermocouples can be used in oxidizing of inert atmospheres over the temperature range of -250 oC to +850 oC. In reducing or mildly oxidizing environments, it is possible to use the thermocouple up to nearly +1000 oC. Type N (Nicrosil/Nisil) thermocouples are designed to be used in industrial environments of temperatures up to +1200 oC. A polynomial equation used to convert thermocouple voltage to temperature (oC) over a wide range of temperatures. We can write the polynomial as: The coefficients, an are tabulated in many places. Here are the NBS polynomial coefficients for a type K thermocouple. (Source: T. J. Quinn, Temperature , Academic Press Inc.,1990) Type K Polynomial Coefficients n an 0 0.226584602 1 24152.10900 2 67233.4248 3 2210340.682 4 -860963914.9 5 4.83506x10¹⁰ 6 -1.18452x10¹² 7 1.38690x10¹³ 8 -6.33708x10¹³ What If The Surrounding Temperature Exceeds Limits? There are really no thermocouples that can withstand oxidizing atmospheres for temperatures above the upper limit of the platinum-rhodium type thermocouples. We cannot, therefore, measure temperature in such high temperature conditions. Other options for measuring extremely high temperatures are radiation or the noise pyrometer. For non-oxidizing atmospheres, tungsten-rhenium based thermocouples shows good performance up to +2750 oC. They can be used, for a short period, in temperatures up to +3000 oC. The selection of the types of thermocouple used for low temperature sensing is primarily based on materials of a thermocouple. In addition, thermopower at low temperatue is rather low, so measurement of EMF will be proportionally small as well.More Facts On Various Thermocouple Types A variety of thermocouples today cover a range of temperature from -250 oC to +3000 oC. The different types of thermocouple are given letter designations: B, E, J, K, R, S, T and N Types R,S and B are noble metal thermocouples that are used to measure high temperature. Within their temperature range, they can operate for a longer period of time under an oxidizing environment. Type S and type R thermocouples are made up of platinum (Pt) and rhodium (Rh) mixed in different ratios. A specific Pt/Rh ratio is used because it leads to more stable and reproducible measurements. Types S and R have an upper temperature limit of +1200 oC in oxidizing atmospheres, assuming a wire diameter of 0.5mm. Type S and type R thermocouples are made up of platinum (Pt) and rhodium (Rh) mixed in different ratios. A specific Pt/Rh ratio is used because it leads to more stable and reproducible measurements. Types S and R have an upper temperature limit of +1200 oC in oxidizing atmospheres, assuming a wire diameter of 0.5mm. Type B thermocouples have a different Pt/Rh ratio than Type S and R. It has an upper temperature limit of +1750 oC in oxidizing atmospheres. Due to an increased amount of rhodium content, type B thermocouples are no quite so stable as either the Type R or Type S. Types E, J, K, T, and N are base-metal thermocouples that are used for sensing lower temperatures. They cannot be used for sensing high temperatures because of their relatively low melting point and slower failure due to oxidation. Type B thermocouples have a different Pt/Rh ratio than Type S and R. It has an upper temperature limit of +1750 oC in oxidizing atmospheres. Due to an increased amount of rhodium content, type B thermocouples are no quite so stable as either the Type R or Type S. we will look into some differences between different base-metal thermocouples. Type E (Ni-Cr/Cu-Ni) thermocouples have an operating temperature range from -250 oC to +800 oC. Their use is less widespread than other base-metal thermocouples due to its low operating temperature. However,measurements made by a Type E have a smaller margin of error. 1000 hours of operation in air of a Type E thermocouple at +760 oC, having 3mm wires, shold not lead to a change in EMF equivalent to more than +1 oC. Type J (Fe/Cu-Ni) thermocouples are widely used in industry due to their high thermopower and low cost. This type of thermocouple has an operating temperature range from 0 oC to +760 oC. Links to Related Lessons Temperature Sensors Thermistors Thermocouples LM35s Other Sensors Strain Gages Temperature Sensor Laboratories Return to Table of ContentsExperiments With Temperature Sensors - Data Gathering Measuring temperature is the most common measurement task. There are numerous devices available for measuring temperature. Many of them are built using one of these common sensors. Thermistor Thermocouple LM35 Integrated Circuit Temperature Sensor You can get more information about these sensors by clicking the links above. Laboratory The purpose of this laboratory is to get time response data for the three sensors you were introduced to labs week. Here are links to LabVIEW programs you can use. NTempsHydra.vi - to measure temperature from the Hydra. NVoltsHydra.vi - to measure voltage from the Hydra. ResetHydra.vi - A "sub-vi" you need to reset the Hydra. 1Temp.vi - A sub-vi that will take one temperature measurement on the Hydra. 1VoltHydra.vi - A sub-vi that will take one voltage measurement on the Hydra. You should have all the files above on your desktop. You can click on each link and save to the desktop, or you can find the NMeas folder in my public space and copy the entire folder to the desktop (best). You only need to double click the NTemps or NVolts files to start and run them in LabVIEW - but they have to be taken out of the network folder! Once you have the files together in a single folder on your desktop, Start NTempsHydra.vi to measure temperature using the thermocouple attached to terminals 21 (yellow lead) and 22 (red lead).Note that these terminals (21 and 22) are the connections for channel 1 for the Hydra. (For example, if you were doing a manual temperature reading using the front panel, you would need to set to channel 1.) You need to connect the yellow lead of the thermocouple to the top connector for Channel #1 (Terminal #21) and the red lead of the thermocouple to the bottom connector (ground?) for Channel #1 (Terminal #22). Both of those connections are made to the connector strip on the top of the Hydra Data Acquisition Unit. Start NVoltsHydra.vi to measure voltages using the LM35 and the voltage divider circuit for the thermistor. Both sets of measurements should be taken from the front panel connection points on the Hydra. For both the LM35 and the thermistor circuit, you need to supply 5v to the circuit board. In your lab notebook record any circuitry you use, and any pertinent points regarding the equipment you use. Note any other features of each sensor that will help you for your project or make things more difficult. Do the following: Connect each sensor. Here are links to using each sensor in a measurement. Thermocouples LM35s Thermistors For each sensor you need to get data in two situations: As the sensor heats up (rising time constant behavior) As the sensor cools down to ambient temperature (decaying time constant behavior) That data should be stored in a computer file. Use a different, understandable name for each file. The program will prompt you for a file name. Suggested file names are things like ThermistorUp.txt, etc. Before you leave lab be sure that you can bring your data up in Excel (to test that you have a good data file) and that you can plot the data to see that it looks like what you expect. Estimate the following for each sensor. The time it will take for the sensor to get within 1oC when the sensor is in good thermal contact with the temperature environment being measured and the temperature sensor starts at 25 oC and goes to 50 oC. (That means to measure the time it takes to get to between 49 oC and 51 oC.) The time it will take for the sensor to get within 1oC of the final value when the sensoris in air at a constant temperature and the temperature sensor starts at 25oC and goes to 50oC. In other words, when will the temperature sensor reach 49oC? The time it will take for the sensor to get within 0.1oC for the two situations above. (i.e., between 49.9 oC and 50.1 oC.) The time it will take for the sensor to get within 1oC when the sensor is in good thermal contact with the temperature environment being measured and the temperature sensor starts at 50 oC and goes to 25 oC. Explain why there is a difference in the speed of the response in the various situations above. Your report should show calculations for the time constant(s) for each device, and should show the results using the three methods. Tabular presentation of the results is best. Finally, you should - as best possible - explain your results. Why would the time constant be different going up and going down.供热站温度压力实时检测热敏电阻很便宜,易于得到的温度传感器。
「基于单片机温度监测系统设计的外文翻译」
「基于单片机温度监测系统设计的外文翻译」Translation of "Design of Temperature Monitoring System based on Microcontroller" in English and Chinese:
English:
Design of Temperature Monitoring System based on Microcontroller
Abstract:
Chinese:
基于单片机温度监测系统设计
摘要:
本文介绍了一种基于单片机的温度监测系统的设计。
该系统由多个组件组成,包括传感器、单片机和显示装置。
传感器负责检测温度,而单片机处理数据并将其发送到显示装置进行可视化。
该系统的主要目的是在不同环境中提供实时温度监测。
详细讨论了系统的设计和实施,包括组件选择、电路设计和单片机编程。
系统经过了成功的测试,结果显示出较小的误差和准确的温度测量结果。
该系统可广泛应用于工业自动化、环境监测和家用电器等各种应用领域。
温湿度测量仪外文文献翻译、中英文翻译
外文翻译英文原文:Temperature and humidity measuring instrumentIntroductionTemperature and humidity measurement is a modern newly developed measurement field, especially the humidity measurement is to continue moving forward. Experienced a length method, dry and wet until today the course of the measurement, humidity measurement technology is maturing. Today, we are no longer satisfied with the measurement of the temperature and humidity, especially in some places to monitor directly the requirements of real-time measure and record the temperature and humidity changes in the whole process, and based on these changes identified during storage and transportation security, led to a new temperature and humidity measuring instrument was born. Temperature and humidity measuring instrument is the temperature and humidity parameters were measured according to a predetermined time interval stored in the internal memory, in the completion of the recording function will be coupled to a PC, use the adapter software data stored in accordance with values time analysis instrument. The instrument can determine the storage and transportation process, experiment process without any compromise product safety incident.MSP430F437 IntroducedThe MSP430 MCU main features are as follows:1)Ultra-low power consumption. MSP430 MCU supply voltage 1.8 to 3.6V low voltage RAM data retention mode power consumption of only 0.1uA active mode power 250uA/MIPS, IO input port leakage current of only 50nA.2)Powerful processing capability. The MSP430 MCU 16-bit microcontroller, reduced instruction set architecture with the most popular one clock cycle to execute an instruction, the MSP430 instruction speeds of up to 8MHz oscillator is 8MIPS.3)High-performance analog technology and a wealth of on-chip peripheral modules. The MSP430 monolithic organic combination of TI's high-performance analog technology, each member of the rich on-chip peripherals are integrated. Depending on the model of the different possible combinations of the following modules: watchdog,analog comparator A timer A, timer B, serial 0,1, hardware multiplier, LCD driver, 10/12/14-bit ADC, 12 DAC IIC bus, direct data access, port 1 to 6, the basic timer. 4)The system is stable. Power-on reset, first initiated by the DC0 CPU, to ensure that the program starts executing from the correct position to ensure crystal oscillator start-up and stabilization time. The software can then set the appropriate control bits of the register to determine the final system clock frequency. If the crystal oscillator is used as the CPU clock MCLK failure, the DCO will start automatically, in order to ensure the normal operation of the system. This structure and operational mechanism in the current series microcontroller is unique.5)Convenient and efficient development environment. MSP430 series OTP type, three types of FLASH-ROM, the domestic large-scale use FLASH. The development of these devices means, after the successful development of the OTP and ROM-type device using a dedicated emulator programmer or chip cover touch. FLASH type is very convenient development and debugging environment, because the device on-chip JTAG debug interface, as well as the electric flash FLASH memory using the first through the JTAG interface to download the program to the FLASH, run by the JTAG interface control program read the on-chip CPU status, and memory contents and other information for designers debug the entire development can be carried out in the same software integrated environment. Which only requires a PC and a JTAG debugger, without the need for a dedicated emulator and programmer. Temperature And Humidity SensorThe SHT7x temperature and humidity sensor characteristics are as follows:1)The temperature and humidity sensor signal is amplified conditioning, A / D converter, all integrated on one IIC bus interface;2)Given calibration relative humidity and temperature output;3)IIC bus with industry-standard digital output interface;4)With dewpoint calculation output function;5)With excellent long-term stability;6)Humidity value output resolution of 14 The temperature output resolution of 12 bits, and programmable;7)Small size (7.65 x 5.08 x 23.5mm) Surface Mount;8)Having reliable the CRC data transmission checking function;9)The chip load calibration coefficients can guarantee 100% interchangeability;AT25256 IntroductionTemperature and humidity data storage chip SPI interface uses ATMEL Corporation's low-voltage serial EEPROM AT25256. AT25256 is mainly applied to low-power occasion the internal accordance with 32K x 8-bit organization, can work at 3.3V, the maximum serial clock frequency as to 2.1MHz. Support for 64-byte page write mode and byte write mode. AT25256 by setting the write-protect pin / WP level to set the chip read-only or writable state. Serial Peripheral Interface (SPI) bus technology is a synchronous serial interface, the hardware features a strong, SPI software is quite simple, so that the CPU has more time to deal with other matters. SPI bus can be connected to multiple host MCU, equipped with SPI interface output devices, output devices, such as LCD drivers, A / D conversion and other peripherals can also be a simple connection to a single TTL shift register chip. The bus allows you to connect multiple devices, but only one device at any moment as the host.SPI bus clock line is controlled by the host, in addition to data lines: host input / output line from the machine and the host output / slave input line. Host and which slave communication through the slave strobe line selection.Application SPI system can be simple, complex and can take many forms: (1) a host MCU and the slave MCU; (2) multiple MCU are connected to each other into a multi-host system; (3) a host MCU and slave peripherals.Segment LCD Display PrincipleLCD display principle is to use the physical characteristics of the liquid crystal born, when power is turned on, arranged order so light by; arranged confusion is not energized, to prevent the light to pass through. Light to pass through and not through a combination of an image is displayed on the screen. In layman's terms, the liquid crystal display is the middle of the two glass clip a layer of liquid crystal material, the liquid crystal material to change their light transmission in the signal under the control of the state, so you can see the image in front of the glass panel. LCD ambient light to display information, the LCD itself is not self-luminous, LCD power consumption is very low, more suitable for single-chip low-power applications. In addition, the LCD can only use low-frequency AC voltage drive, the DC voltage will damage the LCD. There are many types of LCD segment liquid crystal character LCD, graphical LCD. Segment LCD inexpensive, simple to use, is widely used in a variety of microcomputer application system.MSP430 LCD driver module has four driving method, respectively, for static drive, 2MUX drive, 3MUX, Drivers, 4MUX drive. Static driving method, in additionto the public badly in need of a pin, each section of the drive each one pin. If the design involves a lot of number of segments, you need to take up the many pin. In order to reduce the pin number, you can select multiple drive needed: 2MUX drive, drive, 3MUX 4MUX driving method. Increase the number of public-pole, can greatly reduce the number of pins. Need to drive more segments, the more obvious effects. ConclusionThe design requirements to simultaneously detect the temperature and humidity. From the temperature and humidity sensor signal IIC bus to enter MSP430F437 MSP430F437, temperature and humidity data on the one hand to send the LCD display; the other hand, the temperature and humidity data is stored in AT25256 stored temperature and humidity data can be transmitted via RS232 bus to the PC, In the PC application, you can curve shows the temperature and humidity data, and can print the report.This design uses the MSP430 MCU measurement of temperature and humidity, display, storage, transmission, printing and other functions. But also through the button on the temperature and humidity measurement time interval, whether storage, starting time and other parameters set. In addition, the entire system can be connected to external 9V DC power supply, you can use a 9V lithium battery-powered, low-power design ultra-low power MSP430 MCU, and program design, making the whole system very power, particularly suitable for hand-held meter.中文翻译:温湿度测量仪1 引言温湿度测量是现代测量新发展出来的一个领域,尤其湿度的测量更是不断前进。
温度检测外文资料

Method for Effective Calibration of T emperature Loggers with Automated Data Sampling and EvaluationS. Ljungblad·L. E. Josefson·M. Holmsten1 IntroductionData loggers, such as Gemini Data loggers, are an easy-to-use and cheap method for recording data over time. The data loggers are used to monitor different parameters in many different areas such as the healthcare industry, the food industry, logistics, meteorology, and the environment . The loggers are normally programmed via some software to record at a certain frequency and placed at the spot where the data acquisition is going to take place. The logged data are first received when the logger is connected to the computer again. This feature makes calibration of data loggers time-and cost-consuming. Connolly presented an automated calibration procedure for industrial platinum resistance thermometers. Another example of an automated calibration procedure but for thermocouples and with wireless communication is presented by Y ang .The objective of the project is to develop an automated method that makes the calibration of data loggers more time- and cost-efficient. This method has been developed for temperature loggers from Gemini Data loggers, but the software could be adapted to suit other types of loggers as well.To suit the needs of the many different application areas, there are of course loggers with various capabilities when it comes to temperature measurements. However, the loggers from Gemini Data Loggers are all compatible with EasyView, the software provided by the manufacturer and commonly used to communicate with loggers of this make. However, this software can only be used to download and present the data from the loggers, not process the data. The evaluation needed of the data received from EasyView is quite straightforward but time-consuming. The main reason for this project has been to automate the calibration and evaluation process, so that it would be less time-consuming and hence more cost-efficient. The calibration software developed by SP, SPTempLogger, controls the communication with the loggers through EasyView, and thus the communication protocol ofthe logger software does not need to be known. But, in addition to this, SPTempLogger also evaluates the downloaded data.Most of the temperature loggers that we calibrate have an internal NTC thermistor.There are also loggers with external probes with either a thermistor or a Pt100 or Pt1000 sensor.2 Laboratory Equipment and Calibration ProcedureWhen the data loggers are received in the temperature laboratory, they are each assignedan individual calibration number. Details abouteach logger such as themodel, serial number, markings, or external probes are registered.When the loggers are to be calibrated, they are first connected to a jack panel,a commercial eight-channel USB-to-serial converter. In this jack panel, up to eight loggers can be connected at the same time. In addition, two loggers can be directly connected to the computer, i.e., ten loggers can be connected at the same time. The SPTempLogger software is then started and scans for connected loggers. The loggers are started individually, and calibration temperatures are selected and saved for each logger in a text file. This part is only partly automated as the appropriate settings of each logger may be different depending on both the calibration requested and the logger itself. The calibration temperatures requested also need to be specified.The loggers are then disconnected and the whole loggers, if there are no external probes, are placed in calibration baths properly protected from the bath liquid. The method of protection differs depending on the model. For the most common models,metallic tubes that the loggers fit into with a minimum of air inside are used. The base of the tube is welded shut and has a support so that the loggers do not rest on the bottom of the bath. On top of the loggers inside the tube is Styrofoam to isolate the logger from the environment outside the bath. The other method of protection for loggers of different shapes and sizes is to protect them with a thin plastic film, usually two layers to prevent leakage. The first method requires much less time to set up, butthe loggers will need longer time in the liquid bath to stabilize. When the two methods were compared, the same results were achieved with both.The amount of loggers that can be calibrated simultaneously depends on the liquid baths and the logger model. If too many loggers are put in the bath at the same time,the temperature distribution within the bath might be disturbed. We primarily use two commercial calibration baths with a stability better than 0.01 ℃. Both of these calibrationbaths have a large opening and are suitable for calibrating up to 12 loggers at the same time. The first is a Hart Scientific Model 7037 bath which is used with ethanol as the working fluid between -35 ℃and 15 ℃. The second bath is a Heto Model KB 24 used with water between 15 ℃and 80 ℃. For temperatures below -35 ℃and above 80 ℃, we use calibration baths with smaller openings and thus cannot calibrate more than a few loggers at once. We have a range of calibration baths from -100 ℃to 550 ℃from Heto, Hart Scientific, and our own brand.The reference temperature in the baths is measured with a calibrated digital thermometer (Hart Scientific Model 1502A) with a Pt100 sensor. The instrument transmits the measured temperature by way of Bluetooth to a computer which saves the temperatures and the time of measurements in a file. Other types of communication such as RS-232 and USB may be used as well, depending on the reference instrument. The reference temperature is also displayed graphically on the screen so one can easily seewhether the temperature in the bath is stable or not, and for how long it has been so.The loggers are left in the liquid bath after the temperature has stabilized for at least an hour and a half, if the logger has an internal sensor. Through experimentation,this has been determined to be enough time for the temperature to stabilize inside the logger. Loggers with external sensors require less time to stabilize. A calibration usually consists of two or more temperatures, and thus the temperature of the bath may need to be changed when the first calibration temperature is completed, or the loggers and reference thermometer moved to a different bath.When the calibration is completed, the loggers are extracted from the bath and thereference temperature logging stopped. The loggers are then connected to the jack panel again and the SPTempLogger software started. The software downloads the temperature measurement data from the first logger. It then proceeds to evaluate these results compared to the corresponding reference temperature file. When a resulting mean value for each calibration temperature has been calculated, it continues with the next logger in turn.When all loggers connected to the jack panel have been evaluated, the results are displayed in a table and can be saved directly to a database from which the calibration certificate is produced.3 MeasurementsFigure 1 presents a graph of a calibration with both the reference and logger temperature.This is a calibration in three temperatures, and though each logger is evaluated separately, a number of loggers can be calibrated in the same bath at the same time,using the same reference data.As seen in Fig. 1, the reference thermometer has a faster response time than theFig. 1 Logger calibration temperatures4 Evaluation of Logger DataThe procedure for evaluation of logger data has been chosen both because it delivers reliable and accurate results and because it is time efficient. A similar, but more advanced evaluation algorithm is described by Wilhelm et al.The evaluation algorithm first calculates a preliminary mean reference temperature for each calibration temperature of the logger in question. The calibration temperature is the nominal temperature, e.g,-25 ℃, and the reference temperature is the actual measured temperature in the bath, e.g,-24.975 ℃. To find this preliminary mean reference temperature, an algorithm searches through the reference temperature data for a temperature plateau. 95% of the reference temperatures within a 15 min period should be within±2 ℃of the calibration temperature. In addition to this, the standard deviation of the reference data inthat interval should be below a specified value. The chosen limit value for the standard deviation depends on the reference thermometer used, and also on the stability of the calibration bath used. Through experimentation we have determined that the values in table 1 for the standard deviation are suitable for our facility. When an interval that meets the criteria has been found, its start and stop times are registered. The result of this is that we have a time interval when the temperature in the calibration bath was stable close to the calibration temperature.Table 1 Limit values for the standard deviation of the reference temperature for a plateau interval Calibration temperature (℃)Standard deviation (℃)<30 0.00130-50 0.005>50 0.01The program then tests the next interval by setting a start time one measurement later and evaluating it against the same criteria. The last 15 min interval found that meet the criteria will be the one selected. The mean temperature of this interval is set as a preliminary reference temperature. Figure 2 shows the selection of the last 15 min interval for the -25 ℃plateau.After this, the logger data are evaluated. The algorithm searches through the logger data looking for a 15 min interval that has confidence level of 95%and is previous to the stop time of the determined reference temperature plateau. That means in this case that 95%of the values within the 15 min interval are within ±1 ℃℃from the calculated preliminary mean reference temperature. The resulting interval will be the last one in the data that meets both criteria. Figure 3 shows the selected 15 min interval for the一25 ℃plateau. The algorithm will have found the logger data for the last 15 min of the temperature plateau, before the temperature in the bath is changed or the loggers extracted from the bath.An algorithm then scales the chosen interval from 15min to lOmin. This is to make sure that the resulting interval is not affected by any errors that may occur if the reference thermometer is removed from the calibration bath before the loggers. If the difference between the mean logger temperature of the 15 min interval and the first value of the 15 min interval is larger than the difference between the mean logger.temperature and the last value of the interval, the first value would be discarded. This procedure is repeated until the interval left is 10 min long. If the temperature is stable for the whole interval, the same amount of values will be discarded from each end.The mean temperature, resolution, and standard deviation of the logger are calcufated for this 10 min interval. The algorithm then searches through the logged reference temperature data, and finds the corresponding time interval and calculates a mean reference temperature for those l0min.T able 2 Results for calibration at −25 ℃Temperature(℃)Resolution(℃)Standard deviation Reference -24.9747 0.001 0.00069Logger -24.990 0.003 0The result for the calibration at -25℃in our example is shown in Table 2. These results are displayed in a table at the end of the evaluation process, but one can also choose to have a diagram displayed on the screen or printed. This provides a quick way to check that the software has been able to choose the correct time interval to evaluate. A diagram of the entire calibration like the one in Fig. 1 is also printed to get a quick overview and see that the logger has had sufficient time to stabilize.5 ResultsThe result of the evaluation is a mean temperature for each calibration temperature and logger, and a corresponding mean reference temperature based on the same time interval as the logger's mean temperature.In addition to this, we also know the resolution for each logger at the cali bration temperatures, as well as the standard deviation of the logger data. These results, together with data for the calibration equipment, etc., are used to calculate the measurement uncertainty associated with each calibration. The calibration baths have temperature gradients present in the bath, and in addition, the loggers disturb the circulation in the bath. By careful systematic measurement at different places in the bath with a SPRT,the uncertainty contribution from temperature gradients in the bath is estimated to 0.021℃.。
关于温湿度检测的外文翻译

滨州学院毕业设计(论文)开题报告题目基于单片机的粮库温湿度智能检测系统的研究系(院)物理与电子科学系年级 2009级专业电子信息科学与技术班级 1班学生姓名董乃旭学号********** 指导教师李洁职称讲师滨州学院教务处二〇一三年三月An Automatic Measuring System Based on Atmospherical Measurement Used for Temperature Relay For temperature relay, it is very important to measure its temperatures for action and reversion. In this paper, anautomatic measuring system based on atmospherical measurement is discussed, which is very simple andprecise in practical application. In atmospherical measurement, it is crucial to design a favorable temperaturefield. The resistance stove is designed for simulating temperature field. The even temperature is improved bylong-time warm-up and placing orifice-board in testing room. According to the enactment controlling temperature curve, the algorithm of fuzzy control is used to control the temperature in temperature field. The regulating voltage mode of double-direction Bi-directional thyristors is used for controlling temperature. The system consists of the console and the resistance stove,and the console includes software platform and hardware platform. In this system, The method of grouping the resistance wire of resistance stove according to the power is put forward, and the performance of resistance stove is improved based on this method. The measuring precision is improved by using the minimum two-multiplication to calibrate the error. At present, the system has been practically applied in manufacture, which has gained obvious economy benefit and will be widely applied in the future.1. IntroductionThe temperature relay is one of common relays, which takes action when the outside temperature arrives at the given temperature. The temperature relay performs lots of functions, such as temperature control, fire alarm, automatic ignition, wiring heat-protection, so it is widely used in scientific research, industry and defense industry etc. For temperature relay, it is very important to measure its temperatures for action and reversion. But in the current manufacture, the manual measuring methods, such as spot-check method, mercuric thermometer method etc, dominate the measuring methods. However there are some inescapable short comings in these methods, such as low efficiency, large labor intensity and bad precision etc. Thus measurement has become the bottleneck of the quality of temperature relay. With theperpetual progress in the technology, the need for product quality gets more and more strict and the degree in manufacture automatization gets more and more deep. For temperature relay, today the manual measuring methods have become unfitted for the need for manufacture and will be necessarily replaced by the automatic measuring methods. In this paper, an automatic measuring system based on atmospherical measurement is discussed, which is very simple and precise in practical application.2. Measuring principieTwo kinds of metals whose inflated coefficient make a great deal of difference are hard composed together, and then the dishing twin-sheet metal comes into being.When the temperature relay arrives at a certain given value, one upward curving force will come into being in twin-sheet metal as a result of big expanding for nether metal and small expanding for upper metal. When the twin-sheet metal bends at a certain extent, it will drive the electric contact and switch on or switch off the circuit. When the temperature relay reduces at a certain given value, the twin-sheet metal gradually involutes. When the twin-sheet metal resumes at a certain extent, it will 3rd International Symposium on Instrumentation Science and Technology Aug. 18~22, 2004, Xi’an. China drive the electric contact in inverse direction and switch on or switch off the circuit. The working principle of dishing twin-sheet metal is described as Fig1:1-the initiatory state(room temperature), 2-the state after heated or cooled, 3-displacement.The temperature relay takes action due to the rising of ambience temperature or the heating of passing current.The resistance of relay is very small. So compared with the temperature rising caused by ambience temperature, the temperature rising caused by current heating also is very small and can be ignored. Thus measuring temperatures for action and reversion is implemented by controlling the environment temperature. There are three methods for measuring temperatures for action and reversion, which are liquid measurement, atmospherical measurement and testing-block measurement in GJB1517-92<Total criterion for constant temperature relay>.[1] Liquid MeasurementIn the constant temperature trough whose temperature can be intercalated, the medium that is water or oil is equably churned up. The measuring method is that the product is placed in the constant temperature trough heated or cooled. Because the liquid is equably churned up, the even temperature, good and the temperature precision is fairly high in which the temperature error is the temperature fluctuating degree is ±0.3℃. Thus the heating coherence of the products that are placed in different position in the constant temperature trough is very good, the measuring precision is very high and the parameter-repeating quality is all right. But this method is just applied in sealed temperature relay and the oil can stain the product. So few manufacturer adopts the method. Only the disputed appears and precise measurement is needed, the method is adopted.[2] Atmospherical MeasurementThe electrical oven whose temperature can be intercalated equably churns up the atmosphere. The measuring method is that the product is placed in the electrical oven heated or cooled. In the temperature field, the even temperature that is ±2℃and the temperature precision in which the temperature error is ±2℃and the temperature fluctuating degree is ±1.5℃are both not good. The heating coherence of the products that are placed in different position in the electrical oven, the measuring precision and the parameter-repeating quality apparently are not as much as liquid measurement. But the method is widely adopted because of simpleness,few pollution and batch.[3] Testing-block MeasurementA coppery block with a thermometer whose diameter isφ60~φ90mm and whose thickness is 20~30mm and a set of heating or cooling device make up of the measuring system.The measuring method is that in the room temperature the product is tightly placed on the surface of testing-block that is placed on the heating or cooling device whose temperature can be adjusted, and the temperature characteristic of the product is determined by measuring the temperature of the testing-block. Adjusting temperature of the testing-block is very hard because of measured in the room temperature, thus only a few product can be measured each time and the method unfitsfor volume-produce. But because of its simpleness, it fits for a small quantity of produce.Generally speaking, if the product is sealed and isn’t stained by oil, liquid measurement is adopted; if the product is placed in the heating or sealed body, atmospherical measurement is adopted; if the product is placed on the surface of the controlled object in room temperature, testing-block measurement is adopted. In this system, atmospherical measurement is adopted.In atmospherical measurement, the electrical oven is used for simulating the environmental temperature around the temperature relay. So for accomplishing measurement and enhancing precision, it is crucial to design a favorable temperature field. In this system, the resistance stove is designed for simulating temperature field. The performance of the temperature field is greatly improved by the even temperature and by the algorithm for controlling temperature.Because the temperature field takes atmosphere as the diathermanous medium, heat convection has a great effect on the distribution of the temperature field. In course of measuring, the fan is used for strengthening heat convection. But because of heat radiation in the testing room and obstruction from the diathermanous board onthe clamp that doesn’t make heated atmosphere swimmingly cycle, the temperature field degressively distributes by height in the vertical, and the temperature grads field comes into being. Thus the temperature asymmetry is inevitable. In this system, two methods are used for improving the even temperature. One is that by long-time warm-up atmosphere in testing room is adequately heated and the temperature grads is reduced.The other is that the orifice-board for making airflow equably flow is placed in testing room, thereby the temperature stability in the section of the measuring point is effectively ensured.In the light of academic analysis and repeating experimentation, the perfect controlling temperature curve of the temperature field is described as Fig 2:TB-the demarcated temperature for action , the parameter which express the decentralization of the temperature for action. Firstly the temperature high-rate rises. When the temperature arrives at the range of the temperature for action, the temperature rises bythe slower rate K2 and the temperature for action is measured. When the temperature arrives at the upper limit of the temperature for action, the temperature falls by the slower rate K3 and the temperature is measured. For the resistance stove, lag, inertia and nonlinear are bad and the parameter changes with time. Thus according to the enactment controlling temperature curve, the algorithm of fuzzy control is used to control the temperature in temperature field. So the model of the controlled object can be avoided identifying and Robust is excellent. The regulating voltage mode of double-direction Bi-directional thyristors is used for controlling temperature. Firstly the value and error of the temperature are fuzzied, and then the fuzzy rule from repeating experimentation does fuzzy illation, then through the barycenter method fuzzy estimate calculates the accurate value, at last after D/A transform the accurate value controls the Bi-directional thyristors by regulating voltage, so temperature risingOr falling of the resistance stove can be controlled.3. Automatic measuring systemAutomatically controlled by the computer, the temperature of the resistance stove reposefully rises from the lower limit of the temperature for action. When the relay takes action, the temperature for action is displayed and the arraignment appears, then the computer automatically controls the temperature reposefully falling. When the relay reverts, the temperature for reversion is also displayed and the arraignment appears, thereby an integrated measuring process ends.Based on Windows2000 operating system, the software developed by Microsoft Visual Basic 6.0 makes up of measuring module, user interface and database of measuring result. As control core of the measuring system, the measuring module automatically controls temperature rising or falling of the resistance stove, real-time acquires the temperature signal and the switch signal of the temperature relay, measures and records temperatures for action and reversion, alarms beyond the temperature range etc. The user interface consists of command button and menu, real-time temperature curve and the windows that real-time display measuring state and real-time modify parameters, which offers the user a friendly man-machineinterface. forms for the future analysis and estimate. Thus the database of measuring result is created, which effectively performs the functions of data backup and printing recordation. Furthermore, some accessorial programs are designed, such as hardware exception handles, real-time modify parameters program, upgrade program etc, which effectively enhance reliability and maintainability of the system.In this system, two methods are adopted aiming at some technical difficulty in measuring process, which obviously enhance the holistic quality.[1] The method of grouping the resistance wire of resistance stove according to the powerThe three-phase SSR electric power regulator indirectly regulates heating power through regulating switching on and off time of the resistance wire, thereby controls temperature rising or falling of the resistance stove. But the regulative extent of high-power stove wire is so wide that it is very difficult to accurately control the rate of rising or falling. For enhancing regulative sensitivity, lower-power stove wire should be adopted. However because the system comes down to more than twenty products and the measuring upper limit arrives at 600, the low-power stove wire cannot heat to such a high temperature. Facing to this problem, the method ofgrouping the resistance wire of resistance stove according to the power is put forward, which is that the low-power stove wire is applied in low temperature and the high-power stove wire is applied in high temperature. It is practically proved that the method effectively solves above problem and improves the quality of resistance stove.[2] The holistic minimum two-multiplication to calibrate the errorIn this system, the holistic minimum two-multiplication to calibrate the error is adopted. Firstly the current temperature at measuring point is mensurated by the high-precision temperature sensor, at the same time the current value output to computer is gained, and then a set of such data is mensurated in the temperature range.coefficients of the minimum two-multiplication multinomial are gained. At last when the coefficients are input nto program, the fitting of temperature cure is accomplished and the holistic system error is calibrated.4. ConclusionThe automatic measuring system used for temperature relay has been checked and accepted. The critical result is shown as follows. Thus it can be seen that the system has gained obvious economy benefit and will be widely applied in the future. References[1]HU Hong-bin. Measuring for temperature characteristic of temperature relay.Electro Mechanical element, 2003,(9):46-48[2]SUN Kai. Controlling temperature system of resistance stove. Sensor Technology,2003,22(2): 50-52[3]ZHONG Guo-min, WANG Gai-ming. A system used for controlling temperature.Automatization transaction, 1993,19(2):223-226[4]CHEN Hua, FU Li-hua.Application of controlling temperature using fuzzy controltheory. Journal of Liaoning university, 1995,22(1):34-38[5]LI Xian-ming.Research for automatic measuring system of temperature relay.Electron andAutomatization, 1997(3):24-27。
温湿度 外文翻译

本科生毕业设计(论文)外文翻译外文翻译题目:SHT11/71传感器的温湿度测量学院:信息科学与工程学院专业班级:测控技术与仪器0701班学生姓名:张颢德指导教师:杨理践2011年3月25日SHT11/71传感器的温湿度测量Assist.Prof.Grish Spasov,PhD,BSc Nikolay KakanakovDepartment of Computer Systems,Technical University-branch Plovdiv,25,”Tzanko Djustabanov”Str.,4000Plovdiv,Bulgaria,+35932659576, E-mail:gvs@tu-plovdiv.bg,kakanak@tu-plovdiv.bg 关键词:温湿度测量,智能传感器,分布式自动测控这篇论文阐述了智能传感器的优点,介绍了SHT11/71温湿度传感器(产自盛世瑞公司)。
该传感器是一种理想的对嵌入式系统提供环境测量参数的传感器。
常规的应用时将SHT11/71放于实际的工作环境当中。
应用于分布式的温湿度监测系统。
使用单片机与集成网络服务器来实现对传感器的信息交流与关系。
这个应用是可实现与测试的。
1.介绍温湿度的测量控制对于电器在工业、科学、医疗保健、农业和工艺控制过程都有着显著地意义。
温湿度这两种环境参数互相影响,因为这至关重要的一点,在一些应用中他们是必须并联测量的。
SHT11/71是利用现代技术把温度、湿度测量元件、放大器、A/D转换器、数字接口、校验CRC计算逻辑记忆模块和核心芯片集成到一个非常小的尺寸上[1][3]。
采用这种智能传感器可以缩短产品开发时间和成本。
整合入传感器模数转换和放大器的芯片使开发人员能够优化传感器精度和长期问的的元素。
并不是全结合形式的数字逻辑接口连通性管理的传感器。
这些优点可以减少整体上市时间,甚至价格[1][3]。
本文以SHT11/71(产自盛世瑞公司)智能传感器为例,介绍他的优势和测量程序给出一个实用实例来说明该工作的实现条件。
无线测温外文翻译
化工学院信息与控制工程学院毕业设计外文翻译粮食仓储无线测温系统的设计Design of wireless temperature measurement systemfor grain storage学生学号:10540108学生:王宪忠专业班级:测控1001指导教师:艾学忠职称:教授起止日期:2014.2.25~2014.3.16吉林化工学院Jilin Institute of Chemical Technology激光切割工艺中无线温度采集系统的设计摘要本文提出了一种先进的工程材料的激光切割加工的无线温度采集系统的开发。
该无线系统可以有效的进行自动温度监测。
该系统包括硬件,软件,和一台计算机。
该无线系统的包括电源子系统,传感器子系统,和一个主要基于无线射频(RF)技术的主节点系统。
该系统的优点是简单的数据管理温度报警和所需文件的准确性。
该集成无线温度传感器的有用性是在马来西亚理科大学机械工程学院制造实验室进行测试的。
在实验室收集的数据用来评估该系统的实用性。
数据表明,该系统可以测量和监测在硬顶的的时间和距离的围的温度。
这项工作是使用无线网络系统监控激光切削过程(WSN)温度的一个重要的开始。
关键词:温度监测;无线传感器;激光切割;过程监控1 简介该过程监控系统具有避免意外故障的优点,大大提高了系统的可靠性和可维护性。
其获取更大的工艺参数也给出了更好的可视性和更好的决策权。
这些系统通常与数据采集系统使用传感器测量相关的参数。
传感器测得的数据通过有线通信传输给处理系统。
然而,这些系统可以是非常昂贵和不灵活的。
随着通信技术的发展,数据已经可以通过无线方式来传输。
目前,无线技术,特别是无线传感器网络综合了传感器技术,MEMS 技术,无线通信技术,嵌入式计算技术、分布式信息管理技术,得到了迅速的发展。
无线传输的重要优势就是简化了系统的布线和管理。
否则,在一些危险,或者偏远的区域和地点不可能实现传感器的应用。
数字温度传感器毕业论文中英文资料外文翻译文献[管理资料]
![数字温度传感器毕业论文中英文资料外文翻译文献[管理资料]](https://img.taocdn.com/s3/m/6bf8f73450e2524de4187ed1.png)
毕业论文中英文资料外文翻译文献外文资料DS1722 Digital ThermometerWith scientific and technological progress and development of the types of temperature sensors increasingly wide range of application of the increasingly widespread, and the beginning analog toward digital, single-bus, dual-bus and bus-3 direction. And the number of temperature sensors because they apply to all microprocessor interface consisting of automatic temperature control system simulation can be overcome sensor and microprocessor interface need signal conditioning circuit and A / D converters advant ages of the drawbacks, has been widely used in industrial control, electronic transducers, medical equipment and other temperature control system. Among them, which are more representative of a digital temperature sensor DS18B20, MAX6575, the DS1722, MAX6636 other. This paper introduces the DS1722 digital temperature sensor characteristics, the use of the method and its timing. Internal structure and other relevant content.FEATURES:Temperature measurements require no external components;Measures temperatures from -55°C to +120°C. Fahrenheit equivalent is -67°F to +248°F;Thermometer accuracy is ±°C;Thermometer resolution is configurable from 8 to 12 bits (°C to °C resolution);Data is read from/written to via a Motorola Serial Peripheral Interface (SPI) or standard 3-wire serial interface;Wide analog power supply range ( - );Separate digital supply allows for logic;Available in an 8-pin SOIC (150 mil), 8-pin USOP, and flip chip package;PIN ASSIGNMENTFIGURE 1 PIN ASSIGNMENTPIN DESCRIPTION:SERMODE - Serial Interface Mode.CE - Chip Enable.SCLK - Serial Clock.GND – Ground.VDDA - Analog Supply Voltage.SDO - Serial Data Out.SDI - Serial Data In.VDDD - Digital Supply Voltage.DESCRIPTION:The DS1722 Digital Thermometer and Thermostat with SPI/3-Wire Interface provides temperature readings which indicate the temperature of the device. No additional components are required; the device is truly a temperature-to-digital converter. Temperature readings are communicated from the DS1722 over a Motorola SPI interface or a standard 3-wire serial interface. The choice of interface standard is selectable by the user. For applications that require greater temperature resolution, the user can adjust the readout resolution from 8 to 12 bits. This is particularly useful in applications where thermal runaway conditions must be detected quickly.For application flexibility, the DS1722 features a wide analog supply rail of - . A separate digital supply allows a range of to . The DS1722 is available in an 8-pin SOIC (150-mil), 8-pin USOP, and flip chip package.Applications for the DS1722 include personal computers/servers/workstations, cellular telephones, office equipment, or any thermally-sensitive system.OVERVIEW:A block diagram of the DS1722 is shown in Figure 2. The DS1722 consists offour major components:1. Precision temperature sensor.2. Analog-to-digital converter.3. SPI/3-wire interface electronics.4. Data registers.The factory-calibrated temperature sensor requires no external components. The DS1722 is in a power conserving shutdown state upon power-up. After power-up, the user may alter the configuration register to place the device in a continuous temperature conversion mode or in a one-shot conversion mode. In the continuous conversion mode, the DS1722 continuously converts the temperature and stores the result in the temperature register. As conversions are performed in the background, reading the temperature register does not affect the conversion in progress. In the one-shot temperature conversion mode, the DS1722 will perform one temperature conversion, store the result in the temperature register, and then eturn to the shutdown state. This conversion mode is ideal for power sensitive applications. More information on the configuration register is contained in the “OPERATION-Programming”section. The temperature conversion results will have a default resolution of 9 bits. In applications where small incremental temperature changes are critical, the user can change the conversion resolution from 9 bits to 8, 10, 11, or 12. This is accomplished by programming the configuration register. Each additional bit of resolution approximately doubles the conversion time. The DS1722 can communicate using either a Motorola Serial Peripheral Interface (SPI) or standard 3-wire interface. The user can select either communication standard through the SERMODE pin, tying it to VDDD for SPI and to ground for 3-wire. The device contains both an analog supply voltage and a digital supply voltage (VDDA and VDDD, respectively). The analog supply powers the device for operation while the digital supply provides the top rails for the digital inputs and outputs. The DS1722 was designed to be Logic-Ready.DS1722 FUNCTIONAL BLOCK DIAGRAM Figure 2OPERATION-Measuring Temperature:The core of DS1722 functionality is its direct-to-digital temperature sensor. The DS1722 measures temperature through the use of an on-chip temperature measurement technique with an operating range from -55°to +120°C. The device powers up in a power-conserving shutdown mode. After power-up, the DS1722 may be placed in a continuous conversion mode or in a one-shot conversion mode. In the continuous conversion mode, the device continuously computes the temperature and stores the most recent result in the temperature register at addresses 01h (LSB) and 02h (MSB). In the one-shot conversion mode, the DS1722 performs one temperature conversion and then returns to the shutdown mode, storing temperature in the temperature register. Details on how to change the setting after power up are contained in the “OPERATION-Programming”section. The resolution of the temperature conversion is configurable (8, 9, 10, 11, or 12 bits), with 9-bit readings the default state. This equates to a temperature resolution of °C, °C, °C, °C, or °C. Following each conversion, thermal data is stored in the thermometer register in two’s complement format; the information can be retrieved over the SPI or 3-wire interface with the address set to the temperature register, 01h (LSB) and then 02h (MSB). Table 2 describesthe exact relationship of output data to measured temperature. The table assumes the DS1722 is configured for 12-bit resolution; if the evince is configured in a lower resolution mode, those bits will contain 0s. The data is transmitted serially over the digital interface, MSB first for SPI communication and LSB first for 3-wire communication. The MSB of the temperature register contains the “sign” (S) bit, denoting whether the temperature is positive or negative. For Fahrenheit usage, a lookup table or conversion routine must be used.AddressLocation S 2625242322212002h MSB (unit = ℃) LSB2-12-22-32-40 0 0 0 01hTEMPERATURE DIGITAL OUTPUT(BINARY) DIGITAL OUTPUT(HEX)+120℃0111 1000 0000 0000 7800h+ 0001 1001 0001 0000 1910h+ 0000 1010 0010 0000 0a20h+ 0000 0000 1000 0000 0080h0 0000 0000 0000 0000 0000h1111 1111 1000 0000 Ff80h1111 0101 1110 0000 F5e0h1110 0110 1111 0000 E6f0h-55 1100 1001 0000 0000 C900h OPERATION-Programming:The area of interest in programming the DS1722 is the Configuration register. All programming is done via the SPI or 3-wire communication interface by selecting the appropriate address of the desired register location. Table 3 illustrates the addresses for the two registers (configuration and temperature) of the DS1722.Register Address Structure Table 3CONFIGURATION REGISTER PROGRAMMING:The configuration register is accessed in the DS1722 with the 00h address for reads and the 80h address for writes. Data is read from or written to the configuration register MSB first for SPI communication and LSB first for 3-wire communication. The format of the register is illustrated in Figure 2. The effect each bit has on DS1722 functionality is described below along with the power-up state of the bit. The entire register is volatile, and thus it will power-up in the default state.CONFIGURATION/STATUS REGISTER Figure 21SHOT = One-shot temperature conversion bit. If the SD bit is "1", (continuous temperature conversions are not taking place), a "1" written to the 1SHOT bit will cause the DS1722 to perform one temperature conversion and store the results in the temperature register at addresses 01h (LSB) and 02h (MSB). The bit will clear itself to "0" upon completion of the temperature conversion. The user has read/write access to the 1SHOT bit, although writes to this bit will be ignored if the SD bit is a "0", (continuous conversion mode). The power-up default of the one-shot bit is "0".R0, R1, R2 = Thermometer resolution bits. Table 4 below defines the resolution of the digital thermometer, based on the settings of these 3 bits. There is a direct tradeoff between resolution and conversion time, as depicted in the AC Electrical Characteristics. The user has read/write access to the R2, R1 and R0 bits and the power-up default state is R2="0", R1="0", and R0="1" (9-bit conversions).THERMOMETER RESOLUTION CONFIGURATION Table 4SD = Shutdown bit. If SD is "0", the DS1722 will continuously perform temperature conversions and store the last completed result in the temperature register. If SD is changed to a "1", the conversion in progress will be completed and stored and then the device will revert to a low-power shutdown mode. The communication port remains active. The user has read/write access to the SD bit and the power-up default is "1" (shutdown mode).SERIAL INTERFACE:The DS1722 offers the flexibility to choose between two serial interface modes. The DS1722 can communicate with the SPI interface or with a standard 3-wire interface. The interface method used is determined by the SERMODE pin. When this pin is connected to VDDD SPI communication is selected. When this pin is connected to ground, standard 3-wire communication is selected.SERIAL PERIPHERAL INTERFACE (SPI):The serial peripheral interface (SPI) is a synchronous bus for address and data transfer. The SPI mode of serial communication is selected by tying the SERMODE pin to VDDD. Four pins are used for the SPI. The four pins are the SDO (Serial Data Out), SDI (Serial Data In), CE (Chip Enable), and SCLK (Serial Clock). The DS1722 is the slave device in an SPI application, with the microcontroller being the master. The SDI and SDO pins are the serial data input and output pins for the DS1722, respectively. The CE input is used to initiate and terminate a data transfer. The SCLK pin is used to synchronize data movement between the master (microcontroller) and the slave (DS1722) devices. The shift clock (SCLK), which is generated by the microcontroller, is active only when CE is high and during address and data transfer to any device on the SPI bus. The inactive clock polarity is programmable in somemicrocontrollers. The DS1722 offers an important feature in that the level of the inactive clock is determined by sampling SCLK when CE becomes active. Therefore, either SCLK polarity can be accommodated. There is one clock for each bit transferred. Address and data bits are transferred in groups of eight, MSB first.3-WIRE SERIAL DATA BUS:The 3-wire communication mode operates similar to the SPI mode. However, in 3-wire mode, there is one bi-directional I/O instead of separate data in and data out signals. The 3-wire consists of the I/O (SDI and SDO pins tied together), CE, and SCLK pins. In 3-wire mode, each byte is shifted in LSB first unlike SPI mode where each byte is shifted in MSB first. As is the case with the SPI mode, an address byte is written to the device followed by a single data byte or multiple data bytes.外文资料译文DS1722数字温度传感器随着科学技术的不断进步和发展,温度传感器的种类日益繁多,应用逐渐广泛,并且开始由模拟式向着数字式、单总线式、双总线式和三总线式发展。
单片机温度探测系统中英文对照外文翻译文献

中英文对照翻译附件1:外文资料翻译译文一种基于DS18B20的温度探测系统摘要所有的DS18B20传感器,用于多点温度测试,IO总线与MCU连接,温度数据的轮流收集。
如果系统有大量的传感器,MCU的时间用在处理温度数据明显延长,因此周期替代测试变得更长。
在本文中,一种新的方法,DS18B20的合理组合和一些在软件上采取的措施,替代试验进展速度明显。
关键词:DS18B20的集团,温度测试,轮流测试所花费的时间。
引言由于结构简单,安装方便,低损失和广泛的用途的温度测试,DS18B20温度测试传感器应用领域,需要多点温度测试,如化学工业,粮食,环境监督管理等。
因为通过一个DS18B20的多点温度测试系统总线,所有DS18B20是挂在一条总线上,然后每个温度测试点的值转换轮流读。
作为转换后读值必须阅读8次引脚的状态,移动时间,位置和存储数据,所以时间多花费在阅读每一个点的数据系统时间。
如果温度测试系统是大型系统由它造成的损失是相当多的,然后交替测试系统的运行速度明显降低,从而影响多点温度测试系统的效率。
在本文中,DS18B20的一些I / O总线上都挂着分组DS18B20的均匀,温度转换获取数据读取DS18B20的状态,系统损耗减少和替代测试速度增加显然,这将不会影响精度和转换的可靠性。
一套点对多点温度,在此实现人工环境实验室测试,这增加了测试效率。
作者对DS18B20的认识DS18B20是单总线数字温度传感器来自美国达拉斯公司。
DS18B20是由64数字光盘刻激光,温度敏感性组成部分,非易失性温度报警触发器(设备TH和TL)。
DS18B20的通信微处理器单总线端口和测试范围DS18B20是从-55摄氏度到+125摄氏度,增量值是0.5摄氏度。
温度可在720ms的数字改为每个DS18B20具有唯一的64数字序号。
图1揭示的具体内容:两个8的数字储量(0号和1号),用于存储在DS18B20的温度值。
0号存储存储器温度值,补充和一号存储器温度值的符号。
多通道温度测量仪的外文和翻译
Measuring Temperature of NICU Patients - A Comparison ofThree DevicesHelen Marie Rosenthal, Andrew LeslieAbstractBackground:The provision of a thermoneutral environment is a corner-tone of neonatal care. An accurate method of temperature measurement is required in order that neonatal nurses can provide this care. Glass mercury thermometers, now rarely used in the developed world were once the gold standard. They have mainly been replaced by many different types of modern thermometers.Methods:This study aims to compare the accuracy and user-acceptability of one electronic and one infrared thermometer (Lightouch Neonate, Exergen Corp,USA; Suretemp 678, Welch Allyn, Beaverton, USA) with traditional glass mercury thermometry for intermittent temperature measurement on the NICU, using the axilla as the measuring site.Results: The results demonstrate a generally positive performance of the two de-vices tested. The mean (SD) difference between the readings from the Suretemp thermometer and the glass mercury thermometer was 0.1 (±0.25)℃.The mean difference between the readings from the Lightouch thermometer and the glass mercury thermometer is 0.07 ℃.IntroductionMaintaining the thermoneutral environment for sick and premature newborn infants is a key part of the nurse's role on the NICU, as abnormal temperature is strongly associated with adverse outcome (Bailey and Rose, 2000; CESDI, 2003;Silverman et al., 1958; WHO, 1997). Obtaining accurate measurement of temperature is an obligatory step in providing thermoneutrality. Temperature of NICU patients may be measured in a variety of sites, including rectum and axilla,and using a number of different tools, including glass mercury thermometers and electronic devices, which may in turn checktemperature continuously, or as one-off readings.Mercury thermometry is now used rarely in the developed world, except as a comparison for evaluating new devices, as in this study. This is largely due to concerns about the hazards associated with mercury. Mercury emits a toxic vapour that can be inhaled or absorbed directly through the skin. This vapour may persist for months or years (Blumenthal,1992). Very premature neonates with their increased skin permeability are a high-risk group for absorbing mercury vapour, especially as the warm environment required for their care facilitates mercury vapourisation (DoH, 1985). While mercury thermometers have been regarded as the gold standard for measurement of body temperature (Blumenthal, 1992; Pontious et al., 1994;Sheeran, 1996), numerous studies identify their inaccuracies (Abbey et al., 1978; Blumenthal,1992; Leick-Rude and Bloom, 1998). Johnston and Shorten (1991) tested 48 mercury thermometers against a calibrated water bath, finding only five recording the same temperature. The remaining thermometers varied by as much as 0.8℃.In place of mercury thermometry, a profusion of devices for spot-check measurement have become available. These utilise electronic, infrared or chemical technology, for use in the tympanic membrane, axilla or rectum. In addition to providing spot-check measurements, some thermometers may be used in either monitoring or predictive modes. Monitoring mode gives a continuous readout, while predictive mode uses an algorithm to predict temperature based on rate of rise after probe introduction.A number of these devices have been studied previously (Davis, 1993; Greenall et al., 1997; Johnson et al., 1991; Leick-Rude and Bloom, 1998;Ogren, 1990; Pontious et al., 1994; Rogers et al.,1991). Weiss and Richards (1994) studied 142 preterm and term infants. Using a single instrument (IV AC 2080) they measured temperature using different modes and in different sites in the same baby. They found statistically significant differences between measurements obtained in the axilla in predictive and monitoring modes, but concluded that the differences seen (0.1-0.2℃)were not clinically significant. Seguin and Terry (1999) compared axillary temperatures obtained in 28 term and preterm infants using the Lightouch device (Exergen Corp, USA) inpredictive mode with rectal temperature. They found preterm infants in incubators had the least difference between the two readings, mean (SD) 0.09 (0.16)℃. They concluded this was clinically acceptable.The rectum is now rarely used as a temperature measuring site. The utility of the axilla as the measuring site, compared to the rectum, was assessed by Jirapaet and Jirapaet (2000). They measured the temperature of 109 preterm and term infants simultaneously using four different methods. When they compared rectal and axillary temperature measured using mercury thermometry they found a mean (95% CI) difference of 0.06(0.03-0.09)℃and concluded that axillary temperature can be as accurate as rectal.This study compares the accuracy and user-acceptability of one electronic and one infrared thermometer (Lightouch Neonate, Exergen Corp,USA; Suretemp 678, Welch Allyn, Beaverton, USA)with traditional glass mercury thermometry for intermittent temperature measurement on the NICU, using the axilla as the measuring site.The Lightouch thermometer uses an optical device with a cup shaped probe,which detects infrared emissions from the surface of the skin. As there is no temperature device to heat up, it takes less than 1 s to produce a reading. The Suretemp 678 is an electronic thermistor thermometer, which takes 10 s to display a final reading in predictive mode. The trial aim was to determine whether the Lightouch Neonate infrared thermometer or the Suretemp electronic thermometer set to predictive mode, would be accurate alternatives when compared to glass mercury thermometers.MethodsA convenience sample consisting of the population resident on a large regional NICU, during a three-week trial period, was used to obtain the two separate data sets. These included babies requiring intensive care, high dependency care and low dependency care. The patient population consisted of term and preterm infants with a variety of medical and surgical conditions.Readings were obtained at the same time, using glass mercury thermometry and one of the two trial devices. Temperature readings were taken as clinically indicated and allinfants present on any area of the NICU were eligible for inclusion.Guidelines were developed so that the same method of temperature measurement would be undertaken by individual nurses, ensuring comparable sets of data would be produced, which differed only by which trial thermometer was used.The mercury thermometer was held in place for five minutes, as recommended by Bliss-Holtz (1995). The Suretemp thermometer was set to the predictive mode. Either the Suretemp or the Lightouch was placed on the infant until a reading was obtained. The two readings were then recorded on a trial data sheet.Statistical analyses were produced using the SPSS statistical program. The Bland and Altman (1986) approach for comparing two measurement devices was utilised for individual comparison of each of the trial thermometers with the glass mercury thermometer. This method of statistical analysis allows comparison of new measurement techniques with established ones to see whether they agree sufficiently for the new to replace the old.Comparison of the readings from each trial thermometer with their respective paired glass mercury axillary readings was accomplished by calculating limits of agreement, within which 95%±2 standard deviations (SD) of individual differences would fall.Scatter plots were used to display differences in readings for each thermometer. Glass mercury readings minus trial thermometer reading were plotted on the y-axis and the average of the two readings on the x-axis. A line indicating the level of the mean difference between the readings assists visualisation of the differences between individual readings around the mean. Additional lines indicate±2 SD above and below the mean (see Figs. 1 and 2).If the differences are normally distributed, 95% of the differences should lie between ±2 SD of the mean difference (Bland and Altman, 1986;Leick-Rude and Bloom, 1998).Leick-Rude and Bloom (1998)identify that 95% limits of agreement can represent a large range of differences for some instruments. Clinically,this could have marked implications, as temperature is often a criterion for deciding whether an infant's thermal environment needs adjusting, or whether they require a septic screen. Thus the percentage of readings for each instrument that was within ±0.2℃,±0.5℃and ±1℃of the glass mercury reading was also calculated, as in the study by Leick-Rude and Bloom (1998).The Pearson product moment correlation co-efficient was also calculated. This measures the strength of a relation between 2 variables. A value of 1 shows perfect positive correlation (Bland and Altman, 1986).Figure 1Suretemp thermometer vs. glass mercury thermometer. Bland-Altman plot. A line indicating the level of the mean difference between the readings allows visualisation of scatter around the mean. Additional lines indicate 2 SD above and below the mean.Figure 2Lightouch thermometer vs. glass mercury thermometer. Bland-Altman plot.A line indicating the level of the mean difference between the readings allows visualisation of scatter around the mean. Additional lines indicate ±2 SD above and below the mean.ResultsThirty-four infants provided 102 paired readings between the infant’s own glass mercury thermometer and the Suretemp electronic thermometer.Ninety-seven sets of data were used during the statistical analysis. Five sets of data could not be used either because they were incomplete or because the correct length of time had not been usedfor temperature measurement with the glass mercury thermometer.Thirty-nine infants provided 101 paired readings between the Lightouch infrared thermometer and glass mercury thermometer. Ninety-two sets of data were used during the statistical analysis. Nine sets of data could not be used either because they were poorly recorded or because the correct length of time had not been used for the glass mercury thermometer reading.Characteristics of the two groups of infants are given in Table 1.Suretemp electronic thermometerNinety-seven paired readings for the Suretemp and glass mercury thermometers were analysed. The readings with the glass mercury thermometer were mean (range) 36.9 (35.5-38.2)℃and the readings with the Suretemp were mean (range) 37 (35.3-38.5)℃. Thus the mean (SD) difference between the readings from the Suretemp thermometerand the glass mercury thermometer is 0.1(±0.25)℃(on average theSuretemp read0.1℃higher than the glass mercury thermometer). The limits of agreement between the Sure-temp electronic thermometer and the glass mercury thermometer show that 95% of the Sure-temp readings were 0.56℃above or 0.35℃below the glass mercury reading). These data are shown in Fig. 1. The Pearson product-moment correlation coefficient was R =0.88. The percentage of SureTemp measurements within ±0.1℃,±0.2℃,±0.5℃and ±1.0℃of the glass mercury reading are presented in Table 2.Lightouch infrared thermometerNinety-two paired readings for the Lightouch and glass mercury thermometers were analysed.The readings with the glass mercury thermometer were mean (range) 36.9 (36-37.6)℃and the readings with Lightouch were mean (range) 36.8(35.8-37.7)℃. Thus the mean difference between the readings from the Lightouch thermometer and the glass mercury thermometer is 0.07℃(i.e. on average the Lightouch read 0.07℃lower than the mercury thermometer).The limits of agreement between the Lightouch and glass mercury thermometer readings show that 95% of Lightouch readings were 0.38℃above or 0.52℃below the glass mercury thermometer reading. These data are shown in Fig. 2. The Pear-son product-moment co-efficient was R=0.83. The percentage of Lightouch measurements within ±0.1℃, ±0.2℃, ±0.5℃and ±1.0℃of the glass mercury reading are presented in Table 2.DiscussionStudying temperature poses some particular problems. A gold-standard method for obtaining a temperature reading, against which new devices could be compared, has not been established. While thermometry with a glass mercury device is often used as the control measurement, there are important limitations of this technique. Readings may vary with dwell time, positioning and device, and there are no universally agreed standards for these issues (Bliss-Holtz, 1995; Johnson et al.1991; Sheeran, 1996).This study also has some important limitations.It was a small study, with some infants having more than one data set included. While guidelines on obtaining measurements were given to the nursing staff, it was not possible to further standardise the conditionsunder which readings were obtained from any of the devices. This does also mean however that the results pragmatically reflect the readings obtained under standard NICU working conditions, rather than in a laboratory. A more definitive study could be undertaken on a larger scale and have a specific number of well prepared nurses to take temperature measurements, allowing inter-rater reliability to be assessed.This study addresses the question of the validity of the readings obtained from one infrared and one electronic measuring device when compared to glass mercury thermometry. Ninety-three percent of readings obtained by the Suretemp thermometer, and almost 96% of readings obtained using the Lightouch were within 0.5℃of the paired glass mercury reading. The results demonstrate good positive correlations, but slightly wider than idea limits of agreement.A questionnaire on the thermometers was completed by staff as an adjunct to the study. This highlighted a substantial variability in the time allowed for a temperature reading to register on glass mercury thermometers during normal daily practice on the unit, with possible impact on their accuracy. This variability was controlled for in the study, with staff using 5 min for each glass mercury thermometer reading. Both electronic devices had positive responses from staff, and when given the choice of using any of the thermometers, no-one opted for the glass mercury thermometer.Infection control is a further practical issue to be considered in device selection. There is concern that shared equipment like electronic thermometers may act as vectors for infection,despite the use of disposable probe covers(Rogers, 1992). If shared equipment is introduced there must also be agreed protocols for between-patient decontamination. As reliable and valid measurement of temperature is crucial for the delivery of neonatal nursing care it is perhaps surprising that the best method and site for obtaining temperature readings in newborn infants has not been definitively researched and agreed. The ideal measuring instrument would be accurate, non-invasive, deliver a rapid result and be simple to use and clean.Further work is required to deliver these important and achievable objectives.三种测量重症病房的新生儿温度的温度测量仪的比较海伦·玛丽·罗森塔尔,安德鲁·莱斯利摘要背景:提供的适宜的温度环境是新生儿护理的基础。
外文翻译--基于51单片机温度报警器的设计(适用于毕业论文外文翻译+中英文对照)

外文翻译--基于51单片机温度报警器的设计(适用于毕业论文外文翻译+中英文对照)XXX: Design of a Temperature Alarm Based on 51 MCUDepartment: n EngineeringMajor: Measurement and Control Technology and nClass:Student ID:Name:Supervisor:Date:A microcontroller。
also known as a single-chip computer system。
XXX its ns being integrated on a small chip。
it has most of the components needed for a complete computer system。
such as CPU。
memory。
internal and external bus systems。
and mostof them also have external storage。
At the same time。
it integrates XXX interfaces。
timers。
real-time clocks。
etc。
The most XXX integrate sound。
image。
ork。
and complex input-output systems on a single chip.XXX used in the industrial control field。
Microcontrollers XXX CPUs inside the chip。
The original design concept was to integrate a large number of peripheral devices and CPUs on a chip to make the computer system XXX's Z80 was the first processor designed according to this concept。
外文翻译---一种基于DS18B20的温度探测系统

2012 届本科毕业设计(论文)外文文献翻译学院:物理与电子工程学院专业:电子科学与技术姓名:学号:外文出处:Changsha University of Science(用外文写)and Technology附件: 1.外文资料翻译译文;2.外文原文。
附件1:外文资料翻译译文一种基于DS18B20的温度探测系统摘要所有的DS18B20传感器,用于多点温度测试,IO总线与MCU连接,温度数据的轮流收集。
如果系统有大量的传感器,MCU的时间用在处理温度数据明显延长,因此周期替代测试变得更长。
在本文中,一种新的方法,DS18B20的合理组合和一些在软件上采取的措施,替代试验进展速度明显。
关键词:DS18B20的集团,温度测试,轮流测试所花费的时间。
引言由于结构简单,安装方便,低损失和广泛的用途的温度测试,DS18B20温度测试传感器应用领域,需要多点温度测试,如化学工业,粮食,环境监督管理等。
因为通过一个DS18B20的多点温度测试系统总线,所有DS18B20是挂在一条总线上,然后每个温度测试点的值转换轮流读。
作为转换后读值必须阅读8次引脚的状态,移动时间,位置和存储数据,所以时间多花费在阅读每一个点的数据系统时间。
如果温度测试系统是大型系统由它造成的损失是相当多的,然后交替测试系统的运行速度明显降低,从而影响多点温度测试系统的效率。
在本文中,DS18B20的一些I / O总线上都挂着分组DS18B20的均匀,温度转换获取数据读取DS18B20的状态,系统损耗减少和替代测试速度增加显然,这将不会影响精度和转换的可靠性。
一套点对多点温度,在此实现人工环境实验室测试,这增加了测试效率。
作者对DS18B20的认识DS18B20是单总线数字温度传感器来自美国达拉斯公司。
DS18B20是由64数字光盘刻激光,温度敏感性组成部分,非易失性温度报警触发器(设备TH和TL)。
DS18B20的通信微处理器单总线端口和测试范围DS18B20是从-55摄氏度到+125摄氏度,增量值是0.5摄氏度。
粮库温度检测报警系统--本科毕业生外文文献翻译

本科毕业生外文文献翻译学生姓名:指导教师:所在学院:信息技术学院专业:电气工程及其自动化中国·2012 年 5 月Based on SCM multi-functional temperaturetesting system designIntroductionWith the development of society and the technological progress, people pay more and more attention to the importance of temperature detection and display. Temperature detection and status display technology and equipment has been widely applied in industries, products on the market emerge in endlessly. Temperature testing and also gradually adopt the automatic control technology to realize the monitor. This topic is a temperature testing and status of the monitoring system.1 System solutionsThis system USES the monolithic integrated circuit AT89S52 as this system. The whole system, the hardware circuit including power supply circuit, sensor, the temperature display circuit circuit, upper alarm circuit . The alarming circuit can be measured in upper temperature range, screaming voice alarm. The basic principle for the temperature control DSl8B20: when the temperature signal acquisition to after temperature signal sent to handle, AT89S52 temperature to LCD screen, SCM according to initialize the upper temperature setting, namely, if the judgement of temperature than the highest temperature cooling fan is started, If the temperature is less than the lowest temperature setting on alarm device.2 The system hardware design2.1AT89C51 SCM are introducedThe AT89S52 is a low-power, high-performance CMOS 8-bit microcomputer with 4K bytes of Flash Programmable and Erasable Read Only Memory (PEROM) and 128 bytes RAM. The device is manufacture d using Atmel’s high density nonvolatile memory technology and is compatible with the industry standard MCS-51™ instruction set and pinout. The chip combines a versatile 8-bit CPU with Flash on a monolithic chip, the Atmel at89s52 is a powerful microcomputer which provides a highly flexible and cost effective solution to many embedded control applications.Pin Description:VCC Supply voltage.GND Ground.Port 0Port 0 is an 8-bit open drain bidirectional I/O port. As an output port each pin can sink eight TTL inputs. When is are written to port 0 pins, the pins can be used as high impedance inputs.Port 0 may also be configured to be the multiplexed loworder address/data bus during accesses toexternal program and data memory. In this mode P0 has internal pullups.Port 0 also receives the code bytes during Flash programming, and outputs the code bytes during program verification. External pullups are required during program verifica tion.Port 1Port 1 is an 8-bit bidirectional I/O port with internal pullups. The Port 1 output buffers cansink/source four TTL inputs. When 1s are written to Port 1 pins they are pulled high by the internal pullups and can be used as inputs. As inputs, Port 1 pins that are externally being pulled low will source current because of the internal pullups.Port 1 also receives the low-order address bytes during Flash programming and verification.Port 2Port 2 is an 8-bit bidirectional I/O port with internal pullups. The Port 2 output buffers cansink/source four TTL inputs. When 1s are written to Port 2 pins they are pulled high by the internal pullups and can be used as inputs. As inputs, Port 2 pins that are externally being pulled low will source current because of the internal pullups.Port 2 emits the high-order address byte during fetches from external program memory and during accesses to external data memory that use 16-bit addresses (MOVX @ DPTR). In this application it uses strong internal pull-ups when emitting 1s. During accesses to external data memory that use 8-bit addresses (MOVX @ RI), Port 2 emits the contents of the P2 Special Function Register.Port 2 also receives the high-order address bits and some control signals during Flash programming and verification.Port 3Port 3 is an 8-bit bidirectional I/O port with internal pullups. The Port 3 output buffers cansink/source four TTL inputs. When 1s are written to Port 3 pins they are pulled high by the internal pullups and can be used as inputs. As inputs, Port 3 pins that are externally being pulled low will source current because of the pullups.Port 3 also serves the functions of various special features of the at89s52 as listed below:Port pin alternate functionsP3.0 rxd (serial input port)P3.1 txd (serial output port)P3.2 ^int0 (external interrupt0)P3.3 ^int1 (external interrupt1)P3.4 t0 (timer0 external input)P3.5 t1 (timer1 external input)P3.6 ^WR (external data memory write strobe)P3.7 ^rd (external data memory read strobe)Port 3 also receives some control signals for Flash programming and verification.RSTReset input. A high on this pin for two machine cycles while the oscillator is running resets the device.ALE/PROGAddress Latch Enable output pulse for latching the low byte of the address during accesses toexternal memory. This pin is also the program pulse input (PROG) during Flash programming.In normal operation ALE is emitted at a constant rate of 1/6 the oscillator frequency, and may be used for external timing or clocking purposes. Note, however, that one ALE pulse is skipped during each access to external Data Memory.If desired, ALE operation can be disabled by setting bit 0 of SFR location 8EH. With the bit set, ALE is active only during a MOVX or MOVC instruction. Otherwise, the pin is weakly pulled high. Setting the ALE-disable bit has no effect if the microcontroller is in external execution mode.PSENProgram Store Enable is the read strobe to external program memory.When the at89s52 is executing code from external program memory, PSEN is activated twice each machine cycle, except that two PSEN activations are skipped during each access to external data memory.EA/VPPExternal Access Enable. EA must be strapped to GND in order to enable the device to fetch code from external program memory locations starting at 0000H up to FFFFH. Note, however, that if lock bit 1 is programmed, EA will be internally latched on reset.EA should be strapped to VCC for internal program executions.This pin also receives the 12-volt programming enable voltage(VPP) during Flash programming, for parts that require 12-volt VPP.XTAL1Input to the inverting oscillator amplifier and input to the internal clock operating circuit.XTAL2Output from the inverting oscillator amplifier.2.2 DS18B20 sensor2.2.1The introduction of DS18B20The DS18B20 Digital Thermometer provides 9 to 12-bit (configurable) temperature readings which indicate the temperature of the device. Information is sent to/from the DS18B20 over a 1-Wire interface, so that only one wire (and ground) needs to be connected from a central microprocessor to a DS18B20. Power for reading, writing, and performing temperature conversions can be derived from the data line itself with no need for an external power source. Because each DS18B20 contains a unique silicon serial number, multiple DS18B20s can exist on the same 1-Wire bus. This allows for placing temperature sensors in many different places. Applications where this feature is useful include HV AC environmental controls, sensing temperatures inside buildings, equipment or machinery, and process monitoring and control.The DS18B20 has four main data components: 1) 64-bit laser ROM, 2) temperature sensor, 3) nonvolatile temperature alarm triggers TH and TL, and 4) a configuration register. The device derives its power from the 1-Wire communication line by storing energy on an internal capacitor during periods of time when the signal line is high and continues to operate off this power source during the low times of the 1-Wire line until it returns high to replenish the parasite (capacitor) supply. As an alternative, the DS18B20 may also be powered from an external 3V - 5.5V supply.Communication to the DS18B20 is via a 1-Wire port. With the 1-Wire port, the memory and control functions will not be available before the ROM function protocol has been established. The master must first provide one of five ROM function commands: 1) Read ROM, 2) Match ROM, 3) Search ROM, 4) Skip ROM, or 5) Alarm Search. These commands operate on the 64-bit laser ROM portion of each device and can single out a specific device if many are present on the 1-Wire line as well as indicate to the bus master how many and what types of devices are present. After a ROM function sequence has been successfully executed, the memory and control functions are accessible and the master may then provide any one of the six memory and control function commands.Temperature sensor DS1820memory by a high speed buffer pad type RAM and a nonvolatile electrically erasable E2RAM composition, the latter is stored at high temperature and low temperature and the trigger of TH and TL. Scratchpad memory helps in one-way communication to ensure data integrity, data is first written to a buffer memory, where it can be read back. When data is checked, copy scratchpad memory command to send the data to the non-volatile E2RAM. This process ensures that the change of memory while maintaining data integrity.2.2.2The characteristics of DSl820●The unique single interface mode: DS18B20is connected with the microprocessor only needs an export line can realize microprocessor with DS18B20bidirectional communication.●Available data line power supply, voltage range: + 3and + 5.5 V.●Temperature range: -55 to + 125degrees c.. Intrinsic temperature measurement resolution of0.5DEG c..●Support point network function, multiple DS18B20 can be connected in parallel in only three online, realize the multipoint temperature measurement●Negative pressure characteristics, power polarity reverse connection, the thermometer is not due to heat and burning, but not normalWork.2.3LCD1602 LCD1602 LCD module can and monolithic integrated circuit AT89C51 directly interface.2.4Buzzer driver circuitDue to the working current buzzer is compared commonly big, so I/O microcontroller is not directly driven by amplifying circuit, so it is generally used to drive, to enlarge current transistor. When the temperature is below six degrees Celsius, alarm.3 The design of the software systemThis system USES A T89S51 devices as the core, with DSl8B20 after the collected data, and the temperature inside the data storage AT89S51 deposit, LCD display, and compared with the prior value, and then the output signal by MCU control circuit and alarm circuit fan. Multi-functional temperature testing system software mainly include: function declarations, time delay function andDS18B20 initialization function, read the temperature, temperature DS18B20 data into a liquid crystal display characters such programs.4 The research significanceThe collection of temperature monitoring in daily life have a wide range of uses, the temperature monitor based on this design, its biggest advantage is that can measure and display the current temperature, and the current temperature and a preset temperature are compared, when the current temperature exceeds a preset temperature alarm, based on historical data monitoring. The temperature monitoring alarm device for low power consumption, can use the least resources of different temperature and high precision measurement, information and reliable performance, convenient operation, complicated work through software programming to complete, you can easily obtain the results, in the actual use to obtain the desired results. The design of the tank temperature to achieve a real-time control, flexible and reliable control, high precision, can satisfy the product preliminary aging test requirements. Therefore, the design of the research achievements and design concept can be very good in other design in transplantation, done with actual good combination, and has strong practical significance.基于单片机的多点温度检测系统的设计引言随着社会的发展和技术的进步,人们越来越注重温度检测与显示的重要性。
DS18B20数字温度计外文资料翻译要点

南京理工大学毕业设计(论文)外文资料翻译学院(系):专业:机电一体化工程姓名:学号:外文出处:from internet附件: 1.外文资料翻译译文;2.外文原文。
指导教师评语:该外文资料贴近本次毕业设计主题,有一定的权威性,翻译的较全面,符合外文资料翻译要求。
签名:2014 年 5 月附件1:外文资料翻译译文DS18B20 数字温度计描述DS18B20 数字温度计提供9至12位温度读数,指示器件的温度。
信息经过单线接口送入DS18B20或送出,因此从中央处理器到DS18B20仅需连接一条(和地)。
读、写和完成温度变换所需的电源可以有数据线本身提供,而不需要外部电源。
因为每一个DS18B20有唯一的系列号,因此多个DS18B20可以存在于同一条单线总线上。
这允许在许多不同的地方放置温度灵敏器件。
此特性的应用范围包括HVAC环境控制,建筑物、设备或机械内的温度检测,以及过程监视和控制中的温度检测。
特性独特的单线接口,只需一个接口引脚即可通信。
多点能力使分布式温度检测应用得以简化。
不需要外部元件。
可用数据线供电,提供3.0V到5.5V的电源。
不需备份电源。
测量范围从-55°C 到+125°C,等效的华氏温标范围是-67°F 到+257°F以9到12位数字值方式读出温度。
在750毫秒内把12位温度变换为数字。
用户可定义的,非易失性的温度警告设置。
告警搜索命令识别和寻址温度在编定的极限之外的器件(温度告警情况)。
应用范围包括恒温控制,工业系统,消费类产品,温度计或任何热敏系统。
引脚排列引脚说明GND –地DQ –数字输入输出VDD –可选的VDDNC –不连接详细引脚说明综述图1的方框图表示DS18B20的主要部件。
DS18B20有三个主要的数据部件:1)64为激光ROM,2)温度灵敏元件,3)非易失性温度告警触发器TH和TL。
器件从单线的通信线取得其电源,在信号线为高电平的时间周期内,把能量贮存在内部的电容器中,在单信号线为低电平的时间期内断开此电源,直到信号线变为高电平重新接上寄生(电容)电源为止,作为另一种可供选择的方法,DS18B20也用外部5V电源供电。
- 1、下载文档前请自行甄别文档内容的完整性,平台不提供额外的编辑、内容补充、找答案等附加服务。
- 2、"仅部分预览"的文档,不可在线预览部分如存在完整性等问题,可反馈申请退款(可完整预览的文档不适用该条件!)。
- 3、如文档侵犯您的权益,请联系客服反馈,我们会尽快为您处理(人工客服工作时间:9:00-18:30)。
外文资料DS18B20 Programmable Resolution 1-Wire DigitalThermometerThe DS18B20 Digital Thermometer provides 9 to 12-bit (configurable) temperature readings which indicate the temperature of the device. Information is sent to/from the DS18B20 over a 1-Wire interface, so that only one wire (and ground) needs to be connected from a central microprocessor to a DS18B20. Power for reading, writing, and performing temperature conversions can be derived from the data line itself with no need for an external power source. Because each DS18B20 contains a unique silicon serial number, multiple DS18B20s can exist on the same 1-Wire bus. This allows for placing temperature sensors in many different places. Applications where this feature is useful include HV AC environmental controls, sensing temperatures inside buildings, equipment or machinery, and process monitoring and control.The block diagram of Figure 1 shows the major components of the DS18B20. The DS18B20 has four main data components: 1) 64-bit laser ROM, 2) temperature sensor, 3) nonvolatile temperature alarm triggers TH and TL, and 4) a configuration register. The device derives its power from the 1-Wire communication line by storing energy on an internal capacitor during periods of time when the signal line is high and continues to operate off this power source during the low times of the 1-Wire line until it returns high to replenish the parasite (capacitor) supply. As an alternative, the DS18B20 may also be powered from an external 3V - 5.5V supply.Communication to the DS18B20 is via a 1-Wire port. With the 1-Wire port, the memory and control functions will not be available before the ROM function protocol has been established. The master must first provide one of five ROM function commands: 1) Read ROM, 2) Match ROM, 3) Search ROM, 4) Skip ROM, or 5) Alarm Search. These commands operate on the 64-bit laser ROM portion of each device and can single out a specific device if many are present on the 1-Wire line as well as indicate to the bus master how many and what types of devices are present. After a ROM function sequence has been successfully executed, the memory and control functions are accessible and the master may then provide any one of the six memory and control function commands.One control function command instructs the DS18B20 to perform a temperature measurement. The result of this measurement will be placed in the DS18B20’s scratch-pad memory, and may be read by issuing a memory function command which reads the contents of the scratchpad memory. The temperature alarm triggers TH and TL consist of 1 byte EEPROM each. If the alarm search command is not applied to the DS18B20, these registers may be used as general purpose user memory. The scratchpad also contains a configuration byte to set the desired resolution of the temperature to digital conversion. Writing TH, TL, and the configuration byte is done using a memory function command. Read access to these registers is through the scratchpad.All data is read and written least significant bit first.The block diagram (Figure 1) shows the parasite-powered circuitry. This circuitry “steals” power whenever the DQ or VDD pins are high. DQ will provide sufficient power as long as the specified timing and voltage requirements are met (see the section titl ed “1-Wire Bus System”). The advantages of parasite power are twofold: 1) by parasiting off this pin, no local power source is needed for remote sensing of temperature, and 2) the ROM may be read in absence of normal power.In order for the DS18B20 to be able to perform accurate temperature conversions, sufficient power must be provided over the DQ line when a temperature conversion is taking place. Since the operating current of the DS18B20 is up to 1.5 mA, the DQ line will not have sufficient drive due to the 5k pull up resistor. This problem is particularly acute if several DS18B20s are on the same DQ and attempting to convert simultaneously.There are two ways to assure that the DS18B20 has sufficient supply current during its active conversion cycle. The first is to provide a strong pull up on the DQ line whenever temperature conversions or copies to the E2 memory are taking place. This may be accomplished by using a MOSFET to pull the DQ line directly to the power supply as shown in Figure 2. The DQ line must be switched over to the strong pull up within 10 us maximum after issuing any protocol that involves copying to the E2 memory or initiates temperature conversions. When using the parasite power mode, the VDD pin must be tied to ground.Another method of supplying current to the DS18B20 is through the use of an external power supply tied to the VDD pin, as shown in Figure 3. The advantage to this is that the strong pull up is not required on the DQ line, and the bus master need not be tied up holding that line high during temperature conversions. This allows other data traffic on the 1-Wire bus during the conversion time. In addition, any number of DS18B20s may be placed on the 1-Wire bus, and if they all use external power, they may all simultaneously perform temperature conversions by issuing the Skip ROM command and then issuing the Convert T command. Note that as long as the external power supply is active, the GND pin may not be floating.The use of parasite power is not recommended above 100 C,since it may not be able to sustain communications given the higher leakage currents the DS18B20 exhibits at these temperatures. For applications in which such temperatures are likely, it is strongly recommended that VDD be applied to the DS18B20.For situations where the bus master does not know whether the DS18B20s on the bus are parasite powered or supplied with external VDD, a provision is made in the DS18B20 to signal the power supply scheme used. The bus master can determine if any DS18B20 are on the bus which require the strong pull up by sending a Skip ROM protocol, then issuing the read power supply command. After this command is issued, the master then issues read time slots. The DS18B20 will send back “0” on the 1-Wire bus if it is parasite powe red; it will send back a “1” if it is powered from the VDD pin. If the master receives a “0,” it knows that it must supply the strong pull up on the DQ line during temperature conversions. See “Memory CommandFunctions” section for more detail on this comm and protocol.The DS18B20 has an 8-bit CRC stored in the most significant byte of the 64-bit ROM. The bus master can compute a CRC value from the first 56-bits of the 64-bit ROM and compare it to the value stored within the DS18B20 to determine if the ROM data has been received error-free by the bus master. The equivalent polynomial function of this CRC is:1458+++=X X X CRCThe DS18B20 also generates an 8-bit CRC value using the same polynomial function shown above and provides this value to the bus master to validate the transfer of data bytes. In each case where a CRC is used for data transfer validation, the bus master must calculate a CRC value using the polynomial function given above and compare the calculated value to either the 8-bit CRC value stored in the 64-bit ROM portion of the DS18B20 (for ROM reads) or the 8-bit CRC value computed within the DS18B20(which is read as a ninth byte when the scratchpad is read). The comparison of CRC values and decision to continue with an operation are determined entirely by the bus master. There is no circuitry inside the DS18B20 that prevents a command sequence from proceeding if the CRC stored in or calculated by the DS18B20 does not match the value generated by the bus master.The 1-Wire CRC can be generated using a polynomial generator consisting of a shift register and XOR gates as shown in Figure 6. Additional information about the Dallas 1-Wire Cyclic Redundancy Check is available in Application Note 27 entitled “Understanding and Using Cyclic Redunda ncy Checks with Dallas Semiconductor Touch Memory Products.”The shift register bits are initialized to 0. Then starting with the least significant bit of the family code, 1 bit at a time is shifted in. After the 8th bit of the family code has been entered, then the serial number is entered. After the 48th bit of the serial number has been entered, the shift register contains the CRC value. Shifting in the 8 bits of CRC should return the shift register to all 0s.中文翻译DS1820 单总线数字温度计DSl820数字温度计提供9位(二进制)温度读数指示器件的温度。