洪永淼教授推荐的计量经济学教材
北大经济学博士生用书
4.2 波动理论 4.3 基本的真实经济周期模型 4.4 家庭行为 4.5 模型的特殊情形 4.6 一般情形的模型求解 4.7 含义 4.8 经验性应用:产出波动的持久性 4.9 经验性应用:校准真实经济周期模型 …… 5 传统凯恩斯主义波动理论 6 不完全名义调整的微观经济基础 7 消费 8 投资 9 失业 10 通货膨胀与货币政策 11 预算赤字与财政政策 参考文献 1.《人名对照表》 2.《术语对照表》 3.《众汇赢 P2P 学术报》
3/8
阐述了静态博弈与动态博弈的各种解概念与分析方法,分析了行为相 互影响下的个人决策。第三部分是市场均衡和市场失灵,详细介绍了 外部性与公共物品、市场垄断、逆向选择以及委托代理等信息经济学 的基本模型。第四部分关于一般均衡理论,介绍与一般均衡相关的各 种概念,包括均衡的存在性和稳定性及福利特征等。第五部分涉及福 利经济学与激励问题,分析在个人效用可比和不可比情况下,由个人 偏好加总为社会偏好的可能性,以及在关于个人偏好的信息不完全时 的社会选择和经济机制设计等规范分析问题。本书的数学附录为读者 提供了所需的基本数学知识。书中每一章都提供必要的详细参考文献, 方便学生进一步学习及寻找研究课题;同时,各章配备的层次不同的 练习题,非常有利于学生测试自己对各章内容的掌握程度。
现在就介绍下北大的高级微观经济学和高级宏观经济学教材。 1、微观经济学:高级教程(第三版——国外经济学教材库 作者是美国的瓦里安,财洪等译,经济科学出版社 2002 年出版 , 593 页,490000 字。哈尔·瓦里安是世界上著名的微观经济学,在麻 省理工学院、伯克利、斯坦福、牛津等多所大学任教。《微观经济学》 (高级教程)第一版出版于 1977 年。在第三版中,结构上的改变包 括在“组合单元式”的章节中对资料的重大调整。这些章节绝大部分
洪永淼老师统计学教材
洪永淼老师统计学教材Lecture Notes on Probability and Statistics Theoryfor EconomistsYongmiao HongDepartment of Economics&Department of Statistical ScienceCornell UniversityEmail:yh20@/doc/fc12276666.html,December2005c 2005yongmiao Hong.All rights reserved.Outline of ContentsChapter1Introduction to EconometricsChapter2Foundation of Probability TheoryChapter3Random Variables and Univariate Probability Distributions Chapter4Important Parametric Distributions Chapter5Random Vectors and Multivariate Probability Distribution Chapter6Introduction to Sampling Theory and StatisticsChapter7Convergence Concepts and Limit TheoriesChapter8Parameter Estimation and EvaluationChapter9Hypothesis TestingChapter10ConclusionPrefaceThis book is the…rst course in a graduate econometrics sequence.It provides an introduction to probability theory and statistics.Why do we need to teach probability and statistics to graduate students in economics?Put it simply,it provides necessary probability and statistics background for…rst-yeargraduate students for their courses in econometrics,microeconomics,and macroeconomics.Statistics and mathematics are two basic analytic tools in economics.Statistics is an essential tool to study situations involving uncertainties,in the same way as calculus is essential to characterize optimizing behaviors in economics.For example,probability theory is needed in study of game theory,rather vice versa.In macroeconomics,as Robert Lucas points out,the introduction of stochastic factors can provide much new insights into dynamic economic systems.In certain sense,a course on probability and statistics might not be called Econometrics I,because they are necessary analytic tools in every…eld of economics.Of course,the demand for probability and statistics varies from…eld to…eld in economics,with econometrics most heavily using it.Speci…cally,those who are attracted to theoretical econometrics would be expected to study probability and statistics in more depth by taking further graduate courses in mathematics and statistics.Those who are not attracted to should…nd this course in adequate preparation in the theory of probability and statistics for both their applied courses in econometrics and their courses in microeconomics and macroeconomics.The book is written as a one semester course.Chapters1–5are probability theory,and Chapters6-9are statistics theory.Chapter1is an introduction to econometrics,arguing why probability and statistics are basic analytic tools for economics.Chapter2lays down the founda-tion of probability theory,which is important for understanding subsequent materials.Chapter3 introduces random variables and probabilitydistributions in a univariate context.Chapter4lists and discusses important examples of discrete and continuous probability distributions that are commonly used in economics and…nance.Chapter5introduces random vectors and multivariate probability distributions.In most cases,we consider the bivariate distribution.Chapter6is an introduction to statistics theory,and Chapter7introduces basic analytic tools for asymptotic theory.Chapter8discusses parameter estimation methods and methods to evaluate parameter estimators.Chapter9deals with hypothesis testing.Finally,Chapter10concludes the book. The book contains discussions ranging from basic concepts to advanced asymptotic analysis,with much intuition and explanations provided for important probability and statistics concepts andideas.Whenever and wherever appropriate,empirical applications are considered to illustrate how probability and statistics theories and methods can be applied to economics and…nance.The purpose of this book is to develop a deep understanding of probability and statistics and a solid intuition for statistical concepts.One year of calculus is a prerequisite for understanding the materials in this book,and an additional year of advanced calculus and some basic background in probability and statistics will be very helpful.The analysis is conducted in a relatively rigorous manner.Formal proofs will be given for some important theorems,because the proofs themselves can aid understanding and in some cases,the proof techniques or methods have practical value. Many students taking this course are experiencing the ideas of statistics for the…rst time.It will be helpful for them to spend some time learning how themathematical ideas of statistics carry over into the world of applications in economics and…nance.Thu s in addition to develop a fundamental understanding of probability and mathematical statistics that are most relevant to modern econometrics,this book also tries to develop a sound intuition for statistical concepts from economic perspective.For example,why are statistical concepts(e.g.,conditional mean, conditional variance)useful in economics?What are economic intuition and interpretation for the probability and statistic relations?Yongmiao HongCornell University,Ithaca,U.S.A.Chapter1Introduction to EconometricsThe most important feature of modern economics and…nance is the wide use of quantita-tive analysis.Quantitative analysis consists of mathematical modeling of economic theory and empirical study of economic data.This is due to the cumulative e¤o rt of many generations of economists in their e¤orts to make economics as a science,something like or close to physics, chemistry and biology,which can make accurate forecasts.Economic theory,when formulated via mathematical tools,can achieve its logical consistency between assumptions,theory,and its implications.Indeed,as Karl Marx pointed out,the use of mathematics is an indication of the stage of a science.On the other hand,for any economic theory to be a science,it must be able to explain important stylized facts and to predict future economic evolutions.This requires validating economic models using the observed economic phenomena,usually in form of data. Mathematical tools cannot help in achieving this objective.Instead,statistical tools have proven to be rather useful.The history of development ofeconomics is a continuous process of refuting the existing economic theory that cannot explain new empirical stylized facts and developing new economic theories that can explain new observed empirical stylized facts.Empirical ana-lytic tools play a vital role in such a process.In a sense,statistical methods and techniques are really the heart of the scienti…c research in economics.As a matter of fact,the main empirical analytic tool in economics has been econometrics. Econometrics is the statistical analysis of economic data.Probability was motivated by interest in games of chance.Scholars then began to apply probability theory to actuarial problems and some aspects of the social /doc/fc12276666.html,ter,probability and statistics were introduced into physics by L.Boltzmann,J.Gibbs,and J.Maxwell,and by this century,they have found applications in all phases of human endeavor that in some way involve an element of uncertainty or risk.Indeed, probability theory has been the best analytic tool to describe any system involving uncertainties.Modern statistics has encompassed the science of basing inferences on observed data and the entire problem of making decisions in the face of uncertainty.It would be presumptuous to say that statistics,in its present state of development,can handle all situations involving uncertainties,but new techniques are constantly being developed and modern statistics can,at least,provides a framework for looking at the situations involving uncertainties in a logical and systematic fashion.It can be said that statistics provides mathematical models that are needed to studies situations involving uncertainty in the same way as calculus provides the mathematical models that are needed todescribe,say the concepts of Newtonian physics.Indeed,as Robert Lucas pointed out,the introduction of stochastic factors into an dynamic economic system can provide new insight into the dynamic economic process.There are two fundamental axioms behind econometrics:Axiom A:Any economy can be viewed as a stochastic process governed by some probability law;Axiom B:Economic phenomenon,as often summarized in form of data,can be reviewed as a realization of this stochastic data generating process.Economics is about resource allocation in an uncertain environment.When an economic agent makes a decision,he or she usually does not know precisely the outcome of his or her action,which usually will arise in an unpredictable manner,and after some time lags.As a consequence,uncertainty and time are two most important features of an economy.Therefore it seems reasonable to assume Axiom A.With Axiom A,it is natural to assume Axiom B under which one can call the economic system is a“data generating process.”It is impossible to prove these two axioms.They are the philosophic views of econometricians and economists about an economy.We note that not all economists and econometricians agree with these two axioms. For example,some economists view that an economic system is a chaotic process,which is deterministic but can generate seemingly random numbers.The probability law of a stochastic economic process may be called the“law of economic motions.”The objective of econometrics is to infer the probability law of an economic system based on observed economic data,and then use the inferred probability law to test economic theory and economichypotheses,to explain important stylized facts,and to forecast future evolutions of the economic system.Econometrics provides a bridge linking economic models and economic reality.One important implication of Axioms A and B is the need of“statistical thinking”in eco-nomic analysis.For example,one should expect that economic relationships are stochastic and the outcomes cannot be predicted with certainty.All economic agents must incorporate this uncertainty when making their economic decisions.Moreover,any economic data observed,as realizations of a stochastic process,must be subject to sampling variations,thus creating some uncertainties for our inference of the law of economic motion.Statistics is an analysis of the “average behavior”of the outcomes of a large number of repeated experiments.A key assump-tion in the statistical analysis of this book is that the repeated experiments are independent and identically distributed.By independence,it is meant that the generation of the outcome of an experiment has nothing to do with the generalization of the outcome of another experiment. Thus,di¤erent experiments provide di¤erent pieces of information.By identical distribution,it is meant that the mechanisms of di¤erent experiments generating outcomes are the same.Ob-viously,the i.i.d.assumption is an mathematical limiting approximation of real experiments.It may be di¢cult to satisfy for stochastic economic processes.There are some distinctive features of an economic system when viewed as a stochastic process.The observed data is the joint e¤ect of many(perhaps in…nite)factors in an economy,while any economic model can only consider some of them.It is therefore very di¢cult,if not impossible,to separate the e¤ect of the fac-tors under modeling from the e¤ect of the omitted factors.This isquite di¤erent from Physics, where an controlled experiment can be done to remove the e¤ect of other f actors.In the recent years,there is an increasing interest in experimental economics,which can be viewed as studies of controlled economic experiments.This is similar in spirit to Physics,but it is hard to image to extend this method to the whole economy like China which has1.3billions of populations.The second feature of economic systems is that an economic process is irreversible.As a con-sequence,many important economic variables,such as GDP,only have one realization.Thus, it is impossible to conduct statistical analysis of economic data without making assumptions. In practice,it is often assumed that di¤erent economic variables follow from the same popu-lation distribution or at least have the same attributes in certain aspects of their probability dist ributions.Thus,the data for di¤erent variables can be viewed as generated from the sample population or share same attributes,so that statistical inference of observed data is possible. Obviously,the validity and accuracy of the statistical inference depends on how reasonable the underlying assumptions are in describing economic systems.The third feature of economic systems is their time-varying features.There are many eco-nomic events,such as government policy changes,changes of foreign exchange rate systems,oil shocks,etc,which may cause economic behaviors to change fundamentally.This is the so-called economic structural breaks or regime shifts.Structural breaks and regime shifts will render the existing economic models invalid in describing or predicting future economic evolutions.Because of these distinctive features of economic systems,we should be aware of the under-lying assumptions and theirlimitations when making statistical inference of economic data.。
洪永淼

谢谢观看
洪永淼自2005年以来,为了让全中国年轻学者有机会了解和把握现代计量经济学和现代统计学的学术发展动 态和最新研究成果,拓宽国际学术视野和提高创新研究能力,洪永淼坚持每年组织举办面向全中国研究生的ቤተ መጻሕፍቲ ባይዱ量 经济学暑期学校,截至2018年11月,学员逾3000人;还多次组织相关的国际、国内研讨会和师资培训班,为学 者们搭建沟通平台,推动中国经济学,特别是计量经济学与国外的合作与交流等。
洪永淼
发展中国家科学院院士、计量经济学家
01 人物经历
03 人物评价
目录
02 主要成就
洪永淼,1964年2月出生,籍贯福建厦门,计量经济学家,发展中国家科学院院士,中国科学院大学经济与 管理学院特聘教授、院长,中国科学院数学与系统科学研究院特聘研究员,中国科学院预测科学研究中心特聘研 究员。
洪永淼于1985年获得厦门大学物理学学士学位;1988年获得厦门大学经济学硕士学位;1993年获得加利福 尼亚大学圣迭戈分校经济学博士学位;1993年7月—1998年6月任美国康奈尔大学经济学系助理教授;1997年7 月—1998年6月任美国康奈尔大学统计科学系助理教授;1998年7月—2001年6月任美国康奈尔大学经济系和统 计科学系副教授;1999年1月—2000年1月任香港科技大学经济学系访问副教授;2001年7月—2020年12月任美 国康奈尔大学经济学系和统计科学系教授;2003年5月—2020年12月任职于美国康奈尔大学应用数学中心; 2005年6月—2020年12月任厦门大学王亚南经济研究院创院院长;2009年12月—2020年12月任计量经济学教育 部 重 点 实 验 室 ( 厦 门 大 学 ) 主 任 ; 2 0 1 0 年 11 月 任 厦 门 大 学 经 济 学 院 院 长 ; 2 0 1 5 年 当 选 为 发 展 中 国 家 科 学 院 院 士 ; 2016年7月—2019年6月任美国康奈尔大学经济学领域研究生事务主任;2020年12月起任中国科学院大学经济与 管理学院特聘教授和中国科学院数学与系统科学研究院特聘研究员;2021年任中国科学院大学经济与管理学院院 长,2月起任中国科学院预测科学研究中心执行主任。
洪永淼计量经济学讲义_ch08
m^ 1 = Xn:
Matching the sample mean with the population mean evaluated at ^ :
m^ 1 =
(^)
=
1 ^
;
we obtain the method of moment estimator
^=
1
=
1 :
m^ 1 Xn
Example 2: Suppose the random sample fXtgnt=1 i.i.d.N ( ; 2): Find MME for 0 = ( ; 2)0:
Remark: In general, if is a K 1 vector, we need K equations of matching moments.
Question: Is MME consistent for 0? Because m^ k !p k( 0); we expect that ^ !p 0 as n ! 1:
CHAPTER 8 GENERALIZED METHOD OF MOMENTS
Key words: CAPM, GMM, Moment matching, Overidenti…cation, Rational expectations.
Abstract: Many economic theories and hypotheses have implications on and only on a moment condition. A popular method to estimate model parameters contained in the moment condition is the Generalized Method of Moments (GMM). In this chapter, we …rst provide some economic examples for the moment condition, and de…ne the GMM estimator. We then establish the consistency and asymptotic normality of the GMM estimator. Since the asymptotic variance of a GMM estimator depends on the choice of a weighting matrix, we introduce an asymptotically optimal two-stage GMM estimator witha suitable choice of a weighting matrix. With the construction of an asymptotic variance estimator, we then propose an asymptotically 2 Wald test statistic for the hypothesis of interest, and a model speci…cation test for the moment condition.
洪永淼老师统计学第三章
Chapter3Random V ariables and UnivariateDistributionsKey words:continuous random variable,cumulative distribution function,discrete random variable,probability density function,probability mass function,random variable,moments, moment generating function,mean,variance,skewness,kurtosis.Abstract:In this and next chapters,we will use advanced calculus to formalize the probability theory introduced in Chapter2.The use of mathematics enables us to investigate probability more deeply.A number of quantitative-oriented probability concepts will be introduced.In this chapter,we…rst introduce the concept of a random variable and characterize the distributions of a random variable and functions of a random variable by the cumulative distribution function,the probability mass function or probability density function,and the moment generating function and the characteristic function.We also introduce a class of moments as well as their relationships with a distribution.This chapter focuses on univariate distribution.3.1:Random Variables and Distribution FunctionsRead Sections1.4–1.6Review:Recall that B;Borel…eld(or -algebra),is a collection satisfying the following conditions:(i) 2B;(ii)If A2B then A c2B;(iii)If A j2B;j=1;2;:::;then[1j=1A j2B:When B is a -algebra,we call the pair(S;B)a measurable space.Also,a probability function is a mapping from B to R satisfying the following conditions(i).P(A) 0for all A2B;(ii).P(S)=1;(iii).If A j2B;j=1;2; ;are pairwise mutually exclusive,then P([1j=1A j)=P1j=1P(A j): De…nition[Probability Space]:Suppose P is a probability measure de…ned on the measurable space(S;B).Then(S;B;P)is a probability space.Remark:The space S and the associated -algebra di¤er according to the natures of random experiments.Example:A Coin is thrown.S=f H;T g:Example:Bush running for the next term of Presidency.S=f Win,Fail}.Example:Three coins are thrown.S=f HHH;HHT;HT H;HT T;T HH;T HT;T T H;T T T g.: Event A={two heads appear}=f HHT;HT H;T HH g:Then P(A)=38Example:Throwing a die,S=f1;2;3;4;5;6g.Remark:It is inconvenient to work with di¤erent sample spaces.In particular,a sample spaceS may be tedious to describe if the elements of S are not numbers.In many experiments,it is easier to deal with a summary variable than with the original probability structure.To developa uni…ed probability theory,we need to unify di¤erent sample spaces.For this purpose,we needto formulate a rule,or a set of rules,by which elements of S may be represented by numbers. This can be achieved by assigning a real number to each possible outcome in S.In other words, we construct a mapping from the original sample space S to a new sample space ,a set of real numbers.This transformations is called a random variable.A random variable is a function de…ned on a sample space.Its purpose is to facilitate the solution of a problem by transferring considerations to a new probability space with a simpler or more convenient structure.On the other hand,in many applications,we are interested only in a particular aspect of the outcomes of experiments,rather than all outcomes.For example,when we roll a number of dice, we are usually interested in the total,and not in the outcome of each dice.In such applications,a suitably de…ned random variables will serve for our purpose.De…nition[Random Variable]A random variable(r.v.)X( )is a B-measurable mapping(or point function)from the sample space S to the real line R such that to each outcome s2S there exists a corresponding unique real number,X(s):The collection of all possible values that the random variable X can take,also called the range of X( );constitutes a new sample space, denoted as .Example:S=f H;T g.De…ne X(H)=1and X(T)=0:Then =f1;0g:Example:S=f Win,Fail}:De…ne X(W in)=1and X(F ail)=0:Then =f1;0g:Remark:It is not necessary to have the same number of basic outcomes for S and :In some cases,it is more convenient to work with a suitably de…ned new sample space .Example:S=f T T T;T T H;T HT;HT T;HHT;HT H;T HH;HHH g.De…ne X(T;T;T)= 0;X(T;T;H)=1;X(T;H;T)=1;X(H;T;T)=1;X(H;H;T)=2;X(H;T;H)=2;X(T;H;H)= 2;X(H;H;H)=3:Then =f0;1;2;3g:Intuition:X(s)is the number of heads.Therefore,P(X=3)=P(A);where A=f s in S:X(s)=3g;denotes the probability that exactly three heads occur in the experiment.Example:S=f1;2;3;4;5;6g:De…ne X(s)=s:Then =S:Identity transformation.Need not change S because S consists of numbers already.Remark:The transformation need not be1 1.Question:Suppose the number of basic outcomes in S is countable.(a)Is it possible that the number of basic outcomes in is larger than that of S?(b)Smaller than that of S?Example:S=f s: 1<s<1g:X(s)=1if s>0and X(s)=0if s 0:Remark:This is useful for directional forecasts or investigation of asymmetric business cycles (e.g.,Neftci1984,“Are Economic Time Series Asymmetric Over the Business Cycles?”,JPE92, 307-328).Remark:The above de…nition of a random variable is limited to real-valued functions.This does not impose any restriction.We can de…ne complex-valued random variables by looking upon the real and imaginary parts separately as two real-valued random variables.Remark:In this book,we use a capital letter X to denote a random variable,and use a lowercase letter x to denote its realization.In de…ning a random variable X,we have also de…ned a new sample space (the range of the random variable X).The probability function de…ned on the original sample space S can be used for the random variable X.Suppose we have a sample space with…nite basic outcomesS=f s1;:::;s n gwith a probability function P( )and we de…ne a random variable X with the range=f x1;:::;x m g:We can de…ne the probability function P X( )on in the following way:P X(x i) P(X=x i)=P(C);where C is an event in S such thatC=f s2S:X(s)=x i g:Note that the left hand side,P X( );is an induced probability function on ;de…ned in terms of the original probability function P( ):This can be applied to the case where is countable. For an uncountable ;we can still de…ne the induced probability function,P X( );in a similar manner.More generally,for any set A2B ;where B is a Borel…eld generated from ;P X(A) P(X2A)=P(C)=P[s2S:X(s)2A];where C=f s2S:X(s)2A g is the set of basic outcomes in the original sample space S for which the random variable X has a value that is in A:Thus,a random variable X is a function that carries the probability from a sample space S to a space of real numbers.In this sense, with A2 ;the probability P X(A)is often called an induced probability function.It can be shown that when S is a countable sample space,the induced probability function P X( )satis…es the three axioms of the probability function.Remark:When S is continuous(e.g.S=R);we cannot use the above expressions immediately unless we can be sure that the set C=f s2S:X(s)2A g belongs to the -algebra B.Whether or not C2B depends on,of course,the form of mapping X( ).Question:What functional form X( )will ensure C2B?Or what condition on X( )will ensure that the set C is in B?The following condition ensures that C always belongs to B:De…nition[Measurable Function]:A function X:S!R is B-measurable(or measurable with respect to the sigma…eld B generated from S)if for every real number a;the set[s2S: X(s) a]2B:Dice S=f1;2;3;4;5;6g;=S;X(s)=s:Remarks:(i)When a function X is B-measurable,we can express the probability of an event,say "X a";in terms of the probability of event C in B;where C=f s2S:X(s) a g:In other words,the measurable function ensures that P(X2A)is always well-de…ned for all subsets A on B .If X( )is not a measurable function,then there exist subsets on the Boreal…eld in R for which probabilities are not de…ned.However,constructing such sets are very complicated.(ii)In what follows,we assume that the random variable X is always measurable with respect to some -algebra of S.In fact,in the advanced probability theory,the term“random variable”is restricted to be a B-measurable function from S!R:Theorem:Let B be a -algebra associated with sample space S.Let f and g be B-measurable real valued functions,and c be a real number.Then the functions c f;f+g;f g and j f j are also B-measurable.Proof:See White[1984,Proposition3.23],who says“see Bartle[1966,Lemma2.6]”. Remark:If one starts with function X(s)and Y(s)that are measurable mappings from S to ;then new functions Z(s)can be constructed by ordinary algebraic operations such as Z(s)=aX(s);Z(s)= X(s)+Y(s);Z(s)=X(s)Y(s);and Z(s)=X(s)=Y(s)are measurable.If one has a sequence X1(s);X2(s);:::of measurable functions and constructs Z(s)through limiting operations such as Z(s)=lim i!1Z i(s)or Z(s)=sup1 i<1f Z i(s)g;then Z(s)is measurable.A proof of these claims is not particularly di¢cult,but is beyond this course.All that is important for our purposes is to know that standard functions are measurable and that any standard sequence of countable operations on such functions will not destroy measurability.It can be shown that the induced probability P X( )satis…es the de…nition of a probability function.First,conditions(i)and(ii)are easily veri…ed by observing,for C=f s2S:X(s)2 A g;thatP X(A)=P(C) 0;and that S=f s2S and X(s)= g requiresP X( )=P(S)=1:In discussing condition(iii),let us restrict our attention to two mutually exclusive events A1and A2in :Here,P X(A1[A2)=P(C);where C=f s2S:X(s)2A1[A2g:However,we haveC=f s2S:X(s)2A1g[f s2S:X(s)2A2g;or for brevity,C=C1[C2:But C1and C2are disjoint sets in S.This must be so,for if some s were common,say s0;then X(s0)2A1and X(s0)2A2:That is,the same number X(s0) belongs to both A1and A2.This is a contradiction because A1and A2are disjoint sets in . Accordingly,P(C)=P(C1)+P(C2):However,by de…nition,P(C1)=P X(A1)and P(C2)=P X(A2);and thusP X(A1[A2)=P X(A1)+P X(A2):This is the condition(iii)for two disjoint sets when de…ning a probability function. Remark:The reason that we need the random variable X to be a Borel measurable function is to assure that we can…nd the induced probabilities on the sigma…eld B X generated from the subsets of :We need this requirement throughout this course for every function that is a random variable.Remark:P X( )is the probability function de…ned on the Borel…eld B X generated from :In many cases below,we will drop the subscript X and simply write P X(A)=P(A)for A B X:Example(Three Coins thrown,continued):S=f HHH;:::;T T T g; =f0;1;2;3g: P[0 X 1]=P f s2S:0 X(s) 1g:A=f s2S:0 X(s) 1g=f T T T;T T H;T HT;HT T g:P[0 X 1]=P(A)=1=8+1=8+1=8+1=8:Question:How to characterize a random variable X?Answer:Of course,we can use the probability function P X(A):Below,we introduce an alter-native function to characterize the distribution of X:Cumulative Distribution Function(CDF)of a random variable X is de…ned as:F X(x)=P(X x)for all x2R:Remark:The subscript X of the F function indicates that it is the CDF of the random variable X:Properties of F X(x):(i)lim x! 1F X(x)=0;lim x!+1F X(x)=1:(ii)F X(x)is non-decreasing,i.e.for any x1<x2;F X(x1) F X(x2).(iii)F X(x)is right-continuous,i.e.for all x and >0;lim!0+[F X(x+ ) F X(x)]=0:Implications and interpretations:0 F X(x) 1:Theorem:Let a<b:ThenP(a<X b)=F X(b) F X(a):Theorem:P(X>b)=1 F X(b):Example:If F(x)is a cumulative distribution function(cdf),is G(x)=1 F( x)a cdf too? Solution:(i)G( 1)=1 F[ ( 1)]=1 F(+1)=1 1=0;G(+1)=1 F( 1)=1 0=1:(ii)x1<x2:G(x1)=1 F( x1);G(x2)=1 F( x2):G(x2) G(x1)=[1 F( x2)] [1 F( x1)]=F( x1) F( x2)0:(iii)No.G(x)is left-continuous but not necessarily right-continuous.Example:Is P(X b)=1 F X(b)?Solution:P(X b)=P(X>b)+P(X=b)=1 F X(b)+P(X=b):Example:Suppose F1(x)and F2(x)are two cumulative distribution functions,isF(x)=pF1(x)+(1 p)F2(x)a cdf,where p is a constant.Remark:In application,p may depend on economic variables.An example of p=p(Z)isp(Z)=11+exp( 0Z);where Z is the state variable of economy,taking0with prob p and taking1with prob 1 p:This is a mixture distribution.A mixture of two distributions can provide a great deal of ‡exibility.Answer:Yes if0 p 1:Remark:When proper conditions on p are imposed,this is called a mixture of distributions.A well-known example in econometrics is the so-called Markov regime-switching model in which p depends on a state variable characterizing the business cycles(cf.Hamilton1994,Time Series Analysis).Remark:The de…nition of the cdf makes it clear that the probability function P X( )determines the cdf F X( ):It is true,although not so obvious,that a probability function P X( )can be found from a cdf F X( ):That is,P X( )and F X( )give the same information about the distribution of probability,and which function is used is a matter of convenience.Question:Why does the CDF F X(x)can characterize the probability distribution of random variable X?De…nition:Two random variables X and Y are identically distributed if for every set in B1;where B1is the smallest -…eld containing all the intervals of real numbers of the form (a;b);[a;b);(a;b];and[a;b];one hasP(X2A)=P(Y2A):Remark:Identical distribution does not imply X=Y:Theorem:Two random variables X and Y are identically distributed if and only ifF X(u)=F Y(u)for all 1<u<1:3.2Discrete Random Variable(D.R.V.)Read Sections3.1and3.2De…nition[Discrete v.s.Continuous Random Variables(R.V.)]:If a random variable X can only take a countable number of values,then X is called a discrete random variable(d.r.v.). Otherwise,if it can take any value in an interval,it is called a continuous random variable(c.r.v.). Examples:=f1;2;3;4;5;6g:=f0;1;2;3;::::g;e.g.,Poisson distribution.=R:=[0;1]:Prob(Mass)Function(pmf)of a discrete r.v.X is de…ned asf X(x)=P(X=x)for all x2R:Properties of pf/pmf:(i)0 f X(x) 1for all x2R:(ii)P x f X(x)=1:De…nition[Support of X]:The collection of the points at which a d.r.v.X has a positive probability is called the support of X;denoted asSupport(X)=f x2R:f X(x)>0g:Remark:Although f X(x)is de…ned on x2R;it su¢ces to know the support of a d.r.v.X and the probabilities of all points in the support.Geometric representation:Probability histogram.For example,it can show whether there are more than one mode,or“high points”.A mode is a bar in a histogram that is surrounded by bars of lower frequency.A histogram exhibiting two modes is said to be bimodal,and one having more than two modes is said to be multimodal.Question:Given the probability function,What can we obtain?Cumulative Distribution Function of a d.r.v.X isF X(x)=P(X x)=X y x f X(y)for any x2R;where the summation is over all values y that are less than or equal to x.Remark:The argument of F X( )runs continuously from 1to+1;i.e.x2( 1;1):It is di¤erent from the support of X:Example1:Uniform Distribution U(N);X12f X1=N1=NFind the distribution function.Solution:Case1:x<1.Then f X x g is ;andF X(x)=X x i x f X(x i)=0:How many x0i s that are less than or equal to x?“X x"= :Case 2:1 x <2.Then “X x ”=f 1g ;andF X (x )=X x i xf X (x i )=f X (1)=1=N:Case 3:2 x <3:Then “X x ”=f 1;2g ;and F X (x )=2=N:Case j :j 1 x <j;j N:Then “X x ”=f 1;2;3; ;j 1g ;andF X (x )=(j 1)=N:Case N +1:x N:Then"X x "=f 1;2;3; ;N g ;andF X (x )=1:In summary,F X (x )=8<:0x <1j=N j x <j +1;1 j <N;j 2Z 1x NRemark:F X (x )is a function on R ;so it is incomplete if you just compute F X (x )on x =1;2;3;4; ;N:Conclusion:Given f X (x );we can obtain F X (x ):Question :Suppose X is a d.r.v.that takes values of x 1<x 2<x 3< ;and its distribution function F X (x )is given,is it possible to recover f X (x )from F X (x )?ANS:For d.r.v.,F X (x )is a step function.The points f x i g where f x (x i )>0will be the jump points for F X (x ).Without loss of generality,we can arrange these points in an increasing sequential order.Then the probabilities at these points can be obtained fromf X (x i )=P (X =x i )=P (x i 1<X x i )=F X (x i ) F X (x i 1)for i =2;3;:::For i =1;we have f X (x 1)=F X (x 1)because f X (x 1)=P (X =x 1)=P (X x 1)=F X (x 1)given that x 1is the smallest value that X can take.f X =x 1g =f X x 1g Remark:f X (x )and F X (x )are equivalent ways to describe the discrete random variable X .Given f X (x )or F X (x );we can know “everything”of the probability law of X .Examples of D.R.V.Example[Bernoulli R.V.]:A d.r.v.X is called a Bernoulli(p)random variable if its pmff X(x)= p if x=11 p if x=0;where0<p<1:Remark:This distribution arises when one tosses a coin whose head shows up with probability p:Example[Binomial R.V.]:A d.r.v.X is called a Binomial(n;p)if its pmff X(x)=(n x)p x(1 p)n x;x=0;1;:::;n;where n 0and0<p<1:Remarks:When can this distribution arise?A person throws a coin n times independently. Each time the head has probability p and the tail q=1 p:How many heads can he get from these n trials?Interpretation:X=P n i=1X i;where X i is a sequence of independently identically distribu-tion(i.i.d.).Bernoulli random variable(p):Question:How to verifynX x=0(n x)p x(1 p)n x=1for all p2(0;1)?ANS:By the binomial theorem which states that for any real numbers x and y and integern 0;(x+y)n=nX i=0(n i)x i y n i:See p.90of the textbook.In our application,we put x=p and y=1 p:Question:Why is the binomial distribution useful?Example[Discrete Uniform Distribution]A d.r.v.X is a discrete uniform(1;N)distribution iff X(x)= 1N x=1;:::;N;0otherwise,where N is a speci…ed positive integer.Example[Poisson Distribution]A d.r.v.X follows a Poisson( )distribution if its pmff X(x)= e x x!;x=0;1;:::;0otherwise,where >0:The parameter is called an intensity parameter.Question:What is the interpretation of ?Answer:It is proportional to an instantaneous probability.Question:How to verify1X x=0e x x!=e 1X x=0 x x!=1?Hint:What is the Taylor series expansion of e y?For any y near zero,1X i=0y i i!e y=Put i=x;y= :Remark:Poisson distribution is very popular in…nance.It has been used to capture jumps in …nancial markets.3.3Continuous Random VariablesRead Section3.3De…nition[Continuous Random Variable]A r.v.X is called continuous if its distribution function F X(x)is continuous for all x.Alternatively,a r.v.X is discrete if F X(x)is a step function of x:Picture:F X(x)is a continuous function.A c.r.v.X provides a proper description of income, temperature,stock return,and so on.Question:Can we de…ne a pmf f X(x)for a continuous random variable X?Obviously,for any constant">0;0 P(X=x)P(x "=2<X x+"=2)=F X(x+"=2) F X(x "=2)!0as"!0:Thus,P(X=x)=0for all x:That is,if X is a continuous random variable,the probability that X takes a single point is zero.This has some important implications.For example,for a c.r.v.,we haveP(a<X b)=P(a X<b)=P(a X b):Question:Under what conditions,can we write F X(x)=R x 1f X(y)dy for some function f X(x)? De…nition[Absolute Continuity(AC)]:A function F:R!R is called absolutely contin-uous with respect to Lebesgue measure if F(x)is continuous on R and is di¤erentiable almost everywhere(i.e.for almost all x):Remark:What is meant by“almost everywhere”?Intuitively,in any…nite interval of R;there is a…nite number of points or an in…nite but countable number of points where F X(x)is not di¤erentiable.De…nition[Probability Density Function(pdf)]:Suppose the distribution function F X(x) of a c.r.v.X is absolutely continuous.Then there exists a function f X(x)such thatF X(x)=Z x 1f X(u)du for all x2( 1;1).The function f X(x):R!R is called a probability density function of X.Question:Is f X(x)a unique function for a given F X(x)?Remarks:(i)When the AC condition does not hold,X may not have the above relationship.Throughout this course,we will assume that F X(x)is AC.(ii)For those x’s where F0X(x)exists,we have from the above thatf X(x)=dF X(x) dx:Given that F X(x)is AC,the probability density function f X(x)exists almost everywhere. Question:How to de…ne f X(x)at the points where F0X(x)does not exist?Answer:Arbitrary but try to make f X(x)as smooth as possible.For a c.r.v.X with well-de…ned pdf f X(x);f X(x)and F X(x)are equivalent to each other. Given one,we can always recover the other.(iii)[Interpretation of pdf]:For any small constant">0;we have,by the mean value theoremP[x "=2<X x+"=2]=F X(x+"=2) F X(x "=2)=Z x+"=2x "=2f X(y)dy=f X( x)"for some x2[x "=2;x+"=2](by the mean-value theorem)=probability that X is between(x "=2;x+"=2]: Although f X(x)is not a probability measure,it is proportional to the probability that X takes values in a small interval centered at x:(iv)The fact that P(X=0)=0for a c.r.v.allows us to change the value of the pdf of a continuous random variable X at a single point without altering the distribution of X:For instance,the pdff X(x)= e x for0<x<1;0elsewhere,can be written asf X(x)= e x for0 x<1;0elsewhere,without changing P X(A)for any A in R:We observe these two functions di¤er only at x=0 and P(X=0)=0:More generally,if two pdf’s of continuous random variables di¤er only on a set having probability zero,the two corresponding probability set functions are exactly the same.Unlike the continuous random variables,the pmf of a discrete random variable may not be changed at any point,since a change in such a pmf alters the distribution of probability.(v)Because f X(x)is a slope that determines the change of a probability F X(x),f X(x)can be greater than1.(vi)Remark:Because of the property that P(X=x)=0for all x2R;the values of any pdf f X(x)can be changed at a…nite number of points or even at an in…nite sequence of points, without changing the value of the cdf F X(x):In other words,the values of the pdf of X can be changed arbitrarily at an in…nite sequence of points without a¤ecting any probabilities involving X;that is,without a¤ecting the probability of X:To the extent just described,the pdf is not unique.In many problems,however,there will be one version of the pdf that is more natural than any other pdf.For this reason,the pdf will, wherever possible,be continuous on the real line.Theorem[Properties of pdf]:A function f X(x)is a pdf of a c.r.v.X i¤(a)f X(x) 0for all x and(b)R1 1f X(x)dx=1:Proof:[Necessary]Suppose f X is a pdf,i.e.F X(x)=R x 1f X(y)dy:By the mean value theorem,F X(x+ ) F X(x)=f X( x) ;where x lies between x and x+ :It follows that f X( x) 0since F X( )is nondecreasing.Also,(b)follows because F X(1)=1:[Su¢ciency]The converse can be proved similarly by constructing F X(x)=R x 1f(y)dy and showing that F X(x)is a cdf of some random variable X.First,F X(x)is nondecreasing by the mean valued theorem and(a),F X(1)=1by(b),and F X( 1)=0by(a)and(b).Also, F X(x)=R x 1f(y)dy implies that F X(x)is continuous,becauseF X(x+ ) F X(x)=Z x+ x f(y)dy!0as !0;and so is right-continuous.Therefore,F X(x)is a cdf of some random variable X.Geometric Representation of pdf f X(x):Indicative of mode,skewness or symmetry,heavy tails,and etc.Questions:(i)Is it possible to construct a pdf f(x)from any nonnegative function g(x)with a…nite integral(i.e.,0<R1 1g(x)dx<1)?ANS:Yes,f(x)=g(x)=R1 1g(y)dy:An application in…nance:[stochastic discount factor and risk neutral probability density function]In a dynamic setting,…nancial derivatives prices are determined by the Euler equationE[M t;t+ Y(S t+ )j I t]=P t;where M t;t+ 0is the so-called stochastic discount factor of the representative economic agent, Y(S t+ )is the pay o¤scheme at the maturity date t+ ;S t+ is the price of the underlying asset (e.g.,Standard&Poor500closing price index)at time t+ ;P t is the price of the derivative at time t,and I t is the information available at time t:We can write the Euler equation equivalently as follows:ZM t;t+ Y(s)f t+ (s)ds=P t;where f t+ (s)is the pdf of S t+ conditional on I t:Now de…ne a so-called risk neutral pdff (s t+ j I t)=M t;t+ f t+ (s)E[M t;t+ j I t]=M t;t+ f t+ (s) R M t;t+ f t+ (s)ds:Then the Euler equation can be written ase r E [Y(S t+ )j I t]=P t;ore r Z Y(s)f t+ (s)ds=P t;where r is the compound interest rate,and E ( j I t)is the so-called expectation under the risk neutral pdf f t+ (s):(ii)Is it possible to construct a symmetric pdf f(x)from any nonnegative function g(x)with a…nite integral?Remark:symmetric if f(x)=f( x)for all x:ANS:f(x)=g(x)+g( x)2R1 1g(y)dy:De…nition[Support]:The support of a c.r.v.X is de…ned asSupport(X)=f x2R:f X(x)>0g;where f X(x)is the pdf of X:Remark:It su¢ces to focus on the support of X:Examples of c.r.v.Example [Uniform Distribution]A c.r.v.X follows a uniform distribution on [a;b ]if its pdff X (x )= 1b a a x b 0otherwise,where a <b:Example [Gamma Distribution]a c.r.v.X follows a Gamma ( ; )distribution iff X (x )= 1 ( ) x 1e x= 0<x <10otherwise,where ; >0:Question:What is the gamma function ( )?( )=Z 10t 1e t dt:Properties of ( ):(i) ( +1)= ( );(ii) (n )=(n 1)!if n is a positive integer.(iii) (12)=p :Question:How to verifyZ 10f X (x )dx =Z 101 ( )x 1e x= dx =1?Hint:By change of variable and de…nition of the gamma function.Z 1 1f X (x )dx =Z 101 ( ) x 1e x= dx =1 ( )Z 10(x= ) 1e (x= )d (x= )(set y =x= )=1 ( )Z 10y 1e y dy =1 ( ) ( )=1:Remark:The Gamma distribution has been popularity used to model the waiting time of economic events.Example[Exponential Distribution]X follows Exponential( )iff X(x)= 1 e x= 0<x<10otherwise,where >0:Remarks:(i)Exponential( )=Gamma(1; ):(ii)Exponential Distribution is popular in modelling duration between…nancial events or economic events.An example in labor economics:Let T be the unemployment duration of a worker which has a pdf f T(t).Then the so-called hazard rate is de…ned as(t)=limt!0+P(T t+ t j T t)t=f T(t)P(T t);which is the instantaneous probability that the worker will…nd a job after an umemployment duration of t:A simplest example is to assume thatf(t)=1e t= for t>0:Then the hazard rate will become(t)=1 ;which is a constant of time.(iii)An empirical stylized fact of high-frequency…nancial return f X t g is that j X t j approxi-mately follows an exponential distribution(see Ding,Granger and Engle1993,Journal of Em-pirical Finance.)Here,X t is the standardized…nancial return.Example[Normal Distribution]A normally distributed random variable,X N( ; 2);has thepdff X(x)=1p2 e (x )22 2; 1<x<1;where 1< <1and0< <1:Remark:A normal distribution is also called Gaussian distribution.Why?Answer:The normal distribution was discovered in1733by Abraham De Moivre(1667-1754)in his investigation of apprxomating coin tossing probabilities.he named the PDF of his discovery the exponetially bell-shaped curve.In1809,Carlk Friedrich Gauss(1777-1855)…rmly established the importance of the normal distribution by using it to predict the location of astronmical bodies.As a result,the normal distribution then became commonly known as the Gaussian distribution.Remarks:(i)X is called standard normal,denoted X N(0;1);if =0and =1:(ii)Normal distribution is the most important distribution in probability theory.The Central Limit Theorem(CLT)says that under suitable conditions,a sample average will converge to a normal distribution as the sample size increases.1 p nnX i=1X i!Normal distribution as n!1.This follows no matter whether X i is discrete or continuous,is compact supported or uncompact supported.(iii)Question:How to verifyZ1 11p2 exp (x )22 2 dx=1?Put y=(x )= :Then it becomesZ1 11p2 exp y22 dy=1:Question:How to verify this?Z1 1e x22dx 2=Z1 1e x22dx Z1 1e y22dy=Z1 1Z1 1e x2+y22dxdy(set x=r cos( );y=r sin( ))=Z10Z2 0e r22rdrd=2 Z10e r22rdr=2 :It follows that1p2 Z1 1e x22dx=1:Example[Beta distribution]X follows a Beta( ; )distribution iff X(x)= 1B( ; )x 1(1 x) 10<x<1;0otherwise,。
洪永淼教授谈计量经济学
洪永淼教授谈计量经济学萧瑟秋:洪教授:您在《计量经济学的地位、作用和局限》一文中认为:尽管经济学和金融学研究的一般方法论与自然科学研究的方法论非常相似,都是从观察、抽象、检验到应用这些步骤,但是经济学和金融学还远未达到自然科学(比如物理学)那样成熟的境界。
您强调,计量经济学所面临的局限性不是计量经济学本身所特有的,而是整个经济学科所面临的局限性。
事实上,正是由于经济系统的非实验性、不可逆性和时变性,以及经济数据的种种缺陷,计量经济学理论本身的发展已相对成熟和全面。
请问:1.既然经济系统与自然科学研究对象存在那么大的——甚至可以说是本质的差别,为什么经济学和金融学研究的一般方法论,还要与自然科学研究的方法论非常相似?洪永淼:经济系统和自然系统确实有很大差别,但经济理论和自然科学理论都有一个共同点,即都是为了解释研究对象的现象,而不论是经济现象或自然现象,很多均可用数据来描述,这是经济学一般方法论和自然科学方法论非常相似的基础。
更为重要的是,人们在经济活动决策或者在介绍经济现象时,常常需要对经济行动或结果进行“量化”。
例如,众所周知,厌恶风险的投资者面临风险时,需要一定的风险补偿,确定风险补偿的决策因素及大小是十分需要的,这实际上是资本(包括金融衍生品)定价的基本问题。
萧瑟秋: 您谈到,Clive Granger 04年被邀请到泰国时,泰国国王让他当场对泰国未来经济做出预测!这些都是不可能做到的事;由2个诺贝尔经济学奖得主创立的长期资本投资公司的破产,就生动的说明学界好手和商界好手完全是两码事。
我是不是可以说,即便计量经济学理论本身完美无缺,但它仍然无法让经济学家恰当预测?我们是不是该反省:计量经济学理论,放在经济学这里是不是被糟蹋了?这究竟是谁的问题?您的意思好像是:计量经济学理论没有问题,问题在于经济系统没有为该理论提供准确预测的基础?洪永淼:即使经济理论包括计量经济学理论本身完美无缺,仍然无法让经济学家作出精确预测。
《计量经济学》课程教学大纲
《计量经济学》课程教学大纲英文名称:Econometric课程代码:221102004课程类别:专业核心课课程性质:必修开课学期:第四学期总学时:54(讲课:36,实验0,实践18,网络0)总学分:3考核方式:作业先修课程:高等数学、微观经济学、宏观经济学、统计学适用专业:经济学一、课程简介《计量经济学》是经济学专业的一门专业核心课程。
本课程以高等数学、宏微观经济学、统计学为先修课程,系统讲授计量经济学的基础理论、一元和多元线性回归模型、非线性回归模型的线性化、异方差、自相关、多重共线性、模型中特殊的解释变量以及Eviews基础操作等内容,为全国大学生市场调查与分析大赛以及毕业论文作理论与实践兼具的准备。
该课程分别从理论授课、软件学习以及团队实训等三个维度全面提高学生的思想水平、政治觉悟、道德品质及文化素养,重点培养学生经济学专业知识与技能,使其具有较为扎实的专业知识储备、数据分析的能力、实践与创新能力。
二、课程目标及其对毕业要求的支撑总体目标:全面提高学生的政治素养和道德品质,重点培养学生经济统计专业知识与技三、课程内容及要求第一章绪论教学内容:第一节计量经济学的定义与类型1.计量经济学的定义2.计量经济学的类型第二节计量经济学的特征1.经典计量经济学在理论方法方面特征2.经典计量经济学在应用方法方面特征第三节计量经济学的目的及研究问题的步骤1.计量经济学的目的2.计量经济学研究问题的步骤3.Eviews软件介绍学生学习预期成果:1.理解计量经济学的含义2.理解计量经济学的类型与特征3.了解计量经济学的目的及研究问题的步骤4.了解Eviews软件并下载安装成功教学重点:计量经济学的含义;计量经济学研究问题的步骤;Eviews软件介绍。
教学难点:计量经济学的含义;计量经济学研究问题的步骤。
第二章一元线性回归模型教学内容:第一节模型的建立及其假定条件1.回归分析的概念2.一元线性回归模型的介绍3.随机误差项的假定条件第二节一元线性回归模型的参数估计1.普通最小二乘法的概念2.参数估计第三节最小二乘估计量的统计性质1.线性性2.无偏性3.最小方差性第四节用样本可决系数检验回归方程的拟合优度1.总离差平方和的分解2.样本可决系数及相关系数第五节回归系数估计值的显著性检验与置信区间1.随机变量u的方差2.t检验3.置信区间第六节一元线性回归方程的预测1.点预测2.区间预测第七节案例分析1.用Eviews软件研究分析我国城镇居民年人均可支配收入与年人均消费性支出之间的关系学生学习预期成果:1.掌握回归分析的概念2.掌握随机误差项的假定条件3.掌握一元线性回归模型的参数估计4.熟悉最小二乘估计量的统计性质5.掌握用样本可决系数检验回归方程的拟合优度6.掌握回归系数估计值的显著性检验7.掌握Eviews软件的基础操作教学重点:回归分析的概念;随机误差项的假定条件;一元线性回归模型的参数估计;Eviews软件的基础操作。
洪永淼计量经济学讲义_ch03
of causation must come from outside statistics ultimately, from some theory or other.”
Assumption 3.1 only implies a predictive relationship: Given Xt, can we predict Yt linearly?
1
coe¢ cient vector. When the linear model is correctly for the conditional mean E(YtjXt),
i.e., when E("tjXt) = 0; the parameter
0
=
@ @Xt
E
(Yt
jXt
)
is
the
marginal
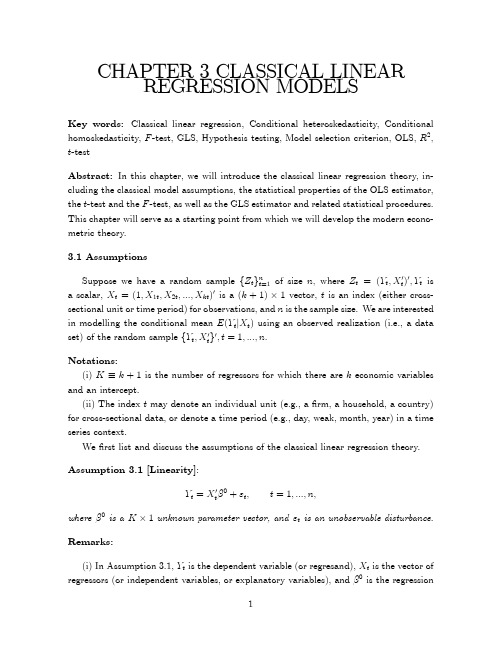
Notations: (i) K k + 1 is the number of regressors for which there are k economic variables
计量经济学与实验经济学的若干新近发展及展望_洪永淼

计量经济学与实验经济学的若干新近发展及展望_洪永淼2016年3月第2期(总第295期)ChinaEconomicStudiesMarch2016No.2计量经济学与实验经济学的若干新近发展及展望洪永淼方颖陈海强范青亮耿森王云内容提要:计量经济学与实验经济学是经济学实证分析的重要方法与工具。
本文主要概括了近十年来计量经济学与实验经济学领域的主要进展,包括面板数据计量经济学、微观计量经济学、大数据计量经济学、金融计量经济学、宏观计量经济学、新类型实验数据、非均衡博弈论框架以及市场机制与政策设计等方向。
我们建议重点发展计量经济学与实验经济学在中国社会经济政策评估与分析方面的方法与理论的创新及应用,推动政府决策的科学化。
关键词:计量经济学;实验经济学;政策评估;决策科学化一、引言并在此基础上建立相应的经济理论或经经济研究的方法在于总结典型的经验特征与收集数据,济模型。
经济研究的科学性在很大程度上取决于经济理论或经济模型的可验证性,即能否通过数据实证检验相关的经济理论与经济模型来解释事实,并预测未来的经济变动趋势以及提供科学的政策建议。
计量经济学和实验经济学则犹如硬币的双面,从不同的角度为经济学的实证分析提供重要的方法论基础。
计量经济学以实际经济数据的建模与分析为主要研究对象。
当实际数据不可得,或实际数据过于复杂而导致因果关系不易梳理时,实验经济学则有可能从另一个角度出发,通过可控的实验数据代替实际数据,成为实证经济分析的又一个有利工具。
计量经济学是由经济学、统计学、数学、计算机科学等学科交叉产生而又独立于其中任何一个学科。
计量经济学产生于对经济理论的实证分析,经济系统的建模和国民经济投入产出法的计算等经济学问题,经过近一个多世纪的发展,已经成为了一个成熟而且被广泛运用的学科。
计量经济学可以分为理论计量经济学和应用计量经济学。
其中理论计量经济学主要关注计量经济模型的建立,包括针对不同数据类型、随机实验和不可控随机误差的分布形式、经济学模型和实际问题而进行的假设,从而对该模型进行参数、非参数等的估计、统计推断和预测,并给出其具体的理论性质,例如无偏性,渐进分布、统计有效性、预测误差等等。
理解现代计量经济学 洪永淼 笔记
理解现代计量经济学洪永淼笔记现代计量经济学是经济学中的一门重要学科,它运用数理统计和经济理论的工具,对经济现象进行定量分析和研究。
洪永淼笔记是当前研究中的一本权威著作,本文将针对这本笔记展开详细的解读和理解。
第二章计量经济学的基本概念在理解现代计量经济学之前,我们首先需要了解一些计量经济学的基本概念。
计量经济学是运用统计方法和经济学理论来分析经济数据的一门学科。
在研究中,我们通常会涉及到回归分析、时间序列分析、横截面分析等方法。
第三章回归分析回归分析是计量经济学中一种常用的方法,它用于研究因果关系和预测模型。
洪永淼笔记详细介绍了回归分析的原理和应用。
我们将学习如何建立回归模型,如何进行参数估计以及如何进行假设检验等内容。
第四章时间序列分析时间序列分析是计量经济学中另一种重要的分析方法,它用于研究经济变量随时间发展的规律。
在洪永淼笔记中,我们将深入理解时间序列的平稳性、自相关性以及预测方法等内容。
第五章横截面分析横截面分析是计量经济学中研究不同个体之间差异的方法,它用于研究经济变量在某一时间点上的表现。
在本章中,我们将学习如何进行横截面数据的分析和处理,如何进行假设检验以及如何进行解释与推断等内容。
第六章面板数据分析面板数据分析是计量经济学中考虑时间和个体的双重维度的分析方法,它能够更全面地研究经济变量的影响因素。
在洪永淼笔记中,我们将学习如何构建面板数据模型以及如何进行估计与推断等技巧。
第七章计量经济模型的评价与选择在计量经济学中,评价和选择合适的模型是非常重要的。
本章将介绍常见的模型评价准则,如残差分析、拟合优度和信息准则等,并探讨模型选择的原则和方法。
第八章典型计量经济模型洪永淼笔记中还涵盖了一些典型的计量经济模型,如线性回归模型、面板数据模型和时间序列模型等。
本章将深入理解这些模型的假设、估计和推断方法,并学习如何应用到实际问题中。
通过对《理解现代计量经济学洪永淼笔记》的解读和理解,我们进一步了解了计量经济学的基本概念和方法。
洪永淼计量经济学讲义_ch01
Lecture Notes onADV ANCED ECONOMETRICSY ongmiao HongDepartment of Economics,Department of Statistical Science andCenter for Financial EngineeringCornell UniversityEmail:yh20@F ALL2006c 2006Yongmiao Hong.All rights reserved.T ables of ContentsChapter1Introduction to Econometrics1.1Quantitative Features of Modern Economics1.2Mathematical Modeling1.3Econometric Analysis1.4Motivating ExamplesChapter2General Regression Analysis2.1Conditional Probability Distribution2.2Regression Analysis2.3Linear Regression Modeling2.4Correct Model Speci…cationChapter3Classical Linear Regression Models3.1Framework and Assumptions3.2OLS Estimation3.3Goodness of Fit and Model Selection Criteria3.4Consistency and E¢ciency of OLS3.5Sampling Distribution of OLS3.6Variance Matrix Estimator for OLS3.7Hypothesis Testing3.8Generalized Least Squares(GLS)Estimation3.9Empirical Applications3.9.1Foreign Applications3.9.2Chinese ApplicationsChapter4Linear Regression Models with I.I.D.Observations 4.1Introduction to Asymptotic Analysis4.2Framework and Assumptions4.3Consistency of OLS4.4Asymptotic Normality of OLS4.5Asymptotic Variance Estimator for OLS4.5.1The Case of Conditional Homoskedasticity4.5.2The Case of Conditional Heteroskedasticity4.6Hypothesis Testing4.7Testing for Conditional Homoskedasticity4.8Empirical Applications to Cross-Sectional Data4.8.1Foreign Applications4.8.2Chinese ApplicationsChapter5Linear Regression Models with Dependent Observations5.1Basic Concepts in Time Series Analysis5.2Framework and Assumptions5.3Consistency of OLS5.4Asymptotic Normality of OLS5.5Asymptotic Variance Estimator for OLS5.5.1The Case of Conditional Homoskedasticity5.5.2The Case of Conditional Heteroskedasticity5.6Hypothesis Testing5.7Testing for Serial Correlation5.8Empirical Applications to Time Series Data5.8.1Foreign Applications5.8.2Chinese ApplicationsChapter6Linear Regression Models with Heteroskedastic and Autocorrelated Disturbances6.1Framework,Assumptions and Motivating Examples6.2Long-run Variance Estimation6.3Consistency of OLS6.4Asymptotic Normality of OLS6.5Hypothesis Testing6.6Empirical Applications6.6.1Foreign Applications6.6.2Chinese ApplicationsChapter7Instrumental Variable Regressions7.1Framework,Assumptions,and Motivating Examples7.2Two-Stage Least Squares(2SLS)Estimation7.3Consistency of2SLS7.4Asymptotic Normality of2SLS7.5Interpretation and Estimation of the2SLS Asymptotic Variance7.6Hypothesis Testing7.7Empirical Applications7.7.1Foreign Applications7.7.2Chinese ApplicationsChapter8Generalized Method of Moments Estimation8.1Method of Moments Estimation8.2Generalized Method of Moments(GMM)Estimation8.3Consistency of GMM8.4Asymptotic Normality of GMM8.5Asymptotic E¢ciency of GMM8.6Asymptotic Variance Estimation8.7Hypothesis Testing8.8Model Speci…cation Testing8.9Empirical Applications8.9.1Foreign Applications8.9.2Chinese ApplicationsChapter9Maximum Likelihood Estimation and Quasi-Maximum Likelihood Estimation9.1Motivating Examples9.2Maximum Likelihood Estimation(MLE)and Quasi-MLE9.3Asymptotic Properties of MLE/QMLE9.3.1Consistency9.3.2Asymptotic Normality9.3.3E¢ciency9.4MLE-based Hypothesis Testing9.4.1Wald Test9.4.2Lagrange Multiplier Test9.4.3Likelihood Ratio Test9.5QMLE-based Hypothesis Testing9.5.1Impact of Model Misspeci…cation9.5.2Wald Test9.5.3Lagarnge Multiplier Test9.6Model Speci…cation Testing9.7Empirical Applications3.7.1Foreign Applications3.7.2Chinese ApplicationsChapter10ConclusionAppendix A Introduction to Linear AlgebraAppendix B Asymptotic Tools in EconometricsReferencesPrefaceModern economies are full of uncertainties and risk.Economics studies resource allocations in an uncertain market environment.As a generally applicable analytic tool for uncertain events, probability and statistics have been playing an important role in economic research.Econometrics is statistical analysis of economic and…nancial data.It has become an integral of training in modern economics and business.This book develops a coherent set of econometric theory and methods for economic models.It is written for an advanced econometrics course for doctoral students in economics,business and management.Chapter1is a general introduction to econometrics.It…rst describes the two most important features of modern economics,namely mathematical modeling and empirical veri…cation,and then discusses the role of econometrics as a methodology in empirical studies.A few motivating economic motivated examples are given to illustrate how econometrics can be used in empirical studies.Finally,it points out the limitations of econometrics and economics due to the fact that an economy is not a repeatedly controlled experiment.Assumptions and careful interpretations are needed when conducting empirical studies in economics and…nance.Chapter2introduces a general regression analysis.Regression analysis is modeling,esti-mation,inference,and speci…cation analysis of the conditional mean of economic variables of interest given a set of explanatory variables.It is most widely applied in economics.Among other things,this chapter interprets the mean squared error and its optimizer,which lays down the probability-theoretic foundation for least squares estimation.In particular,it provides an interpretation for the least squares estimator and its relationship with the true model parameter.Chapter3introduces the classical linear regression analysis.A set of classical assumptions are given and discussed,and conventional statistical procedures for estimation,inference,and hypothesis testing are introduced.We also discuss the generalized least squares estimation as an e¢cient estimation method of a linear regression model when the variance-covariance matrix is known up to a constant.In particular,the generalized least squares estimation is embedded as an ordinary least squares estimation of a suitably transformed regression model via conditional variance scaling.The subsequent chapters4–7are the generalizations of classical linear regression analysis when various classical assumptions fail.Chapter4…rst relaxes the normality and conditional homoskedasticity assumptions,two key conditions assumed in classical linear regression modeling. An large sample theoretic approach is taken.For simplicity,it is assumed that the observed data is generated from an independent and identically distributed random sample.It is shown that while the…nite distributional theory is no longer valid,the classical statistical procedures are stillapproximately applicable when the sample size is large,if conditional homoskedasticity holds.In contrast,if the data displays conditional heteroskedasticity holds,classical statistical procedures are not applicable even for large samples.In contrast,heteroskedasticity-robust procedures are called for.Chapter5extends the linear regression theory to time series data.First,it introduces a variety of basic concepts in time series analysis.Then it shows that the large sample theory for i.i.d.random samples carries over to stationary ergodic time series data if the regression error follows a martingale di¤erence sequence.Chapter6extends the large sample theory to a very general case where there exist conditional heteroskedasticity and autocorrelation.In this case,the classical regression theory cannot be used,and a long-run variance-covariance estimator is called for to validate statistical inferences.Chapter7is the instrumental variable estimation for linear regression models,where the regression error is correlated with the regressors.This can arise due to measurement errors and simultaneous equation biases.Two stage-least squares estimation method and related statistical inference procedures are fully exploited.Chapter8introduces the generalized method of moments,which is a popular estimation method for possibly nonlinear econometric models characterized as a moment condition.Indeed, most economic theories,such as rational expectations,can be formulated by a moment condi-tion.The generalized method of moments is particularly suitable to estimate model parameters contained in the moment condition.Chapter9introduces the maximum likelihood estimation and the quasi-maximum likelihood estimation methods for conditional probability models and other nonlinear econometric models.Chapter10concludes the book by summarizing the main econometric theory and methods covered in this book,and pointing out directions for further buildup in econometrics.The appendix contains a relatively comprehensive review of asymptotic analytic tools that are needed for this course.By going through this book,students will learn how to do asymptotic analysis for econometric models.Such skills are useful not only for those students who intend to work on theoretical econometrics,but also for those who intend to work on applied subjects in economics because with such analytic skills,students will be able to understand more specialized or more advanced econometrics textbooks.This book is based on my lecture notes taught at Cornell University,Renmin University of China,Shandong University,Shanghai Jiao Tong University,Tsinghua University,and Xiamen University,where the graduate students provide rather detailed comments on my lecture notes.CHAPTER1INTRODUCTION TOECONOMETRICSKey W ords:Data generating process,Econometrics,Probability law,Statistics.Abstract:Econometrics has become an integral part of training in modern economics and business.Together with microeconomics and macroeconomics,econometrics has been taught as one of the three core courses in most undergraduate and graduate economic programs in North America.In China,the importance of econometrics has been increasingly recognized and econometric tools and methods have been widely employed in empirical studies on Chinese economy.This chapter discusses the philosophy and methodology of econometrics in economic research,the roles and limitations of econometrics,and the di¤erences between econometrics and mathematical economics as well as mathematical statistics.A variety of illustrative econometric examples are given,which cover various…elds of economics and…nance.1.1IntroductionEconometrics has become an integrated part of teaching and research in modern economics and business.The importance of econometrics has been increasingly recognized in China.In this chapter,we will discuss the philosophy and methodology of econometrics in economic re-search.First,we will discuss the qualitative feature of modern economics,and the di¤erences between econometrics and mathematical economics as well as mathematical statistics.Then we will focus on the important roles of econometrics as a fundamental methodology in economic research via a variety of illustrative economic examples including the consumption function, marginal propensity to consume and multipliers,rational expectations models and dynamic as-set pricing,the constant return to scale and regulations,evaluation of e¤ects of economic reforms in a transitional economy,the e¢cient market hypothesis,modeling uncertainty and volatility, and duration analysis in labor economics and…nance.These examples range from econometric analysis of the conditional mean to the conditional variance to the conditional distribution of economic variables of interest.we will also discuss the limitations of econometrics,due to the nonexperimental nature of economic data and the time-varying nature of econometric structures. Finally,problems in current econometric teaching and research in China are pointed out,and possible solutions are proposed.1.2Quantitative Features of Modern EconomicsModern market economies are full of uncertainties and risk.When economic agents make a decision,the outcome is usually unknown in advance and economic agents will take this uncer-tainty into account in their decision-making.Modern economics is a study on scarce resourceallocations in an uncertain market environment.Generally speaking,modern economics can be roughly classi…ed into four categories:macroeconomics,microeconomics,…nancial economics, and econometrics.Of them,macroeconomics,microeconomics and econometrics now consti-tute the core courses for most economic doctoral programs in North America,while…nancial economics is now mainly being taught in business and management schools.Most doctoral programs in economics in the U.S.emphasize quantitative analysis.Quantita-tive analysis consists of mathematical modeling and empirical studies.To understand the roles of quantitative analysis,it may be useful to…rst describe the general process of modern economic research.Like most natural science,the general methodology of modern economic research can be roughly summarized as follows:Step1:Data collection and summary of empirical stylized facts.The so-called stylized facts are often summarized from observed economic data.For example,in microeconomics,a well-known stylized fact is the Engel’s curve,which characterizes that the share of a con-sumer’s expenditure on a commodity out of her or his total income will eventually decline as the income increases;in macroeconomics,a well-known stylized fact is the Phillips Curve, which characterizes a negative correlation between the in‡ation rate and the unemployment rate in an aggregate economy;and in…nance,a well-known stylized fact about…nancial markets is volatility clustering,that is,a high volatility today tends to be followed by another high volatility tomorrow,a low volatility today tends to be followed by another low volatility tomorrow,and both alternate over time.The empirical stylized facts often serve as a starting point for economic research.For example,the development of unit root and cointegration econometrics was mainly motivated by the empirical study of Nelson and Plossor(1982)who found that most macroeconomic time series are unit root processes. Step2:Development of economic theories/models.With the empirical stylized facts in mind,economists then develop an economic theory or model in order to explain them.This usually calls for specifying a mathematical model of economic theory.In fact,the objective of economic modelling is not merely to explain the stylized facts,but to understand the mechanism governing the economy and to forecast the future evolution of the economy. Step3:Empirical veri…cation of economic models.Economic theory only suggests a qualita-tive economic relationship.It does not o¤er any concrete functional form.In the process of transforming a mathematical model into a testable empirical econometric model,one often has to assume some functional form,up to some unknown model parameters.One need to estimate unknown model parameters based on the observed data,and check whether the econometric model is adequate.An adequate model should be at least consistent with the empirical stylized facts.Step4:Applications.After an econometric model passes the empirical evaluation,it can then be used to test economic theory or hypotheses,to forecast future evolution of the economy,and to make policy recommendations.For an excellent example highlighting these four steps,see Gujarati(2006,Section1.3)on labor force participation.We note that not every economist or every research paper has to complete these four steps.In fact,it is not uncommon that each economist may only work on research belonging to certain stage in his/her entire academic lifetime.From the general methodology of economic research,we see that modern economics has two important features:one is mathematical modeling for economic theory,and the other is empirical analysis for economic phenomena.These two features arise from the e¤ort of several generations of economists to make economics a"science".To be a science,any theory must ful…ll two criteria: one is logical consistency and coherency in theory itself,and the other is consistency between theory and stylized facts.Mathematics and econometrics serve to help ful…ll these two criteria respectively.This has been the main objective of the econometric society.The setup of the Nobel Memorial Prize in economics in1969may be viewed as the recognition of economics as a science in the academic profession.1.3Mathematical ModellingWe…rst discuss the role of mathematical modeling in economics.Why do we need mathe-matics and mathematical models in economics?It should be pointed out that there are many ways or tools(e.g.,graphical methods,verbal discussions,mathematical models)to describe eco-nomic theory.Mathematics is just one of them.To ensure logical consistency of the theory,it is not necessary to use mathematics.Chinese medicine is an excellent example of science without using mathematical modeling.However,mathematics is well-known as the most rigorous logical language.Any theory,when it can be represented by the mathematical language,will ensure log-ical consistency and coherency of economic theory,thus indicating that it has achieved a rather sophisticated level.Indeed,as Karl Marx pointed out,the use of mathematics is an indication of the mature development of a science.It has been a long history to use mathematics in economics.In his Mathematical Principles of the Wealth Theory,Cournot(1838)was among the earliest to use mathematics in economic analysis.Although the marginal revolution,which provides a cornerstone for modern economics, was not proposed using mathematics,it was quickly found in the economic profession that the marginal concepts,such as marginal utility,marginal productivity,and marginal cost,correspond to the derivative concepts in calculus.Walras(1874),a mathematical economist,heavily used mathematics to develop his general equilibrium theory.The game theory,which was proposed by Von Neumann and Morgenstern(1944)and now becomes a core in modern microeconomics, originated from a branch in mathematics.Why does economics need mathematics?Brie‡y speaking,mathematics plays a number of important roles in economics.First,the mathematical language can summarize the essence of a theory in a very concise manner.For example,macroeconomics studies relationships between aggregate economic variables(e.g.,DGP,consumption,unemployment,in‡ation,interest rate, exchange rate,and etc.)A very important macroeconomic theory was proposed by Keynes (1936).The classical Keynesian theory can be summarized by two simple mathematical equa-tions:National Income identity:Y=C+I+G;Consumption function:C= + Y;where Y is income,C is consumption,I is private investment,G is government spending, is the“survival level”consumption,and is the marginal propensity to consume.Substituting the consumption function into the income identity,arranging terms,and taking a partial derivative, we can obtain the multiplier e¤ect of(e.g.)government spending@Y @G =11:Thus,the Keynesian theory can be e¤ectively summarized by two mathematical equations.Second,complicated logical analysis in economics can be greatly simpli…ed by using math-ematics.In introductory economics,economic analysis can be done by verbal descriptions or graphical methods.These methods are very intuitive and easy to grasp.One example is the partial equilibrium analysis where a market equilibrium can be characterized by the intersection of the demand curve and the supply curve.However,in many cases,economic analysis cannot be done easily by verbal languages or graphical methods.One example is the general equilib-rium theory…rst proposed by Walras(1874).This theory addresses a fundamental problem in economics,namely whether the market force can achieve an equilibrium for a competitive mar-ket economy where there exist many markets and when there exist mutual interactions between di¤erent markets.Suppose there are n goods,with demand D i(P);supply S i(P)for good i; where P=(P1;P2;:::;P n)0is a price vector for n goods.Then the general equilibrium analysis addresses whether there exists an equilibrium price vector P such that all markets are clear simultaneously:D i(P )=S i(P )for all i2f1;:::;n g:Conceptually simple,it is rather challenging to give a de…nite answer because both the demand and supply functions could be highly nonlinear.Indeed,Walras was unable to establish this theory formally.It was satisfactorily solved by Arrow and Debreu many years later,when they used the…xed point theorem in mathematics to prove the existence of an equilibrium price vector.The power and magic of mathematics was clearly demonstrated in the development of the general equilibrium theory.Third,mathematical modeling is a necessary path to empirical veri…cation of an economic theory.Most economic and…nancial phenomena are in form of data(indeed we are in a digital era!).We need“digitalize”economic theory so as to link the economic theory to data.In particular,one need to formulate economic theory into a testable mathematical model whose functional form or important structural model parameters will be estimated from observed data.1.4Empirical V eri…cationWe now turn to discuss the second feature of modern economics:empirical analysis of an economic theory.Why is empirical analysis of an economic theory important?The use of mathematics,although it can ensure logical consistency of a theory itself,cannot ensure that economics is a science.An economic theory would be useless from a practical point of view if the underlying assumptions are incorrect or unrealistic.This is the case even if the mathematical treatment is free of errors and elegant.As pointed out earlier,to be a science,an economic theory must be consistent with reality.That is,it must be able to explain historical stylized facts and predict future economic phenomena.How to check a theory or model empirically?Or how to validate an economic theory?In practice,it is rather di¢cult or even impossible to check whether the underlying assumptions of an economic theory or model are correct.Nevertheless,one can confront the implications of an economic theory with the observed data to check if they are consistent.In the early stage of economics,empirical veri…cation was often conducted by case studies or indirect veri…cations. For example,in his well-known Wealth of Nations,Adam Smith(1776)explained the advantage of specialization using a case study example.Such a method is still useful nowadays,but is no longer su¢cient for modern economic analysis,because economic phenomena is much more com-plicated while data may be limited.For rigorous empirical analysis,we need to use econometrics. Econometrics is the…eld of economics that concerns itself with the application of mathemati-cal statistics and the tools of statistical inference to the empirical measurement of relationships postulated by economic theory.It was founded as a scienti…c discipline around1930as marked by the founding of the econometric society and the creation of the most in‡uential economic journal—Econometrica in1933.Econometrics has witnessed a rather rapid development in the past several decades,for a number of reasons.First,there is a need for empirical veri…cation of economic theory,and for forecasting using economic models.Second,there is more and more high-quality economic data available.Third,advance in computing technology has made the cost of computation cheaper and cheaper over time.The speed of computing grows faster than the speed of data accumulation.Although not explicitly stated in most of the econometric literature,modern econometrics is essentially built upon on the following fundamental axioms:Any economy can be viewed as a stochastic process governed by some probability law. Economic phenomenon,as often summarized in form of data,can be reviewed as a realiza-tion of this stochastic data generating process.There is no way to verify these axioms.They are the philosophic views of econometricians toward an economy.Not every economist or even econometrician agrees with this view.For example,some economists view an economy as a deterministic chaotic process which can generate seemingly random numbers.However,most economists and econometricians(e.g.,Granger and Terasvirta1993,Lucas1977)view that there are a lot of uncertainty in an economy,and they are best described by stochastic factors rather than deterministic systems.For instance,the multiplier-accelerator model of Samuelson(1939)is characterized by a deterministic second-order di¤erence equation for aggregate output.Over a certain range of parameters,this equation produces deterministic cycles with a constant period of business cycles.Without doubt this model sheds deep insight into macroeconomic‡uctuations.Nevertheless,a stochastic framework will provide a more realistic basis for analysis of periodicity in economics,because the observed periods of business cycles never occur evenly in any economy.Frisch(1933)demonstrates that a structural propagation mechanism can convert uncorrelated stochastic impulses into cyclical outputs with uneven,stochastic periodicity.Indeed,although not all uncertainties can be well characterized by probability theory,probability is the best quantitative analytic tool to describe uncertainties.The probability law of this stochastic economic system,which characterizes the evolution of the economy,can be viewed as the“law of economic motions.”Accordingly,the tools and methods of mathematical statistics will provide the operating principles.One important implication of the fundamental axioms is that one should not hope to de-termine precise,deterministic economic relationships,as do the models of demand,production, and aggregate consumption in standard micro-and macro-economic textbooks.No model could encompass the myriad essentially random aspects of economic life(i.e.,no precise point forecast is possible,using a statistical terminology).Instead,one can only postulate some stochastic economic relationships.The purpose of econometrics is to infer the probability law of the eco-nomic system using observed data.Economic theory usually takes a form of imposing certain restrictions on the probability law.Thus,one can test economic theory or economic hypotheses by checking the validity of these restrictions.It should be emphasized that the role of mathematics is di¤erent from the role of econometrics. The main task of mathematical economics is to express economic theory in the mathematical form of equations(or models)without regard to measurability or empirical veri…cation of economic theory.Mathematics can check whether the reasoning process of an economic theory is correct and sometime can give surprising results and conclusions.However,it cannot check whether an economic theory can explain reality.To check whether a theory is consistent with reality, one needs econometrics.Econometrics is a fundamental methodology in the process of economicanalysis.Like the development of a natural science,the development of economic theory is a process of refuting the existing theories which cannot explain newly arising empirical stylized facts and developing new theories which can explain them.Econometrics rather than mathematics plays a crucial role in this process.There is no absolutely correctly and universally applicable economic theory.Any economic theory can only explain the reality at certain stage,and therefore, is a“relative truth”in the sense that it is consistent with historical data available at that time. An economic theory may not be rejected due to limited data information.It is possible that more than one economic theory or model coexist simultaneously,because data does not contain su¢cient information to distinguish the true one(if any)from false ones.When new data becomes available,a theory that can explain the historical data well may not explain the new data well and thus will be refuted.In many cases,new econometric methods can lead to new discovery and call for new development of economic theory.Econometrics is not simply an application of a general theory of mathematical statistics. Although mathematical statistics provides many of the operating tools used in econometrics, econometrics often needs special methods because of the unique nature of economic data,and the unique nature of economic problems at hand.One example is the generalized method of moment estimation(Hansen1982),which was proposed by econometricians aiming to estimate rational expectations models which only impose certain conditional moment restrictions charac-terized by the Euler equation and the conditional distribution of economic processes is unknown (thus,the classical maximum likelihood estimation cannot be used).The development of unit root and cointegration(e.g.,Engle and Granger1987,Phillips1987),which is a core in modern time series econometrics,has been mainly motivated from Nelson and Plosser’s(1982)empirical documentation that most macroeconomic time series display unit root behaviors.Thus,it is necessary to provide an econometric theory for unit root and cointegrated systems because the standard statistical inference theory is no longer applicable.The emergence of…nancial econo-metrics is also due to the fact that…nancial time series display some unique features such as persistent volatility clustering,heavy tails,infrequent but large jumps,and serially uncorrelated but not independent asset returns.Financial applications,such as…nancial risk management, hedging and derivatives pricing,often call for modeling for volatilities and the entire conditional probability distributions of asset returns.The features of…nancial data and the objectives of …nancial applications make the use of standard time series analysis quite limited,and therefore, call for the development of…nancial bor economics is another example which shows how labor economics and econometrics have bene…ted from each bor economics has advanced quickly over the last few decades because of availability of high-quality labor data and rigorous empirical veri…cation of hypotheses and theories on labor economics.On the other hand,microeconometrics,particularly panel data econometrics,has also advanced quickly due to the increasing availability of microeconomic data and the need to develop econometric theory。
洪永淼教授推荐的计量经济学教材
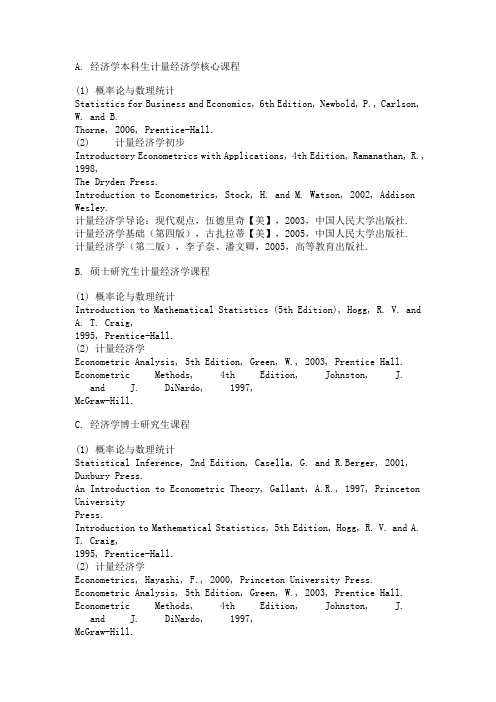
A. 经济学本科生计量经济学核心课程(1) 概率论与数理统计Statistics for Business and Economics, 6th Edition, Newbold, P., Carlson, W. and B.Thorne, 2006, Prentice-Hall.(2) 计量经济学初步Introductory Econometrics with Applications, 4th Edition, Ramanathan, R., 1998,The Dryden Press.Introduction to Econometrics, Stock, H. and M. Watson, 2002, Addison Wesley.计量经济学导论:现代观点,伍德里奇【美】,2003,中国人民大学出版社. 计量经济学基础(第四版),古扎拉蒂【美】,2005,中国人民大学出版社. 计量经济学(第二版),李子奈、潘文卿,2005,高等教育出版社.B. 硕士研究生计量经济学课程(1) 概率论与数理统计Introduction to Mathematical Statistics (5th Edition), Hogg, R. V. and A. T. Craig,1995, Prentice-Hall.(2) 计量经济学Econometric Analysis, 5th Edition, Green, W., 2003, Prentice Hall. Econometric Methods, 4th Edition, Johnston, J. and J. DiNardo, 1997,McGraw-Hill.C. 经济学博士研究生课程(1) 概率论与数理统计Statistical Inference, 2nd Edition, Casella, G. and R.Berger, 2001, Duxbury Press.An Introduction to Econometric Theory, Gallant, A.R., 1997, Princeton UniversityPress.Introduction to Mathematical Statistics, 5th Edition, Hogg, R. V. and A. T. Craig,1995, Prentice-Hall.(2) 计量经济学Econometrics, Hayashi, F., 2000, Princeton University Press. Econometric Analysis, 5th Edition, Green, W., 2003, Prentice Hall. Econometric Methods, 4th Edition, Johnston, J. and J. DiNardo, 1997,McGraw-Hill.(3) 时间序列计量经济学Time Series Analysis, Hamilton, J., 1994, Princeton University Press. Time Series: Theory and Methods, 2nd Edition, Brockwell, P. J. and R. A. Davis,1991, Springer-Verlag.(4) 金融计量经济学The Econometrics of Financial Markets, Campbell, J. Y., A. W. Lo, and A.C.MacKinlay, 1997, Princeton University Press.Analysis of Financial Time Series, 2nd Edition, Tsay, R., 2005,Wiley-Interscience.(5) 微观计量经济学Microeconometrics: Methods and Applications, A. Colin Cameron and P. K. Trivedi,2005, Cambridge University Press.横截面与面板数据的经济计量分析,伍德里奇【美】,2007,中国人民大学出版社.(6) 面板数据计量经济学Analysis of Panel Data, 2nd Edition,Hsiao,C., 2003, Cambridge University Press.Econometric Analysis of Panel Data, 3rd Edition, Baltagi, B. H., 2005, Wiley.(7) 非参数计量经济学Applied Nonparametric Regression, Härdle, W., 1990, Cambridge University Press.Nonparametric Econometrics, Pagan, A. and A.Ullah, 1999, Cambridge UniversityPress.(8) 渐近理论Asymptotic Theory for Econometricians, 2nd Editon, White, H., 2001, AcademicPress.(9) Stochastic Limit Theory, Davidson, J., 1994, Oxford University Press.。
如何学习经济学:关于计量经济学的学习经验
首先声明我的观点,计量是工具也是理论,它不是普通计算机软件,不懂背后的道理也可以用,我个人强烈反对不掌握扎实的理论就去“应用”计量经济学,那绝对是强奸数据。
本人学习经历:读过大多数国际流行的各种“级别”的计量教科书(除了HAYASHI那本,没借到),熟悉SAS,做过大量计算机练习,“蹂躏”过不少中国的数据,现在读paper,参考手册。
忠告:1、别管 R square,几乎不用管多重共线性,知道异方差和自相关的概念就行了,知道大概怎么诊断,至于纠正嘛,不用太在意。不过对于GLS还是要有个认识。
2、对于简单二元模型中OLS相关的重要推导全部背下来,不多,但很重要。
3、这个阶段不要陷入公式推导。
4、如果你是初学者,不要指望把woo的书处处看懂,差不多就行了。
(Hayashi的书国图有,武大有影印版。清华上两年上过洪永淼老师高级计量一的同学也有,可以COPY一下。)
Russell Davidson, James G. Mackinnon 的 《Econometric Theory and Methods》也是一本使用比较广泛的教科书。
/exec/obidos/tg/detail/-/0195123727/qid=1117060245/sr=8-13/ref=pd_ka_6/103-2513422-8868607?v=glance&;s=books&n=507846
2、学好OLS的相关内容实在是太重要了,不要见了更高深的方法就以为OLS没用了,多学几遍OLS吧。基本的矩阵推导要烂熟烂熟烂熟!大样本的结论坚持都推一遍。
3、可以尝试着用计量了,记住如果你只有二三十个样本点,最好不要计量。如果你有50个左右,解释变量别超过三个。
博士研究生高级计量经济学课程教学改革探索论文
博士研究生高级计量经济学课程教学改革探索论文作为经济管理类博士研究生的必修根底课程——《高级计量经济学》是以介绍、研究计量经济学理论与方法,辅以相应的数学推导和统计推断结果,建立计量经济模型并以此刻画、分析、检验及预测现实经济问题和经济现象为主要内容。
其教学目的在于培养和训练博士研究生对于不确定的、经济现象背后的规律的认识和发现能力,特别是实证分析能力。
国内众多高校都非常重视《高级计量经济学》课程的建立和改革。
清华大学李子奈教授就《高级计量经济学》课程的教学体系及计量经济学模型方法论的假设干问题进展了多方面的论述(xx)[1][2][3];厦门大学洪永淼教授分析了计量经济学的地位、作用和局限(xx)[4];中山大学王美今教授等对计量经济学应用研究中的可信性和切适性问题进展了阐释(xx)[5]。
南开大学张晓峒教授也屡次讨论《高级计量经济学》课程的教学内容及方式。
而笔者在多年的博士研究生《高级计量经济学》课程的教学实践中发现,博士研究生在学习《高级计量经济学》课程的过程中,由于其理论根底知识、学科专业需求等方面存在着较大差异,应因地制宜、因材施教地探索适合学科特点的《高级计量经济学》课程的教学内容和方式。
如何合理有效地组织《高级计量经济学》教学内容和教学方式,切实提高教学质量和效果,增强博士生的科研能力,是一个值得探索的课题。
因此,本文从笔者自身教学实践情况出发,分析高级计量经济学教学过程中存在的问题,提出相应的教学改良思路。
《高级计量经济学》是跟随北美研究生教育体系所开设的一门课程,本质上是一门集理论性、方法性和应用性且要求较高的经济学类核心课程。
其主要内容是,伴随着重要理论、概念和方法的是众多的统计分析思想和复杂的数学推导证明,因此要求前序课程应具备高等数学、矩阵代数、概率论与数理统计、初中级计量经济学等课程的根底。
在多年的博士研究生的《高级计量经济学》课程教学实践中,我们发现,《高级计量经济学》对于培养和训练经济管理类不同专业的博士生,运用数量方法和工具分析解决实际问题,增强科研能力等方面确实起到重要作用。
王亚南经济研究院成立15周年纪念编著——《新时代中国经济学教育与研究》出版
出版物刊名: 经济研究
页码: F0002-F0002页
年卷期: 2020年 第7期
主题词: 上海人民出版社;计量经济学;地方经济建设;王亚南;交叉融合;实践主体;国际视角;人才培养;
摘要:“不忘来路,始知归处”,为庆祝WISE成立15周年编著的《新时代中国经济学教育与研究----WISE足迹》由上海人民出版社于2020年6月正式出版。
本书集结了WISE首任院长洪永淼教授的部分媒体访谈文章、个人随笔和建言,通过洪永淼个人的视角,呈现WISE15年来的发展理念与轨迹。
本书主要包括四方面内容:第一部分《成长》,主要叙述洪永淼赴美留学,再应邀回到母校创办WISE以及主持经济学科的学术管理工作的经历;第二部分《开创》,主要反映WISE的创立、发展,以及WISE、经济学院、邹至庄经济研究中心三位一体交叉融合的鲜明特色,介绍了15年来厦大经济学科在学科建设、人才培养、学院治理等方面的开拓与创新;第三部分《理念》,介绍了洪永淼以WISE为主要实践主体,关于新时代中国经济学和计量经济学教育与研究的理念和见解;第四部分《建言》,总结了洪永淼从国际视角对中国经济发展以及福建、厦门等地方经济建设的若干思考。
洪永淼高级计量经济学讲义

洪永淼高级计量经济学讲义
洪永淼高级计量经济学讲义是一本经典的计量经济学教材,它系统地介绍了计量经济学的基本思想、理论和方法,对于学习和应用计量经济学的人士具有重要的参考价值。
本书的内容广泛而深入,涵盖了基本的统计学、概率论、线性回归模型、时间序列模型等知识,可以帮助读者建立起对计量经济学的全面认识。
此外,本书还介绍了诸如面板数据模型、极大似然估计、广义矩估计等高级方法,为读者提供了更深入的研究方向。
在本书中,洪永淼教授以简洁明了的语言和丰富的实例,向读者展示了计量经济学如何应用于实际问题的解决。
他强调了理论和实践相互促进的关系,让读者在学习本书的同时能够更好地理解和应用计量经济学。
总之,洪永淼高级计量经济学讲义是一本具有较高水平和全面性的计量经济学教材,对于经济学、金融学等相关领域的学生、研究者以及从事应用计量经济学工作的专业人士具有很高的参考价值。
第一章 计量经济学概论
exp ent = -81.0707 +1.1176 revent
(-0.6) (83.6) R2 = 0.999, DW.= 1.7, 1970-2004
1.20 EXPEN/REVEN 1.16 1.12 1.08
Lnet = -0.2637 + 1.0400 Lnrt
(-7.0) (220.8) R2 = 0.999, DW.= 1.61, 1970-2004
1.6 建立与应用计量经济学模型的步骤
1.6.1 根据经济理论建立计量经济模型
首先根据经济理论分析所研究的经济现象、找出经济现象间的因 果关系及相互间的联系。其次,按照它们之间的行为关系、选择适当 的数学形式描述这些变量之间的关系。理论模型的设计主要包括三个 部分:即选择变量、确定变量之间的数学关系,拟定模型中的待估参 数的数值范围。
2015年12月26日星期六 greytheory@
•
ARCH类模型的一系列研究成果也成为目前
金融学家分析金融时间序列波动规律的有力工具
,并逐渐形成了一个新的交叉学科——金融计量
经济学。
2015年12月26日星期六 greytheory@
•
经典计量经济学(Classical Econometrics)一
1.6.2 样本数据的收集与处理
建立了模型之后,应该根据模型中变量的含义、口径,收集并整 理样本数据。样本数据质量直接关系到模型的质量。
2015年12月26日星期六 greytheory@
在实际使用数据估计模型之前,需要对数据做预处理,初步把握样
本数据的一些统计特征,包括描述性统计、平稳性检验、协整分析和因 果关系分析等。
2015年12月26日星期六 greytheory@ 3.混合数据(panel data) 混合数据也称面版数据,指既有时间序列数据又有横截面数据,即在时 间序列上取多个截面,在这些截面上同时选取样本观测值所构成的样本数 据。例如如全国各省市不同年份的经济发展状况的统计数据,这些都是混 合数据。
洪永淼老师统计学教材
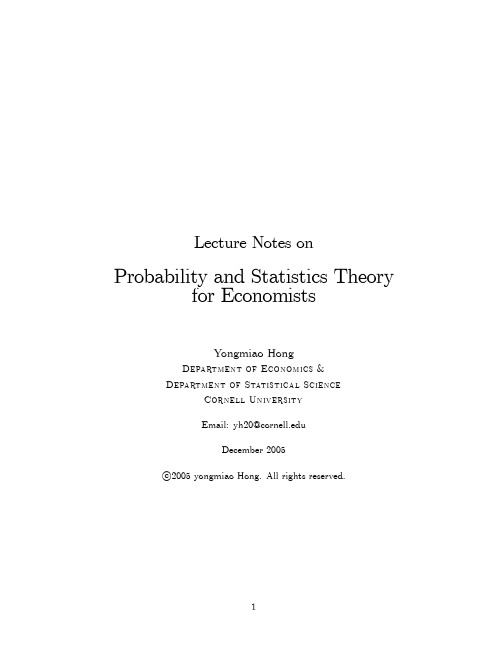
Lecture Notes on Probability and Statistics Theoryfor EconomistsYongmiao HongDepartment of Economics&Department of Statistical ScienceCornell UniversityEmail:yh20@December2005c 2005yongmiao Hong.All rights reserved.Outline of ContentsChapter1Introduction to EconometricsChapter2Foundation of Probability TheoryChapter3Random Variables and Univariate Probability Distributions Chapter4Important Parametric DistributionsChapter5Random Vectors and Multivariate Probability Distribution Chapter6Introduction to Sampling Theory and StatisticsChapter7Convergence Concepts and Limit TheoriesChapter8Parameter Estimation and EvaluationChapter9Hypothesis TestingChapter10ConclusionPrefaceThis book is the…rst course in a graduate econometrics sequence.It provides an introduction to probability theory and statistics.Why do we need to teach probability and statistics to graduate students in economics?Put it simply,it provides necessary probability and statistics background for…rst-year graduate students for their courses in econometrics,microeconomics,and macroeconomics.Statistics and mathematics are two basic analytic tools in economics.Statistics is an essential tool to study situations involving uncertainties,in the same way as calculus is essential to characterize optimizing behaviors in economics.For example,probability theory is needed in study of game theory,rather vice versa.In macroeconomics,as Robert Lucas points out,the introduction of stochastic factors can provide much new insights into dynamic economic systems.In certain sense,a course on probability and statistics might not be called Econometrics I,because they are necessary analytic tools in every…eld of economics.Of course,the demand for probability and statistics varies from…eld to…eld in economics,with econometrics most heavily using it.Speci…cally,those who are attracted to theoretical econometrics would be expected to study probability and statistics in more depth by taking further graduate courses in mathematics and statistics.Those who are not attracted to should…nd this course in adequate preparation in the theory of probability and statistics for both their applied courses in econometrics and their courses in microeconomics and macroeconomics.The book is written as a one semester course.Chapters1–5are probability theory,and Chapters6-9are statistics theory.Chapter1is an introduction to econometrics,arguing why probability and statistics are basic analytic tools for economics.Chapter2lays down the founda-tion of probability theory,which is important for understanding subsequent materials.Chapter3 introduces random variables and probability distributions in a univariate context.Chapter4lists and discusses important examples of discrete and continuous probability distributions that are commonly used in economics and…nance.Chapter5introduces random vectors and multivariate probability distributions.In most cases,we consider the bivariate distribution.Chapter6is an introduction to statistics theory,and Chapter7introduces basic analytic tools for asymptotic theory.Chapter8discusses parameter estimation methods and methods to evaluate parameter estimators.Chapter9deals with hypothesis testing.Finally,Chapter10concludes the book. The book contains discussions ranging from basic concepts to advanced asymptotic analysis,with much intuition and explanations provided for important probability and statistics concepts andideas.Whenever and wherever appropriate,empirical applications are considered to illustrate how probability and statistics theories and methods can be applied to economics and…nance.The purpose of this book is to develop a deep understanding of probability and statistics and a solid intuition for statistical concepts.One year of calculus is a prerequisite for understanding the materials in this book,and an additional year of advanced calculus and some basic background in probability and statistics will be very helpful.The analysis is conducted in a relatively rigorous manner.Formal proofs will be given for some important theorems,because the proofs themselves can aid understanding and in some cases,the proof techniques or methods have practical value. Many students taking this course are experiencing the ideas of statistics for the…rst time.It will be helpful for them to spend some time learning how the mathematical ideas of statistics carry over into the world of applications in economics and…nance.Thus in addition to develop a fundamental understanding of probability and mathematical statistics that are most relevant to modern econometrics,this book also tries to develop a sound intuition for statistical concepts from economic perspective.For example,why are statistical concepts(e.g.,conditional mean, conditional variance)useful in economics?What are economic intuition and interpretation for the probability and statistic relations?Yongmiao HongCornell University,Ithaca,U.S.A.Chapter1Introduction to EconometricsThe most important feature of modern economics and…nance is the wide use of quantita-tive analysis.Quantitative analysis consists of mathematical modeling of economic theory and empirical study of economic data.This is due to the cumulative e¤ort of many generations of economists in their e¤orts to make economics as a science,something like or close to physics, chemistry and biology,which can make accurate forecasts.Economic theory,when formulated via mathematical tools,can achieve its logical consistency between assumptions,theory,and its implications.Indeed,as Karl Marx pointed out,the use of mathematics is an indication of the stage of a science.On the other hand,for any economic theory to be a science,it must be able to explain important stylized facts and to predict future economic evolutions.This requires validating economic models using the observed economic phenomena,usually in form of data. Mathematical tools cannot help in achieving this objective.Instead,statistical tools have proven to be rather useful.The history of development of economics is a continuous process of refuting the existing economic theory that cannot explain new empirical stylized facts and developing new economic theories that can explain new observed empirical stylized facts.Empirical ana-lytic tools play a vital role in such a process.In a sense,statistical methods and techniques are really the heart of the scienti…c research in economics.As a matter of fact,the main empirical analytic tool in economics has been econometrics. Econometrics is the statistical analysis of economic data.Probability was motivated by interest in games of chance.Scholars then began to apply probability theory to actuarial problems and some aspects of the social ter,probability and statistics were introduced into physics by L.Boltzmann,J.Gibbs,and J.Maxwell,and by this century,they have found applications in all phases of human endeavor that in some way involve an element of uncertainty or risk.Indeed, probability theory has been the best analytic tool to describe any system involving uncertainties.Modern statistics has encompassed the science of basing inferences on observed data and the entire problem of making decisions in the face of uncertainty.It would be presumptuous to say that statistics,in its present state of development,can handle all situations involving uncertainties,but new techniques are constantly being developed and modern statistics can,at least,provides a framework for looking at the situations involving uncertainties in a logical and systematic fashion.It can be said that statistics provides mathematical models that are needed to studies situations involving uncertainty in the same way as calculus provides the mathematical models that are needed to describe,say the concepts of Newtonian physics.Indeed,as RobertLucas pointed out,the introduction of stochastic factors into an dynamic economic system can provide new insight into the dynamic economic process.There are two fundamental axioms behind econometrics:Axiom A:Any economy can be viewed as a stochastic process governed by some probability law;Axiom B:Economic phenomenon,as often summarized in form of data,can be reviewed as a realization of this stochastic data generating process.Economics is about resource allocation in an uncertain environment.When an economic agent makes a decision,he or she usually does not know precisely the outcome of his or her action,which usually will arise in an unpredictable manner,and after some time lags.As a consequence,uncertainty and time are two most important features of an economy.Therefore it seems reasonable to assume Axiom A.With Axiom A,it is natural to assume Axiom B under which one can call the economic system is a“data generating process.”It is impossible to prove these two axioms.They are the philosophic views of econometricians and economists about an economy.We note that not all economists and econometricians agree with these two axioms. For example,some economists view that an economic system is a chaotic process,which is deterministic but can generate seemingly random numbers.The probability law of a stochastic economic process may be called the“law of economic motions.”The objective of econometrics is to infer the probability law of an economic system based on observed economic data,and then use the inferred probability law to test economic theory and economic hypotheses,to explain important stylized facts,and to forecast future evolutions of the economic system.Econometrics provides a bridge linking economic models and economic reality.One important implication of Axioms A and B is the need of“statistical thinking”in eco-nomic analysis.For example,one should expect that economic relationships are stochastic and the outcomes cannot be predicted with certainty.All economic agents must incorporate this uncertainty when making their economic decisions.Moreover,any economic data observed,as realizations of a stochastic process,must be subject to sampling variations,thus creating some uncertainties for our inference of the law of economic motion.Statistics is an analysis of the“average behavior”of the outcomes of a large number of repeated experiments.A key assump-tion in the statistical analysis of this book is that the repeated experiments are independent and identically distributed.By independence,it is meant that the generation of the outcome of an experiment has nothing to do with the generalization of the outcome of another experiment. Thus,di¤erent experiments provide di¤erent pieces of information.By identical distribution,it is meant that the mechanisms of di¤erent experiments generating outcomes are the same.Ob-viously,the i.i.d.assumption is an mathematical limiting approximation of real experiments.It may be di¢cult to satisfy for stochastic economic processes.There are some distinctive features of an economic system when viewed as a stochastic process.The observed data is the joint e¤ect of many(perhaps in…nite)factors in an economy,while any economic model can only consider some of them.It is therefore very di¢cult,if not impossible,to separate the e¤ect of the fac-tors under modeling from the e¤ect of the omitted factors.This is quite di¤erent from Physics, where an controlled experiment can be done to remove the e¤ect of other factors.In the recent years,there is an increasing interest in experimental economics,which can be viewed as studies of controlled economic experiments.This is similar in spirit to Physics,but it is hard to image to extend this method to the whole economy like China which has1.3billions of populations.The second feature of economic systems is that an economic process is irreversible.As a con-sequence,many important economic variables,such as GDP,only have one realization.Thus, it is impossible to conduct statistical analysis of economic data without making assumptions. In practice,it is often assumed that di¤erent economic variables follow from the same popu-lation distribution or at least have the same attributes in certain aspects of their probability distributions.Thus,the data for di¤erent variables can be viewed as generated from the sample population or share same attributes,so that statistical inference of observed data is possible. Obviously,the validity and accuracy of the statistical inference depends on how reasonable the underlying assumptions are in describing economic systems.The third feature of economic systems is their time-varying features.There are many eco-nomic events,such as government policy changes,changes of foreign exchange rate systems,oil shocks,etc,which may cause economic behaviors to change fundamentally.This is the so-called economic structural breaks or regime shifts.Structural breaks and regime shifts will render the existing economic models invalid in describing or predicting future economic evolutions.Because of these distinctive features of economic systems,we should be aware of the under-lying assumptions and their limitations when making statistical inference of economic data.。
- 1、下载文档前请自行甄别文档内容的完整性,平台不提供额外的编辑、内容补充、找答案等附加服务。
- 2、"仅部分预览"的文档,不可在线预览部分如存在完整性等问题,可反馈申请退款(可完整预览的文档不适用该条件!)。
- 3、如文档侵犯您的权益,请联系客服反馈,我们会尽快为您处理(人工客服工作时间:9:00-18:30)。
A. 经济学本科生计量经济学核心课程
(1) 概率论与数理统计
Statistics for Business and Economics, 6th Edition, Newbold, P., Carlson, W. and B.
Thorne, 2006, Prentice-Hall.
(2) 计量经济学初步
Introductory Econometrics with Applications, 4th Edition, Ramanathan, R., 1998,
The Dryden Press.
Introduction to Econometrics, Stock, H. and M. Watson, 2002, Addison Wesley.
计量经济学导论:现代观点,伍德里奇【美】,2003,中国人民大学出版社. 计量经济学基础(第四版),古扎拉蒂【美】,2005,中国人民大学出版社. 计量经济学(第二版),李子奈、潘文卿,2005,高等教育出版社.
B. 硕士研究生计量经济学课程
(1) 概率论与数理统计
Introduction to Mathematical Statistics (5th Edition), Hogg, R. V. and A. T. Craig,
1995, Prentice-Hall.
(2) 计量经济学
Econometric Analysis, 5th Edition, Green, W., 2003, Prentice Hall. Econometric Methods, 4th Edition, Johnston, J. and J. DiNardo, 1997,
McGraw-Hill.
C. 经济学博士研究生课程
(1) 概率论与数理统计
Statistical Inference, 2nd Edition, Casella, G. and R.Berger, 2001, Duxbury Press.
An Introduction to Econometric Theory, Gallant, A.R., 1997, Princeton University
Press.
Introduction to Mathematical Statistics, 5th Edition, Hogg, R. V. and A. T. Craig,
1995, Prentice-Hall.
(2) 计量经济学
Econometrics, Hayashi, F., 2000, Princeton University Press. Econometric Analysis, 5th Edition, Green, W., 2003, Prentice Hall. Econometric Methods, 4th Edition, Johnston, J. and J. DiNardo, 1997,
McGraw-Hill.
(3) 时间序列计量经济学
Time Series Analysis, Hamilton, J., 1994, Princeton University Press. Time Series: Theory and Methods, 2nd Edition, Brockwell, P. J. and R. A. Davis,
1991, Springer-Verlag.
(4) 金融计量经济学
The Econometrics of Financial Markets, Campbell, J. Y., A. W. Lo, and A.
C.
MacKinlay, 1997, Princeton University Press.
Analysis of Financial Time Series, 2nd Edition, Tsay, R., 2005,
Wiley-Interscience.
(5) 微观计量经济学
Microeconometrics: Methods and Applications, A. Colin Cameron and P. K. Trivedi,
2005, Cambridge University Press.
横截面与面板数据的经济计量分析,伍德里奇【美】,2007,中国人民大学出版社.
(6) 面板数据计量经济学
Analysis of Panel Data, 2nd Edition,Hsiao,C., 2003, Cambridge University Press.
Econometric Analysis of Panel Data, 3rd Edition, Baltagi, B. H., 2005, Wiley.
(7) 非参数计量经济学
Applied Nonparametric Regression, Härdle, W., 1990, Cambridge University Press.
Nonparametric Econometrics, Pagan, A. and A.Ullah, 1999, Cambridge University
Press.
(8) 渐近理论
Asymptotic Theory for Econometricians, 2nd Editon, White, H., 2001, Academic
Press.
(9) Stochastic Limit Theory, Davidson, J., 1994, Oxford University Press.。