图表作文精品PPT课件
合集下载
应用文写作之图表作文课件 2024届高考英语作文备考

Step 4 Practice
学校英文报正在开展以Learning English Beyond the Classroom为题的讨论。请使用图表 中的调查结果写一篇短文投稿,内容包括: 1. 学习活动状况描述; 2. 简单评论; 3. 你的建议。 注意: 1.写作词数应为80左右; 2.请按如下格式在相应位置作答。
Step 1 Build the structure
Genre: a short essay Structure: Paragraph 1 A brief description
Paragraph 2 A short comment
Paragraph 3 Your suggestions
Step 2 Build the language (para.1)
如图所示: 1. The chart shows/indicates/illustrates…. 2. According to the chart, … 3. As is shown in the chart,… 4. As can be seen from the chart,… 描述结果: 1. …percent of the students ..., while … percent of
Step 3 Appreciation
According to the survey conducted in our school, 43% of the students prefer to read science books, followed by comic readers, which accounts for 26%. 18% of the students enjoy reading sports and music books while 13% of the students like to read classical books.
四级作文之图表图画作文篇总结PPT课件

图表作文框架:
第一段只写三句 第一句:As is shown in the graph above, we can see
clearly that great changes have taken place in … from…to… 第二句:The first … years saw… 第三句:The last … years witnessed … 第二段只写四句 第一句:What has caused this problem? It seems to me that there are … reasons. 第二句:Firstly, …/ 第三句:Secondly,…/第四句:Finally,… 第三段只写四句 第一句:How to solve the problem has become a hot issue among many people. 第二句:For one thing, …//第三句:For another, … 第四句:Only in this way can we successfully solve the problem.
decline 7. 表示持续不变的词汇level off; remain steady/unchanged 8. 表示倍数的词汇
double; triple the number of/the percentage of; four/five times 9. 表示多少的词汇
a little/ much/ a lot more/less than…, over…
不同观点作文
第一段一般只写三句 第一句:It is widely believed that by many people for
some time that ... 第二句:One reason they think is that... 第三句:The other reason they hold is that... 第二段一般只写三句 第一句:While others argue that ... 第二句:They maintain that... 第三句:They also claim that... 第三段写四句 第一句:From what has been discussed above, we may
第29讲图表作文PPT课件
柱形图用来表示各种事物的变化情况及相互关系要求考生通过宽度相等的柱形的高度或长度差别来判断事物的动态发展趋势因此考生应密切关注坐标线上的刻度单位及图表旁边的提示说明与文字
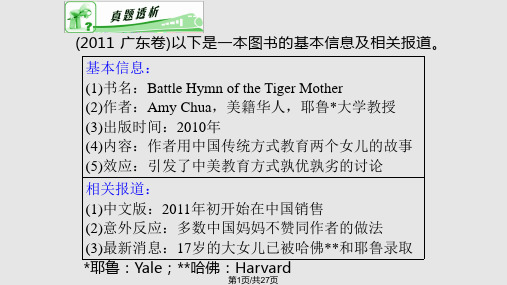
(2011·广东卷)以下是一本图书的基本信息及相关报道。
基本信息: (1)书名:Battle Hymn of the Tiger Mother (2)作者:Amy Chua,美籍华人,耶鲁*大学教授 (3)出版时间:2010年 (4)内容:作者用中国传统方式教育两个女儿的故事 (5)效应:引发了中美教育方式孰优孰劣的讨论
8. 另外,太多的钱将会花费在修建地铁上,并且这需 要很长一段时间来收回这些钱。 What's more, too much money will be spent building it, and it will take a long time to get the money back.
第14页/共27页
第18页/共27页
一、利弊型
Recently, our class had a heated discussion on whether 作文主题. Opinions vary from person to person/Opinions are divided among students.
第5页/共27页
图表作文是近几年高考常选的命题方式之一。在高考 中常以两种形式对学生进行考查,一种是文字表格式, 另一种是柱形或饼形图表式。文字表格式在近几年全国 各省每年都考查过,而柱形或饼形图表式作文则在 2006年的湖北卷及2004年的北京卷出现过。湖南省在 2008年的高考中,是另一种形式的图表作文:文字表 格+人物图像。这些数据说明,高考命题者对图表作文 还是比较青睐的。
图表作文全版.ppt

the future…
2001 2002 2003 2004 2005
分析:本
grain 43% 42% 41% 41% 40%
统计表描
述中国人
milk
13% 14% 14.5% 14.5% 15%
民从2001
meat 25% 25% 26%
26.5% 27.5% 年至2005 年饮食结
Fruit& vegetable
12
某据第学图校表二1对提步中供学:的图生信课表息余描1活述中动学进六生行每项了天调活的查课动,余结及活果动所如,下用并。针时请对根间图
表2中任何一个数据中反映的情况写出你的一个看法。词
数不O少n于C6h0a。rt学1,生T主he要s课tu余de活n动ts及所2用.th时ei间r homework 93
课件制作:刘轶群 授课人: 刘轶群
最新.课件
1
Warming up
图表式作文的几种形式:
一是以表格形式,将统计的数据或被说明的 事物直接用表格形式体现出来,即统计表。
二是以图形形式 A 表示数据变化的曲线图; B 表示数据的大小或数量之间的差异 的柱状图; C 表示总体内部结构变化的扇形图。
最新.课件
th2e)eaxmploauinntthoef c,hinantgheesaavnedraggivee, dproospsi,bbleyr…easpoenrsce;nt, in3注c)意rder:a1asw.e尽,y可soeu能vre少or引awl用nr数ecoa据nso;cn2lu.ss,词ifo数onrs1.o0n0e左t右h。ing…for another, with the development of , afford to ,the
《图表类作文》PPT课件

第一段:描述图表,得出结论。 第二段:紧扣主题,根据图表比较分析原
因,论证结论。 第三段:发表议论,提出自己的看法。
分析柱状图数据信息。
从图中可看出,黑色代表想上大学,占 大多数,约60%;浅黑色代表无所谓, 占约30%;白色代表不想上大学,占约 10%。
One possible version
人们日常生活中事物的变化情 况通常可以用宽度相等的柱状图形来 表示,柱状图的高度差别用来说明事 物的动态发展趋势,同时要注意图例
说明和坐标刻度所提示的信息。
例:你们班会的讨论主题是“上大学是高中生唯一的出路吗?”请你根据下 面图表及汉语提示,写一篇短文,并阐述你的个人观点。
提示:1.增长学识,提高素养,源自于择业。 2.成功的路不只一条。 3.学费高,就业难。
The majority of us consider it very necessary to go to college.
They think it can widen their knowledge and improve their
qualities.Only in this way can they find better jobs after graduation.Very few students, that is about ten percent of the students, think it no use going university, because the tuition is too high for their family to afford.What's more, it's rather hard for college graduates to seek satisfactory jobs.Thirty percent of the students, however, believe “All roads lead to Rome.” Therefore it doesn't make any difference whether they go to college or not.
高考英语作文图表作文ppt课件

18
第二步:观察图表中数据的增减总趋势, 阐明原因
Grain, the main food of most people in China, is now playing a less important role and the amount of fruit and vegetables in the average people’s diet has also dropped by 1.5 percent from 2001 to 2005. The amount
Personally I think, students are now freed from heavy burden but their spare time is not well arranged .They are expected to spend more time on what they learn instead of hanging out. More time should be spent not only on green field but also in the libraries to build up themselves physically and mentally .Besides, more interest groups should be established for students to broaden their horizons and sharpen their brains so that they can become more creative eventually .All these will contribute a lot to a well-informed and highly qualified teenager
四级作文之图表图画作文篇总结PPT课件
In spite of what’s mentioned above, there are some problems. The graph indicates that _______ was ( were ) fluctuated ( 波动 ) . Hence, the situation is still serious and how to improve ________ is still a challenging task.
The Graph
From the graph, we can clearly see that great changes have been taking place in people’s diet over the period from 1992 to 1996. The consumption of grain is decreasing year by year, while that of some high energy food, such as milk and meat, is increasing steadily.
ition
图表作文 Models
Changes in People Diet
Outline: 1. state the changes in people’s diet in the past five
years 2. give possible reasons for the changes 3. draw your own conclusion
There are chiefly _______ reasons for the increase ( decline ). In the first place, owing to ______, _______have realized the importance of _______. Secondly, with the development of ( with the growth of, with the increase of , with the improvement of ), ________ have adopted more active and effective methods.
《图表作文模式》PPT课件_OK

1
11月月考试题:
以How People Spend Their Holidays为题,为 China Daily写一篇短文。
Changes in the Ways People Spend Their Holidays
Ways Traveling abroad
1997 12%
2007 24%
Going to seaside
Changes in the Ways People Spend Their
Holidays
The rate of
peopleWawysho …
1997
2007
sharply increase to
Traveling abroad
12%
24%
remain stable OR slightly go down
19
(year)
在……至……期间,…显著增加
• … sharply decreased from…in (year)…to…in
(year)
在……至……期间,…急剧下降
• over the period from…to… , the…remained steady
•在……至……期间,……基本不变。 11
Staying at home
40%
to
9%
9
表示变化程度的形容词,副词
rapid/rapidly sharp/sharply slow/slowly slight/slightly
迅速的,飞快的 明显的,急剧的 缓慢的 轻微的、略微地
10
• … greatly increased from…in (year)…to…in
1980
- 1、下载文档前请自行甄别文档内容的完整性,平台不提供额外的编辑、内容补充、找答案等附加服务。
- 2、"仅部分预览"的文档,不可在线预览部分如存在完整性等问题,可反馈申请退款(可完整预览的文档不适用该条件!)。
- 3、如文档侵犯您的权益,请联系客服反馈,我们会尽快为您处理(人工客服工作时间:9:00-18:30)。
n.先见,预见v.预测
70 percent / 70% of the students X times as large as X times larger than 20 percent more / less than
1、图表写作套句精选 1).The table shows the changes in the number of……over the period from……to…… 该表格描述了在……年之……年间……数量的变 化。
图表作文分类:
数字表:曲线图 graph 表格 table
几何图形 figure 图形表:饼状图 pie chart
条状图 bar chart 平面图, 示意图,外形图
diagram
Bar Chart / Graph 柱状图
Pie Chartod
65%
Clothing 8%
2).The graph provides some interesting data regarding…… 该图为我们提供了有关……有趣数据。
3).This is a graph which describes the trend of…… 这个曲线图描述了……的趋势。
4).The data/statistics/figures lead us to the conclusion that……
Recreation 3%
1995
60% 9% 5%
1996
48% 12% 7%
1997
42% 15% 8%
1998
35% 17% 10%
Others Total
24% 26% 33% 35% 38% 100% 100% 100% 100% 100%
Table
矩形的竖行和横行进行排列的表格
Diagram
平面图、示意图、图底或外形图
第一按照题目要求描述图表反映的总情 况,即概括大意。
第二对数字进行仔细的比较,抓住特点 进行分析、归纳并找出产生变化的原因。
第三可写读图表后的想法和评论,从而 得出自己的结论。
• 第一按照题目要求描述图表反映的总情况, 即概括大意。
• 第二对数字进行仔细的比较,抓住特点进 行分析、归纳并找出产生变化的原因。
数字急剧上升至……
8).The figures peaked at……in(month/year) ……的数目在……月(年)达到顶点,为……
9).The percentage of……is slightly larger/smaller than that of……
图表作文写作常识
图表作文
• 图表作文包括几种形式,有统计表(table)、 比率表(graph)、图示与统计数字相结合的 图表(chart)或图画(cartoon)等。图表作文要 求考生通过分析试题所提供的图表中相互 关联的各种数据, 阐述某种现象的规律和原 因。它要求将图表中所包含的信息转化成 英语描述。
remain stable / steady/ level / stabilize 波动:fluctuate / rebound / undulate / wave ……
in terms of / in respect of / regarding 在……方面
in contrast government policy forecast
steep/steeply
稳固的,坚定不移的 steady/steadily
渐进的,逐渐的 gradual/gradually
缓慢的,不活跃的 slow/slowly
轻微的、略微地 slight/slightly
稳定的
stable/stably
在描述中的常用到的词
noticeable / obvious trend 明显的趋势 a downward trend in sth a general trend in sth show an upward tendency
图表作文写作常用的描述用法
The table/graph/chart shows/indicate (that)
According to the table/chart diagram/graph
As is shown in the table/chart, ……
As can be seen from the table/chart/diagram/graph/figures……
图表中的数据(Data)具体表达法:
数据(Data)在某一个时间段固定不变:
stable/stablized/fixed in time
在一系列的时间段中转变:
changes over time
持续变化的data在不同情况下:
增加:increase / rise / go up …… 减少:decrease / go down / drop / fall …… 稳定:
这些数据资料令我们得出结论……
5).The graph,presented in a pie chart, shows the general trend in……
该图以圆形图形式描述了……总的趋势
6)……(year)witnessed/saw a sharp rise in……
……年……急剧上升 7) The number sharply went up to……
distribute 分布,区别 unequally 不相等地 in the case of adv. 在……的情况下
in terms of / in respect of / regarding 在……方面 in contrast forecast n.先见,预见v.预测
70 percent / 70% of the students X times as large as X times larger than 20 percent more / less than
• 第三可写读图表后的想法和评论,从而得 出自己的结论。
1、表示数据变化的单词或者词组
迅速的
rapid/rapidly
戏剧性的,生动的 dramatic/dramatically
意义重大的,重要的 significant/significantly
明显的,急剧的 sharp/sharply
急剧升降的
70 percent / 70% of the students X times as large as X times larger than 20 percent more / less than
1、图表写作套句精选 1).The table shows the changes in the number of……over the period from……to…… 该表格描述了在……年之……年间……数量的变 化。
图表作文分类:
数字表:曲线图 graph 表格 table
几何图形 figure 图形表:饼状图 pie chart
条状图 bar chart 平面图, 示意图,外形图
diagram
Bar Chart / Graph 柱状图
Pie Chartod
65%
Clothing 8%
2).The graph provides some interesting data regarding…… 该图为我们提供了有关……有趣数据。
3).This is a graph which describes the trend of…… 这个曲线图描述了……的趋势。
4).The data/statistics/figures lead us to the conclusion that……
Recreation 3%
1995
60% 9% 5%
1996
48% 12% 7%
1997
42% 15% 8%
1998
35% 17% 10%
Others Total
24% 26% 33% 35% 38% 100% 100% 100% 100% 100%
Table
矩形的竖行和横行进行排列的表格
Diagram
平面图、示意图、图底或外形图
第一按照题目要求描述图表反映的总情 况,即概括大意。
第二对数字进行仔细的比较,抓住特点 进行分析、归纳并找出产生变化的原因。
第三可写读图表后的想法和评论,从而 得出自己的结论。
• 第一按照题目要求描述图表反映的总情况, 即概括大意。
• 第二对数字进行仔细的比较,抓住特点进 行分析、归纳并找出产生变化的原因。
数字急剧上升至……
8).The figures peaked at……in(month/year) ……的数目在……月(年)达到顶点,为……
9).The percentage of……is slightly larger/smaller than that of……
图表作文写作常识
图表作文
• 图表作文包括几种形式,有统计表(table)、 比率表(graph)、图示与统计数字相结合的 图表(chart)或图画(cartoon)等。图表作文要 求考生通过分析试题所提供的图表中相互 关联的各种数据, 阐述某种现象的规律和原 因。它要求将图表中所包含的信息转化成 英语描述。
remain stable / steady/ level / stabilize 波动:fluctuate / rebound / undulate / wave ……
in terms of / in respect of / regarding 在……方面
in contrast government policy forecast
steep/steeply
稳固的,坚定不移的 steady/steadily
渐进的,逐渐的 gradual/gradually
缓慢的,不活跃的 slow/slowly
轻微的、略微地 slight/slightly
稳定的
stable/stably
在描述中的常用到的词
noticeable / obvious trend 明显的趋势 a downward trend in sth a general trend in sth show an upward tendency
图表作文写作常用的描述用法
The table/graph/chart shows/indicate (that)
According to the table/chart diagram/graph
As is shown in the table/chart, ……
As can be seen from the table/chart/diagram/graph/figures……
图表中的数据(Data)具体表达法:
数据(Data)在某一个时间段固定不变:
stable/stablized/fixed in time
在一系列的时间段中转变:
changes over time
持续变化的data在不同情况下:
增加:increase / rise / go up …… 减少:decrease / go down / drop / fall …… 稳定:
这些数据资料令我们得出结论……
5).The graph,presented in a pie chart, shows the general trend in……
该图以圆形图形式描述了……总的趋势
6)……(year)witnessed/saw a sharp rise in……
……年……急剧上升 7) The number sharply went up to……
distribute 分布,区别 unequally 不相等地 in the case of adv. 在……的情况下
in terms of / in respect of / regarding 在……方面 in contrast forecast n.先见,预见v.预测
70 percent / 70% of the students X times as large as X times larger than 20 percent more / less than
• 第三可写读图表后的想法和评论,从而得 出自己的结论。
1、表示数据变化的单词或者词组
迅速的
rapid/rapidly
戏剧性的,生动的 dramatic/dramatically
意义重大的,重要的 significant/significantly
明显的,急剧的 sharp/sharply
急剧升降的