利用STATA创建空间权重矩阵及空间杜宾模型计算----命令
【计量】空间杜宾模型代码
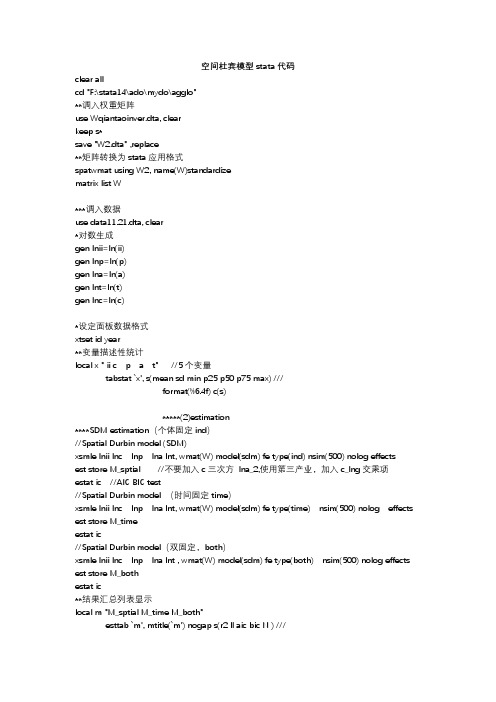
空间杜宾模型stata代码clear allcd "F:\stata14\ado\mydo\agglo"**调入权重矩阵use Wqiantaoinver.dta, clearkeep s*save "W2.dta" ,replace**矩阵转换为stata应用格式spatwmat using W2, name(W)standardizematrix list W***调入数据use data11.21.dta, clear*对数生成gen lnii=ln(ii)gen lnp=ln(p)gen lna=ln(a)gen lnt=ln(t)gen lnc=ln(c)*设定面板数据格式xtset id year**变量描述性统计local x " ii c p a t" //5个变量tabstat `x', s(mean sd min p25 p50 p75 max) ///format(%6.4f) c(s)*****(2)estimation****SDM estimation(个体固定ind)//Spatial Durbin model (SDM)xsmle lnii lnc lnp lna lnt, wmat(W) model(sdm) fe type(ind) nsim(500) nolog effectsest store M_sptial //不要加入c三次方lna_2,使用第三产业,加入c_lng交乘项estat ic //AIC BIC test//Spatial Durbin model (时间固定time)xsmle lnii lnc lnp lna lnt, wmat(W) model(sdm) fe type(time) nsim(500) nolog effects est store M_timeestat ic//Spatial Durbin model(双固定,both)xsmle lnii lnc lnp lna lnt , wmat(W) model(sdm) fe type(both) nsim(500) nolog effects est store M_bothestat ic**结果汇总列表显示local m "M_sptial M_time M_both"esttab `m', mtitle(`m') nogap s(r2 ll aic bic N ) ///star(* 0.1 ** 0.05 *** 0.01) b(%6.3f)esttab M_sptial M_time M_both using pane0000.rtf //输出结果rtf excel doc****hausman testxsmle lnii lnc lnp lna lnt , wmat(W) model(sdm) fe type(both) nsim(500) nolog estimates store sdm_fexsmle lnii lnc lnp lna lnt , wmat(W) model(sdm) re type(both) nsim(500) nolog estimates store sdm_rehausman sdm_fe sdm_re。
stata构建反距离空间矩阵标准化的命令
stata构建反距离空间矩阵标准化的命令Stata构建反距离空间矩阵标准化的命令在空间分析领域中,反距离权重矩阵是一种常用的技术,用于衡量地理上的相互影响。
而在Stata软件中,通过使用特定的命令,我们可以轻松地构建反距离空间矩阵标准化。
本文将介绍Stata中可用的命令并展示其使用方法,以便读者能够充分理解和应用这一功能。
1. 空间权重构建空间权重矩阵是反距离权重矩阵构建的基础。
通过衡量地点之间的空间距离,我们可以构建空间权重矩阵,并用于后续的分析和建模。
在Stata中,常用的命令是‘spwmatrix’,简洁且易于使用。
该命令允许我们通过考虑特定的几何关系和距离度量标准,构建空间权重矩阵。
我们可以使用欧氏距离作为度量标准,设置一个特定的阈值来限制权重的计算。
2. 反距离权重矩阵的构建一旦空间权重矩阵构建完成,我们可以根据此矩阵构建反距离权重矩阵。
反距离权重矩阵主要用于考虑地点之间的相互影响程度。
在Stata 中,我们可以使用‘spdweight’命令来完成这一任务。
该命令可以直接根据空间权重矩阵计算反距离权重矩阵。
我们可以选择不同类型的标准化方法,如列标准化或对称标准化,以便适应特定的需求。
3. 空间矩阵标准化标准化是空间矩阵分析的重要环节,它可以帮助我们更好地理解数据的特征和局部空间依赖性。
在Stata中,我们可以使用‘stdnb’命令对反距离空间矩阵进行标准化。
该命令提供了不同的标准化方法,如罗宾逊标准化、触发点标准化和边界溢出标准化。
这样,我们可以根据特定的需求选择最适合的标准化方法。
通过以上步骤,我们可以在Stata中轻松地构建反距离空间矩阵标准化。
这种空间矩阵的分析方法对于研究空间相关性、聚类和空间回归等问题非常有用。
熟练掌握和应用这些命令,可以帮助我们更好地理解地理现象并进行深入的空间数据分析。
个人观点和理解:反距离空间矩阵标准化是一种非常有用的方法,可以帮助我们更好地理解地理现象背后的空间关系。
stata调用空间矩阵
stata调用空间矩阵Stata 中使用空间权重矩阵空间权重矩阵在空间计量经济学分析中至关重要,它用于表示地理实体之间的空间关系。
Stata 提供了多种方法来构建和导入空间权重矩阵。
构建空间权重矩阵使用 spweight 命令:spweight 命令可用于基于空间距离、空间邻接或其他自定义标准生成空间权重矩阵。
语法为:```stataspweight matrixname wtype options```其中,matrixname 指定矩阵名称,wtype 指定权重类型,options 指定生成矩阵的附加选项。
例如,要基于欧氏距离生成空间权重矩阵,可使用以下命令:```stataspweight mymatrix euclidean```从文件导入空间权重矩阵Stata 也支持从文件导入空间权重矩阵。
支持多种文件格式,包括文本文件、dbf 文件和 shapefile。
要从文本文件导入矩阵,可使用以下命令:```stataimport delimited mymatrix.wgt filename.txt```确保该文件包含以逗号分隔的权重值。
空间权重矩阵的类型Stata 中有几种不同类型的空间权重矩阵:二元权重矩阵:表示两个地理实体是否相邻或在指定距离内。
连续权重矩阵:表示两个地理实体之间的距离或其他空间度量。
对称权重矩阵:其中两个地理实体之间的权重相等。
非对称权重矩阵:其中两个地理实体之间的权重不等。
权重标准化在进行空间分析之前,通常需要对空间权重矩阵进行标准化。
标准化涉及将权重除以它们的行和或列总和,以确保矩阵中所有行的总和为 1。
Stata 提供了以下命令进行标准化:rowstandardize:对行进行标准化colstandardize:对列进行标准化空间分析一旦构建或导入空间权重矩阵,就可以将其用于各种空间分析,例如:空间自相关:测量地理实体中数据的空间集中或分散程度。
空间回归:考虑空间相关性的回归分析。
【计量】空间杜宾模型代码
空间杜宾模型stata代码clear allcd "F:\stata14\ado\mydo\agglo"**调入权重矩阵use Wqiantaoinver.dta, clearkeep s*save "W2.dta" ,replace**矩阵转换为stata应用格式spatwmat using W2, name(W)standardizematrix list W***调入数据use data11.21.dta, clear*对数生成gen lnii=ln(ii)gen lnp=ln(p)gen lna=ln(a)gen lnt=ln(t)gen lnc=ln(c)*设定面板数据格式xtset id year**变量描述性统计local x " ii c p a t" //5个变量tabstat `x', s(mean sd min p25 p50 p75 max) ///format(%6.4f) c(s)*****(2)estimation****SDM estimation(个体固定ind)//Spatial Durbin model (SDM)xsmle lnii lnc lnp lna lnt, wmat(W) model(sdm) fe type(ind) nsim(500) nolog effectsest store M_sptial //不要加入c三次方lna_2,使用第三产业,加入c_lng交乘项estat ic //AIC BIC test//Spatial Durbin model (时间固定time)xsmle lnii lnc lnp lna lnt, wmat(W) model(sdm) fe type(time) nsim(500) nolog effects est store M_timeestat ic//Spatial Durbin model(双固定,both)xsmle lnii lnc lnp lna lnt , wmat(W) model(sdm) fe type(both) nsim(500) nolog effects est store M_bothestat ic**结果汇总列表显示local m "M_sptial M_time M_both"esttab `m', mtitle(`m') nogap s(r2 ll aic bic N ) ///star(* 0.1 ** 0.05 *** 0.01) b(%6.3f)esttab M_sptial M_time M_both using pane0000.rtf //输出结果rtf excel doc****hausman testxsmle lnii lnc lnp lna lnt , wmat(W) model(sdm) fe type(both) nsim(500) nolog estimates store sdm_fexsmle lnii lnc lnp lna lnt , wmat(W) model(sdm) re type(both) nsim(500) nolog estimates store sdm_rehausman sdm_fe sdm_re。
空间模型lm检验stata命令
空间模型lm检验stata命令在统计学中,线性回归模型是一种常用的统计方法,用于研究变量之间的关系。
而空间模型则是在线性回归模型的基础上,考虑了空间相关性的影响。
在进行空间数据分析时,我们经常需要对模型的显著性进行检验,以确定模型的适用性和可靠性。
在stata软件中,提供了丰富的命令来进行空间模型的lm检验。
其中,最常用的命令是“spatialreg”。
接下来,我们将介绍如何使用该命令进行lm检验,并解释其结果。
我们需要导入空间数据并构建空间模型。
假设我们有一组房价数据,我们希望研究房价与周围环境因素的关系。
我们可以使用stata中的“spatwmat”命令来构建空间权重矩阵。
然后,我们可以使用“spatialreg”命令来进行空间回归分析。
在该命令中,我们可以指定自变量和因变量,并选择适当的空间权重矩阵。
例如,我们可以使用以下命令构建一个简单的空间模型:spatialreg dependent_var independent_var, weights(weight_matrix)其中,“dependent_var”表示因变量,而“independent_var”表示自变量。
“weight_matrix”表示我们构建的空间权重矩阵。
当我们运行这个命令后,stata会输出模型的估计结果,包括回归系数、标准误差和t值。
这些结果可以帮助我们判断自变量是否对因变量有显著影响。
然而,仅仅通过这些结果还无法确定模型的整体显著性。
为了进行lm检验,我们可以使用“estat lmtest”命令。
这个命令可以计算模型的F统计量和p值,以确定模型的整体显著性。
我们可以在空间回归分析后,使用以下命令进行lm检验:estat lmtest运行这个命令后,stata会输出模型的F统计量、自由度和p值。
如果p值小于设定的显著性水平(通常为0.05),则我们可以拒绝原假设,即模型是显著的。
除了lm检验,stata还提供了其他命令来评估空间模型的拟合优度和稳健性。
空间相邻权重矩阵stata命令
空间相邻权重矩阵stata命令
在Stata中,要创建空间相邻权重矩阵,你可以使用`spmat`命令。
空间相邻权重矩阵通常用于空间数据分析,它表示了地理空间上的邻近关系。
以下是一个简单的示例来说明如何使用`spmat`命令创建空间相邻权重矩阵:
首先,假设你有一个地理空间数据集,其中包含了每个地区的经纬度信息。
你可以使用这些信息来构建空间相邻权重矩阵。
stata.
导入数据。
import delimited "yourfile.csv", clear.
创建经纬度变量。
gen lonlat = "("+string(longitude) + " " +
string(latitude)+")"
生成空间相邻权重矩阵。
spmat create W, from(lonlat) id(your_id_variable) replace.
在这个例子中,你需要将"yourfile.csv"替换为你的数据文件名,"longitude"和"latitude"替换为你数据集中的经度和纬度变量名,"your_id_variable"替换为你的地区标识变量名。
这段代码将创建一个空间相邻权重矩阵并将其命名为"W"。
当然,这只是一个简单的示例。
在实际应用中,你可能需要根据你的数据集和分析目的进行调整和扩展。
希望这个回答能够帮助到你。
空间计量模型stata代码
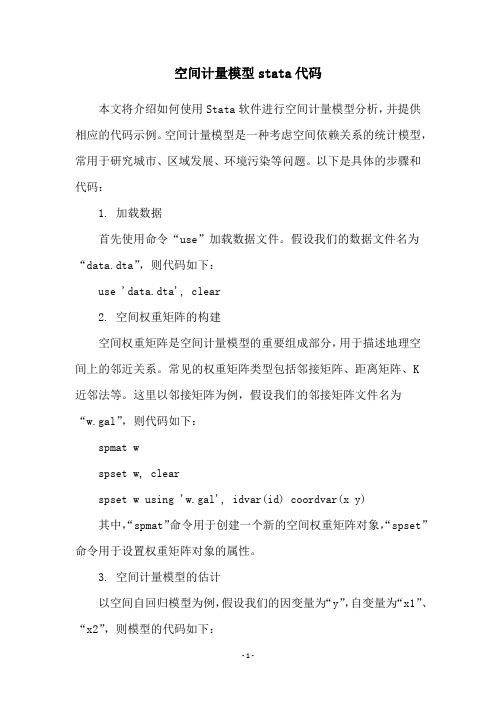
空间计量模型stata代码本文将介绍如何使用Stata软件进行空间计量模型分析,并提供相应的代码示例。
空间计量模型是一种考虑空间依赖关系的统计模型,常用于研究城市、区域发展、环境污染等问题。
以下是具体的步骤和代码:1. 加载数据首先使用命令“use”加载数据文件。
假设我们的数据文件名为“data.dta”,则代码如下:use 'data.dta', clear2. 空间权重矩阵的构建空间权重矩阵是空间计量模型的重要组成部分,用于描述地理空间上的邻近关系。
常见的权重矩阵类型包括邻接矩阵、距离矩阵、K近邻法等。
这里以邻接矩阵为例,假设我们的邻接矩阵文件名为“w.gal”,则代码如下:spmat wspset w, clearspset w using 'w.gal', idvar(id) coordvar(x y) 其中,“spmat”命令用于创建一个新的空间权重矩阵对象,“spset”命令用于设置权重矩阵对象的属性。
3. 空间计量模型的估计以空间自回归模型为例,假设我们的因变量为“y”,自变量为“x1”、“x2”,则模型的代码如下:spreg y x1 x2, wmatrix(w) robust其中,“spreg”命令用于进行空间自回归模型的估计,“wmatrix”选项用于指定权重矩阵对象,“robust”选项用于进行异方差性处理。
4. 结果输出和解释最后,使用“estimates”命令输出模型的估计结果,并进行解释。
例如,下面的代码将输出估计结果的标准误、t值和p值:estimates store model1estimates table model1, b(se) t(p) star(0.1 0.05 0.01) 其中,“estimates store”命令用于将估计结果存储到模型对象中,“estimates table”命令用于输出估计结果的表格形式。
解释结果时,需要注意权重矩阵的特征值和特征向量,以及空间自相关性的类型和程度。
Stata空间计量命令汇总及具体操作方法指南
Stata空间计量命令汇总及具体操作方法指南空间计量经济学创造性地处理了经典计量方法在面对空间数据时的缺陷,考察了数据在地理观测值之间的关联。
近年来在人文社会科学空间转向的大背景下,空间计量已成为空间综合人文学和社会科学研究的基础理论与方法,尤其在区域经济、房地产、环境、人口、旅游、地理、政治等领域,空间计量成为开展定量研究的必备技能。
1、空间计量建模步骤空间统计分析:构建空间权重矩阵后,进行探索性空间统计分析:包括空间相关性检验(全局空间自相关和局部空间自相关等);空间计量分析:空间计量模型的回归与检验(SAR,SEM,SAC 等模型估计和检验等)。
空间滞后模型(Spatial Lag Model,SLM)主要是探讨各变量在一地区是否有扩散现象(溢出效应)。
其模型表达式为:参数反映了自变量对因变量的影响,空间滞后因变量是一内生变量,反映了空间距离对区域行为的作用。
区域行为受到文化环境及与空间距离有关的迁移成本的影响,具有很强的地域性(Anselin et al.,1996)。
由于SLM模型与时间序列中自回归模型相类似,因此SLM也被称作空间自回归模型(Spatial Autoregressive Model,SAR)。
空间误差模型(Spatial Error Model,SEM)存在于扰动误差项之中的空间依赖作用,度量了邻近地区关于因变量的误差冲击对本地区观察值的影响程度。
由于SEM模型与时间序列中的序列相关问题类似,也被称为空间自相关模型(Spatial Autocorrelation Model,SAC)。
估计技术:鉴于空间回归模型由于自变量的内生性,对于上述两种模型的估计如果仍采用OLS,系数估计值会有偏或者无效,需要通过IV、ML或GLS、GMM等其他方法来进行估计。
Anselin (1988)建议采用极大似然法估计空间滞后模型(SLM)和空间误差模型(SEM)的参数。
空间自相关检验与SLM、SEM的选择:判断地区间创新产出行为的空间相关性是否存在,以及SLM和SEM那个模型更恰当,一般可通过包括Moran’s I检验、两个拉格朗日乘数(Lagrange Multiplier)形式LMERR、LMLAG及其稳健(Robust)的R-LMERR、R-LMLAG)等形式来实现。
利用STATA创建空间权重矩阵与空间杜宾模型计算----命令
** 创建空间权重矩阵介绍*设置默认路径cd C:\Users\xiubo\Desktop\F182013.v4\F101994\sheng** 创建新文件*shp2dta:reads a shape (.shp) and dbase (.dbf) file from disk and converts them into Stata datasets.*shp2dta: 读取CHN_adm1 文件*CHN_adm1:为已有的地图文件*database (chinaprovince) :表示创建一个名称为“chinaprovince ”的dBase数据集*database(filename) :Specifies filename of new dBase dataset*coordinates(coord) :创建一个名称为“coord”的坐标系数据集*coordinates(filename) :Specifies filename of new coordinates dataset*gencentroids(stub) :Creates centroid variables*genid(newvarname) :Creates unique id variable for database.dtashp2dta using CHN_adm1,database (chinaprovince) coordinates(coord) genid(id) gencentroids(c)** 绘制2016 年中國GDP分布圖*spmap:Visualization of spatial data*clnumber(#):number of classes*id(idvar):base map polygon identifier( 识别符,声明变量名,一般以字母或下划线开头,包含数字、字母、下划线)*_2016GDP:变量*coord: 之前创建的坐标系数据集spmap _2016GDP using coord, id(id) clnumber(5)*更改变量名rename x_c longituderename y_c latitude** 生成距离矩阵*spmat: 用于定义与管理空间权重矩阵*Spatial-weighting matrices are stored in spatial-weighting matrix objects (spmat objects).*spmat objects contain additional information about the data used in constructing spatial-weighting matrices.*spmat objects are used in fitting spatial models; see spreg (if installed) and spivreg (if installed).*idistance:( 产生距离矩阵)create an spmat object containing an inverse-distance matrix W*或contiguity:create an spmat object containing a contiguity matrix W*idistance_jingdu: 命名名称为“idistance_jingdu ”的距離矩陣*longitude: 使用经度*latitude: 使用纬度*id(id): 使用id*dfunction(function[, miles]):( 设置计算距离方法)specify the distance function.*function may be one of euclidean (default), dhaversine, rhaversine, or the Minkowski distanceof order p, where p is an integer greater than or equal to 1.*normalize(row): (行标准化)specifies one of the three available normalization techniques: row, minmax, and spectral.*In a row-normalized matrix, each element in row i is divided by the sum of row i's elements.*In a minmax-normalized matrix, each element is divided by the minimum of the largest rowsum and column sum of the matrix.*In a spectral-normalized matrix, each element is divided by the modulus of the largest eigenvalue of the matrix.spmat idistance idistance_jingdu longitude latitude, id(id) dfunction(euclidean) normalize(row)** 保存stata 可读文件idistance_jingdu.spmatspmat save idistance_jingdu using idistance_jingdu.spmat** 将刚刚保存的idistance_jingdu.spmat 文件转化为txt 文件spmat export idistance_jingdu using idistance_jingdu.txt** 生成相邻矩阵spmat contiguity contiguity_jingdu using coord, id(id) normalize(row)spmat save contiguity_jingdu using contiguity_jingdu.spmatspmat export contiguity_jingdu using contiguity_jingdu.txt** 计算Moran’s I*安装spatwmat*spatwmat: 用于定义空间权重矩阵*spatwmat:imports or generates the spatial weights matrices required by spatgsa, spatlsa, spatdiag, and spatreg.*As an option, spatwmat also generates the eigenvalues matrix required by spatreg.*name(W): 读取空间权重矩阵W*name(W): 使用生成的空间权重矩阵W*xcoord:x 坐标*ycoord:y 坐标*band(0 8): 宽窗介绍*band(numlist) is required if option using filename is not specified.*It specifies the lower and upper bounds of the distance band within which location pairs mustbe considered "neighbors" (i.e., spatially contiguous)*and, therefore, assigned a nonzero spatial weight.*binary:requests that a binary weights matrix be generated. To this aim, all nonzero spatial weights are set to 1.spatwmat, name(W) xcoord(longitude) ycoord(latitude) band(0 8)*安装绘制Moran ’s I 工具:splagvar*splagvar --- Generates spatially lagged variables, constructs the Moran scatter plot,*and calculates global Moran's I statistics.*_2016GDP:使用变量_2016GDP*wname(W): 使用空间权重矩阵W*indicate the name of the spatial weights matrix to be used*wfrom(Stata):indicate source of the spatial weights matrix*wfrom(Stata | Mata) indicates whether the spatial weights matrix is a Stata matrix loaded inmemory or a Mata file located in the working directory.*If the spatial weights matrix had been created using spwmatrix it should exist as a Stata matrixor as a Mata file.*moran(_2016GDP): 计算变量_2016GDP 的Moran's I 值*plot(_2016GDP): 构建变量_2016GDPMoran 散点图splagvar _2016GDP, wname(W) wfrom(Stata) moran(_2016GDP) plot(_2016GDP)=============================================================================== ** 使用距离矩阵计算空间计量模型*设置默认路径cd 软件学习软件资料\stata\stata 指导书籍命令陈强高级计量经济学及stata 应用(第二版)全部数据*使用product.dta 数据集(陈强的高级计量经济学及其stata 应用P594)*将数据集product.dta 存入当前工作路径use product.dta , clear*创建新变量,对原有部分变量取对数gen lngsp=log(gsp)gen lnpcap=log(pcap)gen lnpc=log(pc)gen lnemp=log(emp)*将空间权重矩阵usaww.spat 存入当前工作路径spmat use usaww using usaww.spmat*使用聚类稳健的标准误估计随机效应的SDM 模型xsmle lngsp lnpcap lnpc lnemp unemp,wmat(usaww) model(sdm)robust nolog*使用选择项durbin(lnemp) ,不选择不显著的变量,使用聚类稳健的标准误估计随机效应的SDM 模型xsmle lngsp lnpcap lnpc lnemp unemp,wmat(usaww) model(sdm) durbin(lnemp) robust nolognoeffects*使用选择项durbin(lnemp) ,不选择不显著的变量,使用聚类稳健的标准误估计固定效应的SDM 模型xsmle lngsp lnpcap lnpc lnemp unemp,wmat(usaww) model(sdm) durbin(lnemp) robust nolognoeffects fe*存储随机效应和固定效应结果qui xsmle lngsp lnpcap lnpc lnemp unemp,wmat(usaww) model(sdm) durbin(lnemp) r2 nolog noeffects reest sto requi xsmle lngsp lnpcap lnpc lnemp unemp,wmat(usaww) model(sdm) durbin(lnemp) r2 nolog noeffects feest sto fe*esttab: 将保存的结果汇总到一张表格中*b(fmt):specify format for point estimates*beta[(fmt)]:display beta coefficients instead of point est's*se[(fmt)]:display standard errors instead of t statistics*star( * 0.1 ** 0.05 *** 0.01): 标记不同显著性水平对应的P 值*r2|ar2|pr2[(fmt)]:display (adjusted, pseudo) R-squared*p[(fmt)]:display p-values instead of t statistics*label:make use of variable labels*title(string):specify a title for the tableesttab fe re , b se r2 star( * 0.1 ** 0.05 *** 0.01)*hausman 检验*进行hausman 检验前,回归中没有使用稳健标准误(没用“r”),*是因为传统的豪斯曼检验建立在同方差的前提下*constant:include estimated intercepts in comparison; default is to exclude*df(#):use # degrees of freedom*sigmamore:base both (co)variance matrices on disturbance variance estimate from efficient estimator*sigmaless:base both (co)variance matrices on disturbance variance estimate from consistent estimatorhausman fe re** 有时我们还会得到负的chi2 值,即chi2<0,表明模型不能满足Hausman 检验的渐近假设。
stata地理距离空间权重矩阵
STATA地理距离空间权重矩阵在Stata中构建地理距离空间权重矩阵的步骤如下:1.准备数据:确保你的数据集中包含了每个观测值(例如,地区、城市等)的地理坐标(如纬度和经度)。
2.计算距离:使用Stata的地理距离函数(如geodist)来计算每对观测值之间的地理距离。
这可以通过一个循环或者egen命令实现。
3.创建空间权重矩阵:基于计算出的地理距离,你可以创建一个空间权重矩阵。
这个矩阵通常是一个对称矩阵,其中每个元素表示对应观测值之间的空间权重。
权重可以根据距离的倒数、距离的倒数的平方等函数来确定。
4.标准化权重:为了消除由于观测值数量或分布不均导致的权重差异,你可能需要对空间权重矩阵进行行标准化,使每行的元素之和为1。
以下是一个简化的Stata代码示例,用于构建基于地理距离的空间权重矩阵:stata* 假设你的数据集名为"mydata",包含变量"lon"和"lat"分别表示经度和纬度* 首先,计算每对观测值之间的地理距离,并将结果保存在新变量"dist"中egen dist = geodist(lon lat), by(id)* 然后,创建一个空间权重矩阵,这里我们使用距离的倒数作为权重tempname Wmatrix `W' = J(_N, _N, 0) // 初始化一个N×N的零矩阵,其中N是观测值的数量forvalues i = 1/`=_N' {forvalues j = 1/`=_N' {if `i' != `j' {scalar weight = 1 / dist[`i', `j']matrix `W'[`i', `j'] = weightmatrix `W'[`j', `i'] = weight // 由于矩阵是对称的,所以同时设置两个元素}}}* 最后,对空间权重矩阵进行行标准化matrix rowtotal = rowtotal(`W')forvalues i = 1/`=_N' {matrix `W'[`i', 1..`=_N'] = `W'[`i', 1..`=_N'] / rowtotal[`i', 1]}* 现在,你的空间权重矩阵已经构建完成,并保存在名为`W`的矩阵中请注意,上述代码只是一个示例,你可能需要根据你的具体需求和数据结构进行适当的修改。
利用Stata命令进行空间杜宾模型分析
利用Stata命令进行空间杜宾模型分析标题:利用Stata命令进行空间杜宾模型分析介绍:在空间计量经济学领域,空间杜宾模型(Spatial Durbin Model)被广泛应用于探究空间依赖关系对经济现象的影响。
Stata作为一款常用的统计软件,提供了许多强大的命令来进行空间经济分析。
本文将介绍如何利用Stata命令进行空间杜宾模型的分析和解释。
一、概述空间杜宾模型是对传统杜宾模型的扩展,考虑了空间上的相互依赖关系。
其基本方程可以表示为:Y = ρWy + Xβ + λU + ε其中,Y是因变量,Wy表示空间邻近权重矩阵与因变量的乘积,X是自变量矩阵,β是参数向量,U是随机误差项,ε是空间误差项。
ρ和λ分别代表空间滞后和同时方程的空间依赖系数。
二、数据准备在Stata中进行空间杜宾模型的分析,首先要准备好需要的数据。
可以使用Stata的数据管理命令进行数据导入和转换,确保数据的一致性和准确性。
还需考虑到空间邻近权重矩阵的构建,可以使用Stata的空间数据分析命令来计算邻近矩阵。
三、模型估计利用Stata进行空间杜宾模型的估计,可以使用"splm"命令。
该命令提供了多种空间经济模型的估计方法,包括最小二乘法(OLS)、广义矩估计法(GMM)等。
在使用"splm"命令时,需要设定模型的形式和变量的选择。
四、模型诊断和解释为了确保模型的有效性和准确性,需要对模型进行诊断和解释。
可以通过Stata的模型诊断命令来进行一系列统计分析,如异方差性检验、空间误差的显著性检验等。
还可以使用Stata的模型解释命令来获取模型估计结果的解释,并进行进一步的分析和讨论。
五、实证案例分析在本节中,将以一个实证案例来展示如何使用Stata命令进行空间杜宾模型的分析。
案例数据为某地区的经济数据,包括GDP、人口、贸易等变量。
我们希望研究空间依赖对GDP的影响,并通过空间杜宾模型来分析这一关系。
空间计量模型stata代码
空间计量模型stata代码
空间计量模型stata代码是一种用于空间数据分析的统计软件,在stata中可以进行空间计量模型的建模和分析。
具体的代码包括以下几个步骤:
1.导入数据:使用stata命令“use”或者“import”导入需要分析的数据集。
2.定义空间权重矩阵:使用stata命令“spmat”或者“spwmatrix”定义空间权重矩阵,用于描述空间上的邻近关系。
3.空间回归模型建模:使用stata命令“spreg”或者“spatialreg”建立空间回归模型,其中包括空间滞后模型、空间错误模型、空间滞后误差模型等。
4.模型诊断和评价:使用stata命令“spatdiag”或者“sppack”对建立的空间回归模型进行诊断和评价,包括空间自相关性检验、异方差性检验、模型拟合度评价等。
5.结果分析和可视化:使用stata命令“spmap”或者“spgraph”对分析结果进行可视化展示,以便更好地理解和解释分析结果。
总之,空间计量模型stata代码是一种非常重要的工具,可以帮助研究者更好地理解和分析空间数据,并为相关领域的研究提供支持和帮助。
- 1 -。
Stata空间相关检验详细步骤
第一步:生成权重矩阵
输入命令:spweight var1 var2 , panel(29) time(5) matrix(wei) eigw stand table ptable(其中spweight需要安装)
29代表29个省份;5代表年限;wei代表接下来产生的截面矩阵为weics,产生的面板矩阵为weixt;最终结果为标准化以后的权重矩阵。
第二步:检验是否存在空间自相关性(计算Moran的指数)
首先,输入use weics.dta即打开截面权重表
其次,输入spatwmat using weics.dta, name(weics) standardize即将截面权重表weics进行标准化,并重新命名为weics
然后,输入截面数据,将2009年的截面数据输入到软件中,保存并命名为2009shuju.dta,并输入use 2009shuju.dta
接着,输入spatgsa lq,weights(weics) moran twotail,(其中spatgsa需要安装),即用截面权重weics计算出因变量lq的全域morna’s I指数值,其结果如下所示
morna’s I=0.273,可以说lq存在明显的空间自相关。
stata区域权重矩阵制作命令
在Stata中,你可以使用`pwcorr`命令来制作区域权重矩阵。
区域权重矩阵是一种用于处理空间数据或地理数据的重要工具,它可以帮助模型更好地捕捉空间依赖性。
以下是制作区域权重矩阵的基本步骤和命令:步骤一:确保你的数据集包含了需要用于权重矩阵的地理信息。
通常,这些信息包括地区名称、地理位置等。
步骤二:使用`pwcorr`命令来制作区域权重矩阵。
在Stata中,你可以通过以下命令来使用`pwcorr`:```statapwcorr varlist, by(groupvar)```其中,`varlist`是你想要用于权重矩阵的变量列表,而`groupvar`则是用于划分组的变量。
根据你的数据集,你可以适当调整这两个参数。
注意事项:* 确保你的数据已经适当地格式化,并且能够被Stata正确识别。
* 如果你的数据集没有地理信息或地理位置数据,可能需要先进行适当的预处理,例如导入空间数据或手动标记地区边界。
* `pwcorr`命令默认使用欧几里得距离作为距离度量。
如果你需要使用其他距离度量,可以在命令中指定`weight.dist`选项。
制作区域权重矩阵的命令示例:假设你的数据集包含地区名称、人口数量和人均GDP等变量,并且你想要将这些变量用于权重矩阵。
假设你的数据集名为"data.dta",并且地区名称变量名为"region",人口数量变量名为"pop",人均GDP变量名为"gdp"。
在你的Stata会话中,你可以运行以下命令来制作区域权重矩阵:```statapwcorr pop gdp, by(region)```这将根据地区名称变量将数据集划分为不同的组,并使用人口数量和人均GDP变量来制作区域权重矩阵。
生成的权重矩阵将包含在Stata的数据文件中。
请注意,这只是一种基本的制作区域权重矩阵的方法,具体步骤和命令可能因数据集而异。
空间杜宾模型stata命令
空间杜宾模型stata命令空间杜宾模型是一种用于分析空间数据的统计模型,它可以考虑空间自相关性和空间异质性的影响,从而更准确地估计模型参数和预测空间数据。
在stata软件中,可以使用spatial Durbin模型命令(sdm)来实现空间杜宾模型的估计和推断。
主要内容如下:1. 模型设定空间杜宾模型是一种广义线性模型,可以用以下方程表示:y = Xβ + ρWy + λWx + ε其中,y是因变量,X是自变量矩阵,β是自变量系数向量,Wy和Wx分别是空间滞后因变量和自变量矩阵,ρ和λ是空间滞后系数,ε是误差项。
空间滞后项可以用空间权重矩阵W来表示,W是一个n×n的对称矩阵,其中n是样本数,Wij表示第i个样本和第j个样本之间的空间关系。
2. 命令语法在stata中,可以使用以下命令语法来估计空间杜宾模型:sdm depvar [indepvars] [if] [in] [weight] [, options]其中,depvar是因变量名称,indepvars是自变量名称,if、in和weight是数据子集、数据集和权重选项,options是其他模型选项,如空间权重矩阵类型、空间滞后项类型、估计方法等。
3. 命令选项sdm命令有多个选项可供选择,以下是一些常用选项的说明:(1)spatialweight:指定空间权重矩阵类型,可以是queen、rook、knn、distance等。
(2)spatiallag:指定空间滞后项类型,可以是dependent、independent、mixed等。
(3)method:指定估计方法,可以是maximum likelihood、generalized method of moments等。
(4)robust:指定是否使用鲁棒标准误和t统计量。
(5)laglist:指定自变量的空间滞后阶数。
(6)rho:指定空间滞后系数的初始值。
(7)lambda:指定空间自变量系数的初始值。
stata 经纬度 空间权重矩阵
stata 经纬度空间权重矩阵Stata是一款广泛使用的数据分析软件,包括空间统计分析在内。
经纬度数据以及空间权重矩阵都是空间统计分析中不可或缺的重要元素。
在使用Stata进行空间统计分析时,掌握如何处理经纬度数据以及生成空间权重矩阵是十分必要的技能。
一、经纬度数据经纬度数据是一种地理定位数据。
它是一个由纬度和经度两个数值组成的坐标,可以唯一地用来确定地球上某个地点的位置。
我们通常使用latitude(纬度)和longitude(经度)来表示。
在Stata中,我们可以使用geocode命令将地名转换成经纬度数据。
例如,我们可以将中国的北京市转换成经纬度数据,命令如下:```geocode "北京市"```在得到经纬度数据后,我们可以将其作为变量,并在后续的空间分析中使用它们。
在这之前,我们需要确保经纬度数据的格式正确,即纬度和经度的值要分别保存在以相应名称命名的变量中。
二、空间权重矩阵空间权重矩阵是空间统计分析中重要的概念之一。
它反映了空间上相邻地点之间的联系程度。
权重矩阵的元素通常是非负实数,一般情况下,矩阵的对角线元素为0,权重矩阵是对称的。
权重矩阵的大小取决于所分析的区域的数量。
在Stata中,我们可以使用spmat命令生成空间权重矩阵。
具体操作如下:1. 准备空间数据,即地点的经纬度位置。
在本例中,我们以中国城市为例,先使用geocode命令获取它们的经纬度坐标;2. 计算空间权重矩阵。
空间权重矩阵可以有多种类型,如Queen,Rook等。
在本例中,我们使用Queen类型的空间权重矩阵,也就是对于每个城市,它的相邻城市都会受到权重的影响。
可以使用以下命令计算该权重矩阵:```spmat queenw, id(District) latitude(latitude) longitude(longitude) units(km)```其中,queenw是生成的权重矩阵的名称,id(District)是城市名称变量的名称,latitude是纬度变量的名称,longitude是经度变量的名称,units(km)指定了距离的单位是千米。
空间杜宾模型stata代码,包含空间权重矩阵制作、空间相关性检验以及地图绘制全过程
cd "C:\Users\Desktop\空间杜宾模型和检验以及结果解释\stata数据1"空间杜宾模型和检验以及结果解释\stata数据//设为自己的工作路径use data,clear***一、变量的描述性统计sum y x1 x2 x3 a1 a2 a3 a4***二、空间计量模型准备工作gen lnx1 = ln(x1)gen lnx2 = ln(x2)gen lnx3 = ln(x3)replace lnx1 =0 if missing(lnx1)***三、空间权重矩阵制作spatwmat using W.dta, n(W) standardizematrix list W***四、空间相关性检验**Moran’s I指数*(1)计算全局莫兰指数xtset id yearspatwmat using W.dta, n(W) standardize=============================!!!!!从preserve到restore务必视为一个整体,选中一起执行!!============1.方法1preservekeep if year==2004 //改变年份2004spatgsa y,weights(W) moran geary twotailrestoreforvalue i = 2004/2016{preservekeep if year==`i'spatgsa y,weights(W) moran twotail //计算全局莫兰指数restore}2.方法2(因为扩大了矩阵,所以可以同时对所有年份求全局莫兰指数)clear alluse W,clear //W为矩阵名称spcs2xt a1-a30,matrix(aaa)time(13) //扩大权重矩阵数量,因为W是30x30而样本有390组观测值,需要扩大13倍,此时会生成aaaxt.dta的390x390的权重矩阵spatwmat using aaaxt,name(W) standardizeuse data, clearspatgsa y,weights(W) moran geary twotail*(2)计算局部莫兰指数use data,clearxtset id yearspatwmat using W.dta, n(W) standardizepreservekeep if year==2006 //改变年份2004spatlsa y,weights(W) moran twotail //计算局部莫兰指数restore**moran散点图*第一种方法preservekeep if year==2004 //改变年份2004splagvar y , wname(W) wfrom(Stata) moran(y) plot(y)restore*第二种方法1.方法一preservekeep if year==2016 //改变年份2019spatlsa y,weights(W)moran graph(moran) symbol(id) id(pro) //显示地名restore2.方法二clear alluse W,clear //W为矩阵名称spcs2xt a1-a30,matrix(aaa)time(13) //扩大权重矩阵数量,因为W是30x30而样本有390组观测值,需要扩大13倍,此时会生成aaaxt.dta的390x390的权重矩阵spatwmat using aaaxt,name(W) standardizeuse data, clearspatlsa y,weights(W)moran graph(moran) symbol(id) id(pro)***五、空间计量模型**空间杜宾模型(SDM)use data,clearxtset id yearspatwmat using W.dta,name(W) standardize*随机效应模型xsmle y x* a*, model(sdm) wmat(W) type(both) nolog effects re*时间固定效应xsmle y x* a*, model(sdm) wmat(W) type(time) nolog effects fe*个体固定效应xsmle y x* a*, model(sdm) wmat(W) type(ind) nolog effects fe*双固定效应xsmle y x* a*, model(sdm) wmat(W) type(both) nolog effects fe**空间误差模型(SEM)xtset id yearspatwmat using W.dta,name(W) standardize*随机效应模型xsmle y x* a*, model(sem) emat(W) type(both) nolog effects re*时间固定效应xsmle y x* a*, model(sem) emat(W) type(time) nolog effects fe*个体固定效应xsmle y x* a*, model(sem) emat(W) type(ind) nolog effects fe*双固定效应xsmle y x* a*, model(sem) emat(W) type(both) nolog effects fe**空间滞后模型(SLM)xtset id yearspatwmat using W.dta,name(W) standardize*随机效应模型xsmle y x* a*, model(sar) wmat(W) type(both) nolog effects re*时间固定效应xsmle y x* a*, model(sar) wmat(W) type(time) nolog effects fe*个体固定效应xsmle y x* a*, model(sar) wmat(W) type(ind) nolog effects fe*双固定效应xsmle y x* a*, model(sar) wmat(W) type(both) nolog effects fe***六、相关检验**6.1LM检验(只有LM检验需要扩大矩阵)clear alluse data, clearuse W //W为矩阵名称spcs2xt a1-a30,matrix(aaa)time(13) //扩大权重矩阵数量,因为W是30x30而样本有390组观测值,需要扩大13倍,此时会生成aaaxt.dta的390x390的权重矩阵spatwmat using aaaxt,name(W)clearuse data //调用论文数据dataxtset id yearreg y x1 x2 x3 a1 a2 a3 a4spatdiag,weights(W)**6.2效应检验use data,clearxtset id yearspatwmat using W.dta, n(W) standardizexsmle y x1 x2 x3 a1 a2 a3 a4 , fe model(sdm) wmat(W) nolog noeffects type(ind)est store indxsmle y x1 x2 x3 a1 a2 a3 a4 , fe model(sdm) wmat(W) nolog noeffects type(time)est store timexsmle y x1 x2 x3 a1 a2 a3 a4 , fe model(sdm) wmat(W) nolog noeffects type(both)est store bothlrtest both ind,df(10) //比较“双向”和“个体”效应LR检验lrtest both time,df(10) //比较“时间”和“双向”效应LR检验drop _est_ind _est_time _est_both**6.3Hausman检验xsmle y x1 x2 x3 a1 a2 a3 a4 , fe model(sdm) wmat(W) nolog noeffects type(both)est store fexsmle y x1 x2 x3 a1 a2 a3 a4 , re model(sdm) wmat(W) nolog noeffects type(both)est store rehausman fe re**6.4Wald检验clear alluse dataspatwmat using W.dta,name(W) standardizextset id yearxsmle y x* a*, fe model(sdm) wmat(W) type(both) nolog noeffects//Wald Test for SARtest [Wx]x1 = [Wx]x2 = [Wx]x3 = [Wx]a1= [Wx]a2= [Wx]a3= [Wx]a4=0//Wald Test for SEMtestnl ([Wx]x1 = -[Spatial]rho*[Main]x1)([Wx]x2 = -[Spatial]rho*[Main]x2)([Wx]x3= -[Spatial]rho*[Main]x3) ([Wx]a1 = -[Spatial]rho*[Main]a1)([Wx]a2= -[Spatial]rho*[Main]a2) ([Wx]a3 = -[Spatial]rho*[Main]a3)([Wx]a4= -[Spatial]rho*[Main]a4)**6.5 LR检验xsmle y x* a*, fe model(sdm) wmat(W) type(both) nolog noeffectsest store sdmxsmle y x* a*, fe model(sar) wmat(W) type(both) nolog noeffectsest store sarxsmle y x* a*, fe model(sem) emat(W) type(both) nolog noeffectsest store semlrtest sdm sar //H0:空间杜宾模型可以简化为空间滞后模型(SAR)lrtest sdm sem //H0:空间杜宾模型可以简化为空间误差模型(SEM)**七、空间杜宾模型结果解释xsmle y x1 x2 x3 a1 a2 a3 a4 , fe model(sdm) wmat(W) nolog noeffects type(both)xsmle y x1 x2 x3 a1 a2 a3 a4 , fe model(sdm) wmat(W) nolog effects type(both) //效应分解了!xsmle y x1 x2 x3 a1 a2 a3 a4 , fe model(sdm) wmat(W) nolog noeffects type(ind)est store indxsmle y x1 x2 x3 a1 a2 a3 a4 , fe model(sdm) wmat(W) nolog noeffects type(time)est store timexsmle y x1 x2 x3 a1 a2 a3 a4 , fe model(sdm) wmat(W) nolog noeffects type(both)est store both**以下三行代码一起执行!!!local m " ind time both"esttab `m', mtitle(`m') nogap s(r2 N )logout, save(Descriptive2) word replace: esttab `m', mtitle(`m') nogap s(r2 N ) //输出到word**八、绘制地图(包含南海九段线的中国地图)cd C:\Users\52811\Desktop\空间杜宾模型和检验以及结果解释\中国地图//根据自己情况调整,调整至工作目录中国地图use china_province_data,clear**从excel表格中,把变量y复制过来!!!!spmap y using "china_province_co",id(area_id) clnumber(3) title("中国地图") label(label(name) xcoord(xxx) ycoord(yyy) size(*.76)) fcolor(Reds)。
利用STATA创建空间权重矩阵及空间杜宾模型计算----命令
** 创建空间权重矩阵介绍*设置默认路径cd C:\Users\xiubo\Desktop\F182013.v4\F101994\sheng**创建新文件*shp2dta:reads a shape (.shp) and dbase (.dbf) file from disk and converts them into Stata datasets.*shp2dta:读取CHN_adm1文件*CHN_adm1:为已有的地图文件*database (chinaprovince):表示创建一个名称为“chinaprovince”的dBase数据集*database(filename):Specifies filename of new dBase dataset*coordinates(coord):创建一个名称为“coord”的坐标系数据集*coordinates(filename):Specifies filename of new coordinates dataset*gencentroids(stub):Creates centroid variables*genid(newvarname):Creates unique id variable for database.dtashp2dta using CHN_adm1,database (chinaprovince) coordinates(coord) genid(id) gencentroids(c)**绘制2016年中國GDP分布圖*spmap:Visualization of spatial data*clnumber(#):number of classes*id(idvar):base map polygon identifier(识别符,声明变量名,一般以字母或下划线开头,包含数字、字母、下划线)*_2016GDP:变量*coord:之前创建的坐标系数据集spmap _2016GDP using coord, id(id) clnumber(5)*更改变量名rename x_c longituderename y_c latitude**生成距离矩阵*spmat:用于定义与管理空间权重矩阵*Spatial-weighting matrices are stored in spatial-weighting matrix objects (spmat objects).*spmat objects contain additional information about the data used in constructing spatial-weighting matrices.*spmat objects are used in fitting spatial models; see spreg (if installed) and spivreg (if installed).*idistance:(产生距离矩阵)create an spmat object containing an inverse-distance matrix W*或contiguity:create an spmat object containing a contiguity matrix W*idistance_jingdu:命名名称为“idistance_jingdu”的距離矩陣*longitude:使用经度*latitude:使用纬度*id(id):使用id*dfunction(function[, miles]):(设置计算距离方法)specify the distance function.*function may be one of euclidean (default), dhaversine, rhaversine, or the Minkowski distance of order p, where p is an integer greater than or equal to 1.*normalize(row):(行标准化)specifies one of the three available normalization techniques: row, minmax, and spectral.*In a row-normalized matrix, each element in row i is divided by the sum of row i's elements.*In a minmax-normalized matrix, each element is divided by the minimum of the largest row sum and column sum of the matrix.*In a spectral-normalized matrix, each element is divided by the modulus of the largest eigenvalue of the matrix.spmat idistance idistance_jingdu longitude latitude, id(id) dfunction(euclidean) normalize(row)**保存stata可读文件idistance_jingdu.spmatspmat save idistance_jingdu using idistance_jingdu.spmat**将刚刚保存的idistance_jingdu.spmat文件转化为txt文件spmat export idistance_jingdu using idistance_jingdu.txt**生成相邻矩阵spmat contiguity contiguity_jingdu using coord, id(id) normalize(row)spmat save contiguity_jingdu using contiguity_jingdu.spmatspmat export contiguity_jingdu using contiguity_jingdu.txt**计算Moran’s I*安装spatwmat*spatwmat:用于定义空间权重矩阵*spatwmat:imports or generates the spatial weights matrices required by spatgsa, spatlsa, spatdiag, and spatreg.*As an option, spatwmat also generates the eigenvalues matrix required by spatreg.*name(W):读取空间权重矩阵W*name(W):使用生成的空间权重矩阵W*xcoord:x坐标*ycoord:y坐标*band(0 8):宽窗介绍*band(numlist) is required if option using filename is not specified.*It specifies the lower and upper bounds of the distance band within which location pairs must be considered "neighbors" (i.e., spatially contiguous)*and, therefore, assigned a nonzero spatial weight.*binary:requests that a binary weights matrix be generated. To this aim, all nonzero spatial weights are set to 1.spatwmat, name(W) xcoord(longitude) ycoord(latitude) band(0 8)*安装绘制Moran’s I工具:splagvar*splagvar --- Generates spatially lagged variables, constructs the Moran scatter plot,*and calculates global Moran's I statistics.*_2016GDP:使用变量_2016GDP*wname(W):使用空间权重矩阵W*indicate the name of the spatial weights matrix to be used*wfrom(Stata):indicate source of the spatial weights matrix*wfrom(Stata | Mata) indicates whether the spatial weights matrix is a Stata matrix loaded in memory or a Mata file located in the working directory.*If the spatial weights matrix had been created using spwmatrix it should exist as a Stata matrix or as a Mata file.*moran(_2016GDP):计算变量_2016GDP的Moran's I值*plot(_2016GDP):构建变量_2016GDPMoran散点图splagvar _2016GDP, wname(W) wfrom(Stata) moran(_2016GDP) plot(_2016GDP)=============================================================================== **使用距离矩阵计算空间计量模型*设置默认路径cd D:\软件学习软件资料\stata\stata指导书籍命令\陈强高级计量经济学及stata应用(第二版)全部数据*使用product.dta数据集(陈强的高级计量经济学及其stata应用P594)*将数据集product.dta存入当前工作路径use product.dta , clear*创建新变量,对原有部分变量取对数gen lngsp=log(gsp)gen lnpcap=log(pcap)gen lnpc=log(pc)gen lnemp=log(emp)*将空间权重矩阵usaww.spat存入当前工作路径spmat use usaww using usaww.spmat*使用聚类稳健的标准误估计随机效应的SDM模型xsmle lngsp lnpcap lnpc lnemp unemp,wmat(usaww) model(sdm)robust nolog*使用选择项durbin(lnemp),不选择不显著的变量,使用聚类稳健的标准误估计随机效应的SDM模型xsmle lngsp lnpcap lnpc lnemp unemp,wmat(usaww) model(sdm) durbin(lnemp) robust nolog noeffects*使用选择项durbin(lnemp),不选择不显著的变量,使用聚类稳健的标准误估计固定效应的SDM模型xsmle lngsp lnpcap lnpc lnemp unemp,wmat(usaww) model(sdm) durbin(lnemp) robust nolog noeffects fe*存储随机效应和固定效应结果qui xsmle lngsp lnpcap lnpc lnemp unemp,wmat(usaww) model(sdm) durbin(lnemp) r2 nolog noeffects reest sto requi xsmle lngsp lnpcap lnpc lnemp unemp,wmat(usaww) model(sdm) durbin(lnemp) r2 nolog noeffects feest sto fe*esttab:将保存的结果汇总到一张表格中*b(fmt):specify format for point estimates*beta[(fmt)]:display beta coefficients instead of point est's*se[(fmt)]:display standard errors instead of t statistics*star( * 0.1 ** 0.05 *** 0.01):标记不同显著性水平对应的P值*r2|ar2|pr2[(fmt)]:display (adjusted, pseudo) R-squared*p[(fmt)]:display p-values instead of t statistics*label:make use of variable labels*title(string):specify a title for the tableesttab fe re , b se r2 star( * 0.1 ** 0.05 *** 0.01)*hausman检验*进行hausman检验前,回归中没有使用稳健标准误(没用“r”),*是因为传统的豪斯曼检验建立在同方差的前提下*constant:include estimated intercepts in comparison; default is to exclude*df(#):use # degrees of freedom*sigmamore:base both (co)variance matrices on disturbance variance estimate from efficient estimator*sigmaless:base both (co)variance matrices on disturbance variance estimate from consistent estimatorhausman fe re**有时我们还会得到负的chi2值,即chi2<0,表明模型不能满足Hausman检验的渐近假设。
- 1、下载文档前请自行甄别文档内容的完整性,平台不提供额外的编辑、内容补充、找答案等附加服务。
- 2、"仅部分预览"的文档,不可在线预览部分如存在完整性等问题,可反馈申请退款(可完整预览的文档不适用该条件!)。
- 3、如文档侵犯您的权益,请联系客服反馈,我们会尽快为您处理(人工客服工作时间:9:00-18:30)。
** 创建空间权重矩阵介绍*设置默认路径cd C:\Users\xiubo\Desktop\F182013.v4\F101994\sheng**创建新文件*shp2dta:reads a shape (.shp) and dbase (.dbf) file from disk and converts them into Stata datasets.*shp2dta:读取CHN_adm1文件*CHN_adm1:为已有的地图文件*database (chinaprovince):表示创建一个名称为“chinaprovince”的dBase数据集*database(filename):Specifies filename of new dBase dataset*coordinates(coord):创建一个名称为“coord”的坐标系数据集*coordinates(filename):Specifies filename of new coordinates dataset*gencentroids(stub):Creates centroid variables*genid(newvarname):Creates unique id variable for database.dtashp2dta using CHN_adm1,database (chinaprovince) coordinates(coord) genid(id) gencentroids(c)**绘制2016年中國GDP分布圖*spmap:Visualization of spatial data*clnumber(#):number of classes*id(idvar):base map polygon identifier(识别符,声明变量名,一般以字母或下划线开头,包含数字、字母、下划线)*_2016GDP:变量*coord:之前创建的坐标系数据集spmap _2016GDP using coord, id(id) clnumber(5)*更改变量名rename x_c longituderename y_c latitude**生成距离矩阵*spmat:用于定义与管理空间权重矩阵*Spatial-weighting matrices are stored in spatial-weighting matrix objects (spmat objects).*spmat objects contain additional information about the data used in constructing spatial-weighting matrices.*spmat objects are used in fitting spatial models; see spreg (if installed) and spivreg (if installed).*idistance:(产生距离矩阵)create an spmat object containing an inverse-distance matrix W*或contiguity:create an spmat object containing a contiguity matrix W*idistance_jingdu:命名名称为“idistance_jingdu”的距離矩陣*longitude:使用经度*latitude:使用纬度*id(id):使用id*dfunction(function[, miles]):(设置计算距离方法)specify the distance function.*function may be one of euclidean (default), dhaversine, rhaversine, or the Minkowski distance of order p, where p is an integer greater than or equal to 1.*normalize(row):(行标准化)specifies one of the three available normalization techniques: row, minmax, and spectral.*In a row-normalized matrix, each element in row i is divided by the sum of row i's elements.*In a minmax-normalized matrix, each element is divided by the minimum of the largest row sum and column sum of the matrix.*In a spectral-normalized matrix, each element is divided by the modulus of the largest eigenvalue of the matrix.spmat idistance idistance_jingdu longitude latitude, id(id) dfunction(euclidean) normalize(row)**保存stata可读文件idistance_jingdu.spmatspmat save idistance_jingdu using idistance_jingdu.spmat**将刚刚保存的idistance_jingdu.spmat文件转化为txt文件spmat export idistance_jingdu using idistance_jingdu.txt**生成相邻矩阵spmat contiguity contiguity_jingdu using coord, id(id) normalize(row)spmat save contiguity_jingdu using contiguity_jingdu.spmatspmat export contiguity_jingdu using contiguity_jingdu.txt**计算Moran’s I*安装spatwmat*spatwmat:用于定义空间权重矩阵*spatwmat:imports or generates the spatial weights matrices required by spatgsa, spatlsa, spatdiag, and spatreg.*As an option, spatwmat also generates the eigenvalues matrix required by spatreg.*name(W):读取空间权重矩阵W*name(W):使用生成的空间权重矩阵W*xcoord:x坐标*ycoord:y坐标*band(0 8):宽窗介绍*band(numlist) is required if option using filename is not specified.*It specifies the lower and upper bounds of the distance band within which location pairs must be considered "neighbors" (i.e., spatially contiguous)*and, therefore, assigned a nonzero spatial weight.*binary:requests that a binary weights matrix be generated. To this aim, all nonzero spatial weights are set to 1.spatwmat, name(W) xcoord(longitude) ycoord(latitude) band(0 8)*安装绘制Moran’s I工具:splagvar*splagvar --- Generates spatially lagged variables, constructs the Moran scatter plot,*and calculates global Moran's I statistics.*_2016GDP:使用变量_2016GDP*wname(W):使用空间权重矩阵W*indicate the name of the spatial weights matrix to be used*wfrom(Stata):indicate source of the spatial weights matrix*wfrom(Stata | Mata) indicates whether the spatial weights matrix is a Stata matrix loaded in memory or a Mata file located in the working directory.*If the spatial weights matrix had been created using spwmatrix it should exist as a Stata matrix or as a Mata file.*moran(_2016GDP):计算变量_2016GDP的Moran's I值*plot(_2016GDP):构建变量_2016GDPMoran散点图splagvar _2016GDP, wname(W) wfrom(Stata) moran(_2016GDP) plot(_2016GDP)=============================================================================== **使用距离矩阵计算空间计量模型*设置默认路径cd D:\软件学习软件资料\stata\stata指导书籍命令\陈强高级计量经济学及stata应用(第二版)全部数据*使用product.dta数据集(陈强的高级计量经济学及其stata应用P594)*将数据集product.dta存入当前工作路径use product.dta , clear*创建新变量,对原有部分变量取对数gen lngsp=log(gsp)gen lnpcap=log(pcap)gen lnpc=log(pc)gen lnemp=log(emp)*将空间权重矩阵usaww.spat存入当前工作路径spmat use usaww using usaww.spmat*使用聚类稳健的标准误估计随机效应的SDM模型xsmle lngsp lnpcap lnpc lnemp unemp,wmat(usaww) model(sdm)robust nolog*使用选择项durbin(lnemp),不选择不显著的变量,使用聚类稳健的标准误估计随机效应的SDM模型xsmle lngsp lnpcap lnpc lnemp unemp,wmat(usaww) model(sdm) durbin(lnemp) robust nolog noeffects*使用选择项durbin(lnemp),不选择不显著的变量,使用聚类稳健的标准误估计固定效应的SDM模型xsmle lngsp lnpcap lnpc lnemp unemp,wmat(usaww) model(sdm) durbin(lnemp) robust nolog noeffects fe*存储随机效应和固定效应结果qui xsmle lngsp lnpcap lnpc lnemp unemp,wmat(usaww) model(sdm) durbin(lnemp) r2 nolog noeffects reest sto requi xsmle lngsp lnpcap lnpc lnemp unemp,wmat(usaww) model(sdm) durbin(lnemp) r2 nolog noeffects feest sto fe*esttab:将保存的结果汇总到一张表格中*b(fmt):specify format for point estimates*beta[(fmt)]:display beta coefficients instead of point est's*se[(fmt)]:display standard errors instead of t statistics*star( * 0.1 ** 0.05 *** 0.01):标记不同显著性水平对应的P值*r2|ar2|pr2[(fmt)]:display (adjusted, pseudo) R-squared*p[(fmt)]:display p-values instead of t statistics*label:make use of variable labels*title(string):specify a title for the tableesttab fe re , b se r2 star( * 0.1 ** 0.05 *** 0.01)*hausman检验*进行hausman检验前,回归中没有使用稳健标准误(没用“r”),*是因为传统的豪斯曼检验建立在同方差的前提下*constant:include estimated intercepts in comparison; default is to exclude*df(#):use # degrees of freedom*sigmamore:base both (co)variance matrices on disturbance variance estimate from efficient estimator*sigmaless:base both (co)variance matrices on disturbance variance estimate from consistent estimatorhausman fe re**有时我们还会得到负的chi2值,即chi2<0,表明模型不能满足Hausman检验的渐近假设。