高考图表作文写作方法
高考英语图表图画式作文
图表/图画式作文【特点】:将图表形式的信息转换成文字信息。
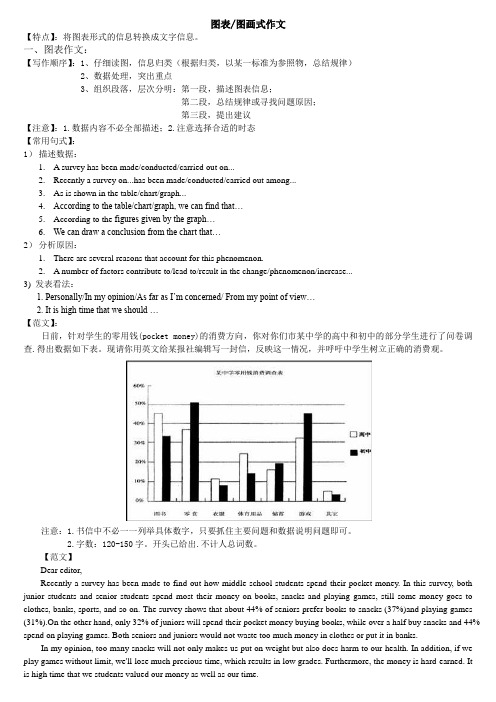
一、图表作文:【写作顺序】:1、仔细读图,信息归类(根据归类,以某一标准为参照物,总结规律)2、数据处理,突出重点3、组织段落,层次分明:第一段,描述图表信息;第二段,总结规律或寻找问题原因;第三段,提出建议【注意】:1.数据内容不必全部描述;2.注意选择合适的时态【常用句式】:1)描述数据:1. A survey has been made/conducted/carried out on...2.Recently a survey on...has been made/conducted/carried out among...3.As is shown in the table/chart/graph...4.According to the table/chart/graph, we can find that…5.According to the figures given by the graph…6.We can draw a conclusion from the chart that…2)分析原因:1.There are several reasons that account for this phenomenon.2. A number of factors contribute to/lead to/result in the change/phenomenon/increase...3) 发表看法:1. Personally/In my opinion/As far as I’m concerned/From my point of view…2. It is high time that we should …【范文】:日前,针对学生的零用钱(pocket money)的消费方向,你对你们市某中学的高中和初中的部分学生进行了问卷调查.得出数据如下表。
高考备考写作专题:图表分析作文

高考备考写作专题:图表分析作文第一篇:全球二氧化碳排放量变化趋势随着工业化和现代化的发展,全球二氧化碳排放量不断增加,给地球的生态环境带来了巨大挑战。
下面是一幅描述全球二氧化碳排放量变化趋势的图表。
从图表中可以看出,自20世纪50年代开始,全球二氧化碳排放量呈现出逐年增加的趋势。
在20世纪70年代到80年代之间,排放量增速开始明显加快,到了90年代更是达到了高峰。
然而,在近几年,尽管二氧化碳排放量仍然在增加,但增速明显放缓。
造成全球二氧化碳排放量增加的原因有很多,但主要是工业生产、能源消耗和交通运输等活动所引起的。
这些活动大量使用化石燃料,例如煤炭、石油和天然气,导致了大量的二氧化碳释放到大气中。
全球二氧化碳排放量的增加给地球的生态环境带来了诸多问题。
首先,大量的二氧化碳排放导致大气中温室气体浓度升高,进而造成气候变化,例如全球气温上升、极端天气事件增多等。
其次,二氧化碳还会导致海洋酸化,对海洋生物造成威胁。
此外,由于空气污染加剧,人们的健康也受到了威胁。
为了应对全球二氧化碳排放量增加的问题,各国政府和国际组织已经采取了一系列的措施,例如限制工业排放、推广清洁能源和绿色交通等。
但要真正解决二氧化碳排放问题,还需要全球各方共同努力,包括改变生活方式、提高环保意识等。
第二篇:中国城市人口增长随着城市化进程的不断推进,中国城市人口呈现出快速增长的趋势。
下面是一幅描述中国城市人口增长的图表。
从图表中可以看出,1990年以前,中国城市人口增长较为缓慢,但之后迅速加快。
尤其是在2000年以后,城市人口增长速度急剧提升。
目前,中国的城市化率已经超过了50%。
城市人口增长的原因有很多,主要是农村人口向城市转移和城市自然增长导致的。
一方面,农村居民为了追求更好的生活条件和就业机会,纷纷涌向城市。
另一方面,由于医疗水平的提高和生活条件的改善,城市人口的自然增长也较快。
城市人口增长给中国带来了很多挑战。
首先,城市人口的快速增加导致了城市基础设施和公共服务压力的加大。
高考英语图表作文
怎样写图表分析作文纵观近几年高考,英语书面表达大致分为材料作文、图表作文和开放作文。
且材料作文逐渐被图表作文取代,图表分析作文就是将数据、图像所包含的信息,转化为表意的说明文字。
图表分析作文通常比较复杂,学生不仅要弄清提示,还要看懂所给的图表和数据。
由于这类试题提示内容少,信息点分散,审题时一定要领会作者的出题意图,弄清主题再动笔:1.单纯描述解释图表信息,按图表所示内容如实表达,不加评论。
2.通过叙述图表(或图画)中的内容和数字变化来分析原因,发表议论。
高考英语图表作文(一) 柱状图(BAR CHART)人们日常生活中事物的变化情况通常可以用宽度相等的柱状图形来表示,柱状图的高度差别用来说明事物的动态发展趋势,同时要注意图例说明和坐标刻度所提示的信息。
例:你们班会的讨论主题是“上大学是高中生唯一的出路吗?”请你根据下面图表及汉语提示,写一篇短文,并阐述你的个人观点。
提示:1.增长学识,提高素养,利于择业。
2.成功的路不只一条。
3.学费高,就业难。
要求:1.词数:100~120左右。
2.开头语已为你写好(不计入词数)。
3.参考词汇:tuition n.学费qualities n.素养【高考英语图表作文解题分析】柱状图是高中英语课本中常见的图形,要求学生通过柱状图图中数据和提示内容写一短文,属于比较、对照类。
也可根据提示写为议论文。
通常我们采取三段式写法:第一段:描述图表,得出结论。
第二段:紧扣主题,根据图表比较分析原因,论证结论。
第三段:发表议论,提出自己的看法。
【高考英语图表作文提炼要点】分析柱状图数据信息。
从图中可看出,黑色代表想上大学,占大多数,约60%;浅黑色代表无所谓,占约30%;白色代表不想上大学,占约10%。
One possible versionIs It The Only Way Out To Go To College?We had a discussion about whether it is the only way out for senior students to go to college.Views vary from person to person.The majority of us consider it very necessary to go to college.They think it can widen their knowledge and improve their qualities.Only in this way can they find better jobs aftergraduation.Very few students,that is about ten percent of the students,think it no use going university,because the tuition is too high for their family to afford.What's more,it's rather hard for college graduates to seek satisfactory jobs.Thirty percent of the students,however,believe “All roads lead to Rome.”Therefore it doesn't make any difference whether they go to college or not.In my opinion,we can receive a better education at college so that we can serve our motherland.【高考英语图表作文语言亮点】①词汇。
高考英语精考点 作文指导之图表说明文

毛额市鹌鹑阳光实验学校高考英语作文指导之图表说明文一、图表说明文的常见类型1.以表格形式,将统计的数据或被说明的事物直接用表格形式体现出来2.表示数据的大小或数量之间的差异的柱状图3.表示数据变化的曲线图4.表示总体内部结构变化的扇形图二、图表作文的一般结构:建议用三段式作文三、图表类说明文的写作结构:第一段:开门见山地点明本图表所反映的主题, 即conclusion.第二段:分析数据间的主要差异及趋势,然后描写(在描写数据间变化及总趋势特征时,可采用分类式或对比式以支持主题,并阐明必要的理由)。
注意层次。
第三段:归纳总结或发表评论四、写作步骤:1.审题(四确定)1)确定类型2)确定体裁3)确定主体时态4)确定主体人称2.列要点3.依要点, 拟草纲, 组织成句.4.构篇章,扩句成文.5.检查润色6.书写五、图标说明文常用词句。
1.常用词汇:table(表格, 项目表), chart(图表), graph(图表, 曲线图),figure(数据),rate (比列,比率),make a survey about…(做关于…的调查) , describe, tell, show, represent, Obviously/Apparently (很明显地),rise,increase(增多,增加),climb,go up, fall,decline(下降),decrease(减少,减低),drop,go down, ….2.常用句型:1).The rate of … is2).There was a great /slight increase /rise in…3).The main reason is that ….4).The rate dropped slightly from 38%in… to 31% in…5). By comparison with…, it decreased/increased/fell from…to…6). From Chart 1, / According to Chart 2, /As is shown on Chart 1,7)Besides/ What’s more/What’s worse.8)In a word/In short/ Generally speaking /In summary/ As faras I am concerned.3.单句训练:1.由表1,我们可以看出……2.最近的一项关于人们怎样度假的调查表明。
高考英语图表作文模板和范例
图表式作文It is obvious in the graphic/table that the rate/number/amount of Y has undergone dramatic changes. It has gone up/grown/fallen/dropped considerably in recent years (as X varies). At the point of X1, Y reaches its peak value of ...(多少).What is the reason for this change? Mainly there are ... (多少) reasons behind the situation reflected in the graphic/table. First of all, ...(第一个原因). More importantly, ...(第二个原因). Most important of all, ...(第三个原因).第一段:The table/graph/chart shows, as far as ______(is/are)concerned, _______________________.第二段:(第二段分为三种情况:1、一直上升;2、一直下降;3、一部分上升,一部分下降。
下面针对这三种情况进行结构模仿)。
1、(以1978年到1998年城镇乡村收入的稳步较长图为例)。
a.一直上升According to the figures show in the graph, we can see that________, had been increasing at a steady rate from the year of 1978 to 1998. In addition, during the period, ____________had raise from 349.9 Yuan to 5425 Yuan, morethan 5 times .Meanwhile, _______had also grown from 133.6 Yuan to 2100 Yuan.b. 一直下降According to the figures show in the graph, we can see that___________, had been decreasing at e steady rate from the year of 1978 to 1998. In addition, during the periond,____________had reduced from 349.9 Yuan to 5425 Yuan, more than 5 times .Meanwhile ,_______had also gone down 133.6 Yuan to 2100 Yuan.2、[以从1995年到1999年西安人的日常生活支出(食物、服装和娱乐)的变化为例]c. 一部分上升,一部分下降:According to the figures in the graph, we can see that__________had been increasing by 9% and 7%, respectively from the year of 1995 to1999. However,___________(the expenses on food)had been decline by30% ,during the same period. The statistics of rise and fall seem to exist in isolation but closely to one another. 第三段:There are several reasons for that phenomenon. On the hand, _____;On the other hand,_________,___________.注:横线部分为自己需填充的内容,这只是整篇文章的格式,红色横线部分视考题而定,可填充的内容经济类/发展类/旅游类/文化交流类:1. The policy of reformation and opening spreader widely in China should be taken into account firstly, when considering the reason for the steady increase of the citizen's income.2. The people of China has the spirit of working hard in order to improve their living.3. China's rapid economic development lays the base.4. In the past twenty five years, remarkable changes have taken place in China's tourism rank in the world.5. The economy of China has developed so fast in twenty years that China now becomes more and more important in the world.6. I'm confident that with the development of China the numbers of visitors and the foreign exchange earrings will certainly continues to increase in the future.7. With the rapid development of technology and the global economy ,the world is becoming international, cultural exchanges are becoming more and more frequent ,which is inevitably improving our mutual understanding and friendship with other countries.食品类:1、In order to live a healthy long life, we have to restrict our calorie intake eating the food with less fat.2、We should make our diet more nutritional and balance the calorie intake to enjoy a healthy life.3、To improve the bad situation, people should eat calcium-enriched food, such as fish,milk,beancurd and so on . 娱乐类/体育类:如看书/看电视1、We should make a balance between them to benefit themselves.2、The age in which we live now is an information one.3、People should go to the gym and take part in some sports, such as basketball, volleyball, swimming and so .All the exercise help people keep healthy.友谊类/文化交流类:1、People all over the world love and respect each other. The best way to show our love is to help others when they are in difficulties.2、Everyone should be encouraged required to try to be self-reliant.3、When one in trouble, others should help him.PS:经典句子:1、Scientists have warned that unless effective measures are taken, the problem of pollution will eventually get out of hand.2、For citizens ,they are supposed to conform to rules and regulations of the traffic.3、And the government should educate people in this respect ,which will draw people's attention of the serious problem.4、For drivers their speed should be restricted . Otherwise, they should be punished severely.5、It is time the anchorites concerned took proper steps the traffic problem.6、As long as each of us takes actions. I deeply believe the problem will be well resolved to an extend作文中可用的谚语或句子:As a saying goes:俗话说1、A good beginning is half done. 良好的开端是成功的一半。
高考图表作文指导writing_a_report

正如我们可见,70%的地球表面被水覆盖。
70% of the surface of the earth As _____we can see____________________________is covered by water.
Para1 Introduce and describe the chart
表格 (table)
图表作文结构
二、写作步骤(三段论) 1.开门见山,点明图表要反映的主题。
2.中间段落对图表的内容进行分析,可采用分 类或对比来表现主题,并阐明必要的理由。
3.发表自己的观点,对全文进行小结。
Para1 Introduce and describe the chart 直接点明本图表所反映主题. 根据图表,我们可知……:
Para1 Introduce and describe the chart
The structure describing the changes 1. The number of …grows/ rises from … to… 2. There was a very steady (sharp/ rapid/ sudden )drop ( decrease/ decline/ fall) in 2015 compared with that of last year.
Para2 Analyze the reasons
1. There are several reasons for_____________. 2. There are several factors leading to this difference… 3. To begin with ,… In addition,… To sum up,…
高考图表作文专项讲解及练习(有答案)

图表作文本节内容一)图表作文写作要求图表作文就是把非文字信息(通常为各种图表表示的数字信息等)转换成文字信息的一种作文。
它要求我们用文字来描述非文字性的图表或对图表显示的关系作解释说明。
图表作文一般在题目中给出作文的标题和一个或几个统计表格、圆图形、曲线图或条形图,有时还用英文或中文提纲的形式给出提示,具体要求:1. 用文字描述图表,客观解释图表中所传递的信息,并找出某种规律或趋势;2. 就图表中所反映的某种趋势或问题分析其原因或后果。
图表作文着重说明事实,常常通过对图表中所反映的具体数据的说明、分析、比较,对某种事物或现象的事实或变化情况等加以说明,并提出结论或看法。
因此,图表作文常常采用议论文的写作方法。
二)写作步骤1.仔细阅读图表,了解图表所达的内容。
首先,用一句话概括图标的内容。
2.描写图表所反映的问题或规律3.结尾部分得出结论,表述自己的观点,结束全文。
(1)如果图表反映的是好的现象,首先要肯定、发表观点最后预测未来;(2)如果图表反映的是不好的现象,首先要否定、提出解决办法或建议三)写作实用表达(一)点明主题引用具体或粗略的数据,然后作出概括性分析,点名主题或引出需要论述的问题。
常用的词有:1.泛指一份数据图表:a data graph/chart/diagram/illustration/table饼图:pie chart 表格图:table 柱形图:bar chart趋势曲线图:line chart / curve diagram2.describe, show, represent, illustrate, reveal等等。
3. figure, statistic, number, percentage, proportion常用的开篇句型(即概述图表内容时常用的表达法)1.The graph/chart/table above shows / describes / illustrates that.....2. From the above graph/chart, it can be seen that…3. As is shown in the graph…4.The chart/table shows the differences between…5. According to the table/pie chart/ graph/bar graph, we can see/conclude that …(二)分析差异描写变化及总趋势特征、分析差异:数据说明常用套语:1.There was a great /slight increase /rise in…2.The number /rate has nearly doubled, compared with that of last year.3.The number is …times as much as that of….原因说明常用套语:1.The reason for…is that…2.The change results from the fact that…3.There are several causes for this significant growth in…. To begin with .... In addition/ Furthermore/ Moreover,...4. There are many factors that may account for...but the following are...(三)得出结论结尾常用套语1. Personally/ as far as I’m concerned/ in short/ in brief/ in conclusion /in summary2. It’s clear/evident from the chart that… / We can draw the conclusion that…3. From what has been discussed above/Taking into account all these factors, we can draw the conclusion that…4. There is no doubt that special attention must be paid to the problem of...5. It is high time that we put an end to the tendency of...图表作文常用单词、词组和句型总结:1)表示数据变化的单词或词组rapid/ rapidly 迅速的,飞快的,dramatic/ dramatically 急剧的sharp /sharply 明显的,急剧的significant/ significantly 重大的sradual/ gradually 渐进的,逐渐的steady / steadily 稳固的stable / stably 稳定的slow /slowly 缓慢的slight / slightly 略微的2)在描述中常用到的词汇significant changes 图中一些较大变化noticeable trend 明显趋势distribute 分配in terms of/ regarding/ with regard to/ as far as sth is concerned 关于,就...而言3) 描述增减变化常用的句型Compared with … is still increased by …The number of … grew/rose from … to …An increase is shown in …; then came a sharp increase of …In … the number remains the same/drops to …There was a very slight (small/slow/gradual) rise/increase in ......There was a very steady (marked/sharp/rapid/sudden/dramatic) drop (decrease/decline/fall/reduction) in ....../ compared with that of last year).4) 图表作文常用句型精选1. The table shows the changes in the number of.....over the period from....to......该表格描述了在...年至...年间...数量的变化。
高考英语图表作文详解+万能必背模板

(万能模板+模板句型+详细指导+举例范文+满分范文)
目录
一.万能模板 .............................................................................................................................................. 2 二.模板表述方法 .............................................................................................................................能模板
As is shown/ indicated/illustrated by the figure/percentage in the table (graph/picture/pie/chart), __作文题目的议题__has been on rise/ decrease (goes up/increases/drops/decreases), significantly/ dramatically /steadily rising/decreasing from__ in __ to __ in __. From the sharp/marked decline/ rise in the chart, it goes without saying that (毫无疑 问的看出) _________________________. There are at least two good reasons accounting for (这里至少有两个原因可以对 X X 作出解释) ______________________. On the one hand(一方面), ______. On the other hand(另一方面), ______ is due to the fact that ________(原因是). In addition(而且), _______ is responsible for _______. Maybe there are some other reasons to show (也许有其他原因要展示)_______. But it is generally believed that the above mentioned reasons are commonly convincing. As far as I am concerned, I hold the point of view that _______. I am sure my opinion is both sound and well-grounded.
高考英语图画型作文写作技巧及范文
高考英语图画型作文写作技巧及范文导语:图画型作文更能考察学生的分析问题的才能,因此深受命题者的青睐。
考生应注意认真审题,一旦审题有所偏颇,不容易得到高分。
此类作文首先要描绘图画,然后对图画进展适当的阐释(解释、说明和分析),介绍图画背后所反映的问题,最后联络实际发表自己的观点,给出自己的建议、原因等等,一般写三段。
以下是为大家精心的英语图画型作文写作技巧及范文,欢迎大家参考!1、As can be seen from the chart, …;From thechart/picture /table we can see(The chart shows) that ..;As is vividly shown in the picture( 假设两个的话用pictures,也可以用drawing,同样的假设两个的话用drawings,假设是图表那么用table ,两个图表那么用 table s) above, 图画的内容。
The picture( 假设两个的话用pictures,也可以用drawing,同样的假设两个的话用drawings,假设是图表那么用table ,两个图表那么用 table s) tells ( 注意,假设是前面的图画是复数,那么用tell) us that 这个图片的大致反映的意思。
2、 Recent years people in 地名(比方中国、北京、美国等等) have witnessed the fact that 描绘图片里的现象,And it is very mon/usual to see that in recent years.1、The implied meaning of the picture(注意,同上进展单复数的处理) should be taken into aount seriously. First/To begin with, 提醒涵义/原因/结果1,Second/What’s more, 提醒涵义/原因/结果2。
高考作文专题之图表类作文

参考范文:
The primary school students have different opinions on
what kind of person can become a monitor. We can see from the pie chart that about 4.41% of the
2005
2006
2007
第三步 串句成文,保证流畅 Nowadays, with the growing popularity of
computers, more and more people are paying less and less attention to their handwriting.
3.结尾部分:考生可以总结全文,加深读者的印象; 也可以发出号召,唤起读者的共鸣;还可以表示作者的信 念,增强文章的感染力;有时,也可以提出问题,启发读 者思考。
无论怎样,考生都应该注意既要做到与开头呼应又要 概括全文,使读者有一个统一完整的概念。
写图表作文时,考生还应注意以下几个方面: 1.图表往往提供大量数据,应仔细观察分析,从中选
______________(图表主题). The first thing we notice is that ______________(图表最大特点). This means that as ________, ________(进一步说明).
We can see from the statistics given that ________(图表 细节一). After ________(细节一中的第一变化), the _____(紧跟着的变化). The figures also tell us that _____(图 表细节二). ________(数据位置,如In the second column), we can see that ________ accounts for ________(进一步描 述).
图表类书面表达技巧讲解

图表类书面表达技巧讲解题型介绍近几年高考说明文多数以图表、表格或文字的形式给出提示,并往往融合在应用文体中进行考查,一样分为:场所路线介绍、事物介绍、方式方法或打算安排介绍三大类。
在写作时要求语言简明扼要、通俗易明白,说明过程讲究层次性和条理性。
图表式作文的几种形式:一是以表格形式,将统计的数据或被说明的事物直截了当用表格形式表达出来,即统计表。
二是以图形形式:表示数据变化的曲线图;表示数据的大小或数量之间的差异的条形图;表示总体内部结构变化的扇形图。
图表作文的结构通常是三段式:第一段分析图表中的数据变化反映出的问题或趋势,简要概述图表所揭示的信息;第二段分析缘故;第三段提出解决问题的方法或建议。
写作时注意直截了当、尽快入题,适当加入自己的议论,力争做到观点明确,不要拐弯抹角,拖泥带水,使人读后一头雾水。
解题技巧审题:【链接高清】1. 对数据进行比较,找出变化规律。
2. 留心所给图形坐标轴上的数字和单位。
3. 注意饼状图各部分间的关系,部分与整体的关系。
4. 写作时先描画图表内容,写明变化规律,依照题目要求分析和推测走势(假如必要的话),并简要说明缘故。
三步走:第一步:开门见山地点明本图表所反映的主题。
第二步:分析数据间的要紧差异及趋势,然后描写。
第三步:归纳总结或发表评论。
图表用词:曲线图graph表格table几何图形figure饼状图pie chart条状图bar chart平面图、示意图、外形图diagram时态:现在时或过去时◆常用句型:图表作文中的过渡、概括句型1. As can be indicated in the table …2. As is revealed in the table...3. According to the figures given in the table...4. This chart shows that...5. As is shown by the graph...6. It can be seen from the statistics that...描写图表和数据的句型1. A is by far the largest...2. The figure has nearly doubled/tripled, as against that of last year.3. There is a slight/slow/steady/rapid rise in population.4. Sth. be on the increase/decrease/rise/decline常用过渡词过渡到下一点:what’s more, in addition, besides, furthermore表示比较:on the contrary, compare …to/with…, compared to/with 得出结论:consequently, as a result, in other words, in short, accordi ng表示强调:without doubt, chiefly, as a matter of fact, in fact表示不同:different from, difference between/among数据表达法百分比的表达:70% of... /seventy percent of... /70 percent of the... (易漏用of)其它一些比例的表达手段。
高考英语书面表达:如何写好图表作文?

图表作文多以说明文和议论文为主;考查时要求同学们根据所给的图表、数据等进行分析、研究、阅读其中的文字和说明,弄清各种信息之间的关系,提炼要点,然后组织语言进行写作,得出令人信服的结论,必要时还要加入自己的观点。
时态方面除特定的时间用过去时外,常用一般现在时。
表格(table)、曲线图(line graph)、柱形图(bar chart)与饼形图(pie chart)。
图表作文通常是三段式。
1.第一段分析图表中的数据变化反映出的问题或趋势,简要叙述图表所揭示的信息。
常用词汇:table, chart, figure, graph, describe, tell, show, represent等。
2.第二段分析原因。
在描写数据间变化及总趋势特征时,可采用分类式或对比式以支持主题,并阐明必要的理由,且要注意层次清楚。
常用词汇:rise, drop, reduce, fall , rise, increase, decrease, on the contrary, as…as…, compared to/with, the same as, be similar to, be different from, in contrast to3.第三段提出解决问题的办法或建议。
常用词汇:in a word, in short, generally speaking, it is clear from the chart that, we candraw the conclusion that等。
另外,还应注意以下几个问题:◆文章应包括图表所示内容,但不必全部写到;◆叙述调查结果时要避免重复使用百分比;◆最重要的是要有表明自己观点的句子。
1、How to begin your passage 直接点明本图表所反映主题.(1) According to the table / chart/ graph, we can see/conclude that …(2) The table/ graph/ data shows/ indicates/ points out that …(3)As we can see from the table, …As can be seen from the graph, …As is shown in the chart, ….2. How to interpret the related information 分析数据间的主要差异及描述趋势increase/ rise / climb / go up / jump/ rocket/ doubledecrease/ go down/ drop/ fall/ decline/ reduceremain stable/ go on steadily/ stay the samesteady/steadily; slow/slowly; slight/slightly;gradual/gradually;rapid/rapidly; sudden/suddenly;significant/significantly;dramatic/dramatically;sharp/sharply80%: eighty percent1/2: half of the…3/4 : three fourths of the…是…的两倍: double that of…/ is twice that of…剩余的: the rest(谓语形式依据所指代的名词单复而定)①3/4的学生喜欢体育运动。
高考图表作文实用模板
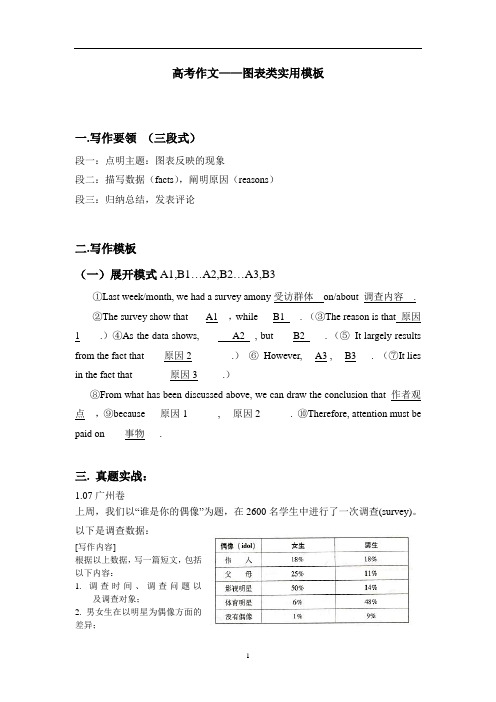
高考作文——图表类实用模板一.写作要领(三段式)段一:点明主题:图表反映的现象段二:描写数据(facts),阐明原因(reasons)段三:归纳总结,发表评论二.写作模板(一)展开模式A1,B1…A2,B2…A3,B3①Last week/month, we had a survey amony受访群体on/about 调查内容.②The survey show that ___A1__,while___B1___.(③The reason is that 原因1____.)④As the data shows, ______A2__, but____B2____.(⑤It largely results from the fact that____原因2________.)⑥However, __A3 , __B3___.(⑦It lies in the fact that____ ___原因3_____.)⑧From what has been discussed above, we can draw the conclusion that_作者观点__,⑨because___原因1______, __原因2______.⑩Therefore, attention must be paid on____事物___.三. 真题实战:1.07广州卷上周,我们以“谁是你的偶像”为题,在2600名学生中进行了一次调查(survey)。
以下是调查数据:[写作内容]根据以上数据,写一篇短文,包括以下内容:1. 调查时间、调查问题以及调查对象;2. 男女生在以明星为偶像方面的差异;3. “父母”在男女生偶像中的排序差异;4. 男女生在以伟人为偶像方面的异同;5. 你的偶像及理由。
[写作要求]1.只能使用5个句子表达全部内容;2.文中不能出现真实姓名和学校名称。
[评分标准]句子结构准确,信息内容完整,篇章结构连贯。
2024届全国新高考英语精准复习图表类作文

纵向对比: 从1990到2020年,经过有效的措施,世界总贫困人口 和中国贫困人口一直在下降。 From 1990 to 2020, through effective
measures, the total number of poor people
both in the world and in China has been
Excitedly, China sucessfully got rid of absolute poverty in 2020.
As far as I am concerned, China has set a good example for the world.The Chinese people are living a better and better life. I am proud of China. Hopefully, the total number of poor people in the world will come to an end in the future.
countries pay high attention to the issue of
poverty,
especially
China.
China has been taking effective measures
to solve the problem of poverty. According to
declining.
范文一:Chinas Achievement in Ending Absolute Poverty
As we all know, poverty is one of the
biggest i s s u e s a r o u n d t h e w o r l d fective measures adopted by the government, all of the poor people across China have been lifted out of absolute poverty by the end of 2020. China has made such amazing achievements that gives the world a hope that ending poverty is possible.
写作指导(4) 图表作文

图表作文是近年来高考常考的题型之一。图表作文的体裁多为议 论文、应用文和说明文,内容多涉及前后变化对比、正反观点对比或 产品介绍等。要求考生通过数据、文字内容分析,系统准确地表达出 图表含义,并得出令人信服的结论。
一、图表作文的命题形式 1.表格式 将统计的数据或被说明的对象直接用表格形式体现出来,即统 计表。这类题型一般以说明文和议论文居多,往往是介绍、说明某 种情况或辩论某种观点、看法,但有时也可能是记叙文。 2.图像式 可分为以曲线形式表示数据变化的线形图、以条形形式表示数 据大小或数量之间差异的条形图,以圆内扇形面积的大小表示总体 中部分结构变化的圆形图等。这类题型一般以说明文居多,是一些 关于生产、销售、发展进程等各种项目统计的示意图。
假设你是李华,正在英国牛津参加短期的语言培训,计划星期 天去伦敦旅游。互联网上的一则广告引起了你的注意,但一些具体 信息不明确(箭头所指内容)。请给该旅行社发一封电子邮件,询问 有关情况。
注意:1.词数100左右,信的格式已为你写好; 2.可根据内容要点适当增加细节,以使行文连贯; 3.参考词汇:牛津Oxford;费用fee。 Dear Sir/Madam, ________________________ Yours, Li Hua 案例分析⊙ 这是一篇典型的图表式作文,要求写一封电子邮件,询问旅行社 有关一则广告的情况。细读图表和文字提示可知本文是一篇应用文, 时态以一般现在时为主,人称为第一人称。本文内容要点包括:开头 语;学生票价;费用是否包含景点门票、午餐;返回牛津的时间;是 否有购物时间等,并稍加评论。
二、图表作文的应试策略 1.审读图表前的文字说明,弄清图表的性质,做到“四确定”。 首先,确定文章的体裁;其次,确定文章的结构;再次,确定文章的 时态;最后,确定文章的人称。 2.审读图表后的要求,寻找做题规律,要注意以下几个方面: (1)词数:100左右。 (2)开头或结尾已给出,这就要求考生首先不能另行开头或结尾; 其次,要细读所给语句的人称、时态和语言的表达风格,力求前后一 致。 (3)内容完整,即要点齐全,写作时要注意详略得当和准确全面。
高考英语作文复习--图表类作文专题讲解
高考英语作文复习--图表类作文专题讲解第一类:图表类作文写作步骤:1.点明图表所反映的主题。
常用词汇:table, chart, figure, graph, describe, tell,show, represent等2.分析数据差异及趋势或者描写数据代表内容。
注意层次。
常用词汇:rise,increase, drop, reduce, decrease, fall. but, on the contrary, however, the same as, be similar to, be different from 等3.归纳总结或发表自己看法。
常用词汇:in a word, in short, to sum up, We candraw the conclusion that……等。
重点句子:一.引入话题1.It can be seen from the table that….2.As is indicated in the chart,….3.From the sharp rise (上升n.) / decline (下降n.) in the chart, it goes withoutsaying that….(不用说…)4.It has gone up(上升) / fallen / dropped(下降) considerably in recent years.二.描述变化或原因1.表示递进what’s more, besides, in addition, furthermore, to makematters worse, what’s worse (更糟糕的是)2.表示解释account for , that is to say, mean, in other words3.表示变化---快速上升rise (increase / go up ) sharply (quickly, rapidly)Eg: The number sharply went up.---缓慢下降decrease (reduce/ come down/ decline/ drop/ fall) slowly---表示对比compare with , contrary to, on the contrary4.描述多重原因---There are several reasons behind the situation reflected in the above table. First of all, ……; More importantly,…….; Most importantly,……..;---There are at least two good reasons accounting for this phenomenon. On one hand,…….; On the other hand,………; In addition,…. is responsible for….三.总结或评论1.Personally speaking, in a word, in conclusion,2.It can be concluded that….(可以得出结论,)3.From the above discussion, we have enough reasons to predict what will happenin the near future.4.The trend described in the table will continue for quite a long time if necessarymeasures are not taken.5.As far as I’m concerned, I hold the view that……6.I’m sure my opinion is both sound and well-grounded. (既合理又理由充分)写作模版:1.分析图表数字代表内容Ascan be seen from the chart, _____________________(话题).Different people hold different opinions on this matter.Obviously, the majority of the people believe that ______________. However, others (20%) consider that_______________. Besides, another 5% hold the view that_______________.As far as I am concerned, we should pay more attention to __________. On one hand, ________________. On the other hand, __________________.2.分析数字反映的原因As can be seen from the chart, ____________________(话题). Different people hold different opinions. About 60% of the people ____________, while 25% of the people ______________.The least people, accounting for 15%, _______________.Various reasons are responsible for their different choices. To begin with, ___________. What’s more, ______________.Besides, _____________.As far as I am concerned, I am in favor of the view that_____________. I believe that ___________________.或As far as I am concerned, despite such problems, I hold the view that we should ________________. Only in this way can we _______________.图表类作文实战1:下面的图表显示了你们学校高三学生周末放假的学习生活情况。
专题06 上海高考图表类作文(解析版)

►专题06 上海高考图表类作文_________________________________________________________________________________________考点精讲【考情链接】图表类书面表达常以数据表格形式、曲线图形式、流程图形式、柱形图形式、饼式图形式及平面图形式出现。
这类题型具有文字少、信息简洁、要点分散等特征。
图表类书面表达在近年的高考中时有出现,这类统计图在日常生活中应用得非常广泛,因此,读懂它并能用英语清晰地表述出来具有很强的现实意义。
图表作文主要是介绍或说明某方面的情况,文体上属于说明文。
应按照说明文的形式和特点来进行写作。
由于这类试题文字少、信息简洁,如果只是把图表中的内容一点一点地记叙出来,进行清单式的罗列,就会索然乏味,并且达不到字数要求。
【要点梳理】➢要点一:细读图表,抓住特征图表中的数据信息往往较多,首先要读懂其中的符号和数字所代表的意思。
然后,从图表的整体着手,认真分析各项数据,抓住其主要特征,弄懂它们所揭示的规律。
经常使用的词汇有:table,chart,figure,graph,describe,tell,show,represent等。
➢要点二:认真审读,确定主题认真审读试题所提供的数据信息,结合文字提示,确定短文的主题。
短文的主题往往隐含在图表中,需要考生从图表数据中概括出事情或事件的规律和特征,然后归纳出主题。
有时,试题给出了短文的题目,也就等于为考生点明了主题。
➢要点三:巧用数据,突出主题引用数据说明基本趋势,比较数据揭示基本特征。
由于图表中的数据信息较多,写作时要巧妙地引用一些数据来说明主题,不要作任何发挥。
表达时,既要包含所有要点,但又不能面面俱到。
经常使用的词汇有:rise,drop,reduce,increase,decrease,fall,while,but,on the contrary,however,compare...to/with...,in contrast to,as...as,the same as,similar to,different from,difference between,among,more than,less than等。
英语:高考图表作文写作方法

• 图表作文典型句式:描述总趋势(有增有减)
• The line graph shows how the number of…changed between1992 and 2002. • The bar graph shows the changes of… from 1992 to 2002.
As far as I am concerned, I hold the point of view that __. I am sure my opinion is both sound and wellgrounded.
Sample2:请你根据下表提供的信息写一篇题为Changes in Chinese People's Diet的短文,短文可分为三小节: 1)state the changes in people's diet in the past five years; 2)give possible reasons for the changes; 3)draw your own conclusions. 注意:1. 尽可能少引用数据; 2. 词数100左右。
Grain, the main food of the most people in China, is now playing a less important role. The amount of fruit and vegetables in the average person's diet has also dropped by 1.5 percent from 1998 to 2002. The amount of milk and meat has increased.
As is shown by the figure in the table , __作文题目的议 题__ has been on rise, significantly/dramatically/steadily rising/decreasing from__ in __ to __ in __. From the sharp/marked decline/ rise in the chart, it goes without saying that __. There are at least two good reasons accounting for __. On the one hand, __. On the other hand, __ is due to the fact that __.In addition, __ is responsible for __.Maybe there are some other reasons to show __.But it is generally believed that the above mentioned reasons are commonly convincing.
- 1、下载文档前请自行甄别文档内容的完整性,平台不提供额外的编辑、内容补充、找答案等附加服务。
- 2、"仅部分预览"的文档,不可在线预览部分如存在完整性等问题,可反馈申请退款(可完整预览的文档不适用该条件!)。
- 3、如文档侵犯您的权益,请联系客服反馈,我们会尽快为您处理(人工客服工作时间:9:00-18:30)。
写作指导
人称: 第三人称
时态: 现在完成时& 一般现在时
要点:
99 00 01 02 03 04 05 06 07 08 09
1. 近10年我国私人汽 车拥有量发生了巨变;
2. 2009年私人汽车拥 有量比1999年增加了5 倍多; 3. 理由1:经济增长快; 4. 理由2:节约时间; 5. 你对此现象的看法。
2020/10/8
2020/10/8
Step2 比较数字,分析特点; 找出产生变化的原因。
变化描述词汇: 表示上升: rise,increase,climb,go up , … 表示下降: fall,decline,decrease,drop,go down, … 表示平稳: remain steady/unchanged… 表示程度: sharp,slight ,sudden…
20209/190/8 00 01 02 03 04 05 06 07 08 09
变化描述句型:
1. There was a great /slight increase /rise in… 2. There has been a sudden/slow/rapid
fall/drop in… 3. The rate dropped slightly from 38% in…to
99 00 01 02 03 04 05 06 07 08 09
2020/10/8
Step3 得出结论
结论常用句型:
1. From the analyses above, we can draw the conclusion that...
2. From the data we gathered from the above graph, we can conclude that...
Writing Practice
——based on tables and graphs
2020/10/8
Bar Chart / Graph 柱状图
2020/10/8
Pie Chart 饼状图
2020/10/8
2020/10/8
Graph
表示两组数的关系-通常为函数关系图
2020/10/8
图表作文分类:
2020/10/8
prac:tice
下图是我国近10年私人汽车拥有情况,反映了人们生活水平的 变化. 请根据数据,写一篇标题 为Car Ownership in China 短文,包括以下内容: 1. 近10年我国私人汽车拥有量增加了5倍多; 2. 增加的理由是:经济增长快;节约时间。 3. 你对此现象的看法。
1. The reason why…is that… 2. One may think of the change as a result of… 3. The change in … largely results from the fact
that… 4.This brings out the important fact that… 5. The key factor(因素)lies in… 6. It is because of … that …
31% in… 4. Compared with…,it decreased/increased/fell
from … to… 5. The number is four times more than ….in…
2020/109/89 00 01 02 03 04 05 06 07 08 09
原因描述句型:
数字表:曲线图 graph
表格
table
图形表:几何图形 figure
饼状图 pie chart
条状图 bar chart
平面图 diagram
2020/10/8
图表作文三个层次要求
图表式作文分三个层次来写:
1. 概括大意:按题目要求描述图表反映的总情况。 2. 比较数字,分析特点; 找出产生变化的原因。比较数字,
分析特点; 找出产生变化的原因。 3. 想法和评论(读图表后),从而得出自己的结论。
General introduction——Analysis——Conclusion 概要介绍——分析图表——总结概括
2020/10/bove conveys a clear message to the use that 88% of all students in the World Religions class celebrate Easter.
The number of private cars increased more than 5 times from nearly 3 million in 1999 to over 15 million in 2009. It’s mainly because the economy of China has developed so rapidly that many Chinese people want to own private cars. Besides, in modern society, many Chinese need a car to do business so as to save time.
3. According to the information gathered above, we may reach the conclusion that...
4. According to what has been discussed above, we can arrive at the conclusion that...
2020/10/8
篇章结构:
1. introduction 2. changes and reasons 3. your opinion/advice
As can be seen from the graph, great changes in car ownership have taken place in China in the past ten years.