SY-800测速仪使用说明书
Extech SDL800 振动计测器用户指南说明书
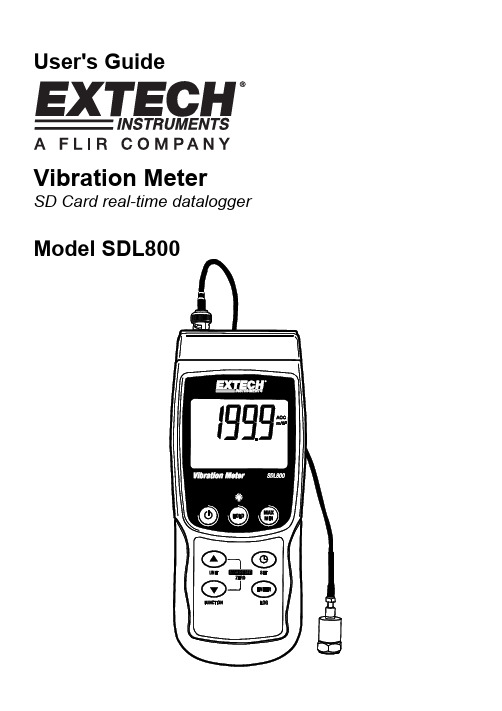
User's Guide Vibration MeterSD Card real-time dataloggerIntroductionCongratulations on your purchase of the Extech SDL800 Vibration Meter. This meter displays and stores vibration readings of Acceleration, Velocity and Displacement. Supported measurement units are meters/s2, ft/s2, g, mm/s, cm/s, in/s, mm and inch. Logged data readings are stored on an SD card for transfer to a PC. This meter is shipped fully tested and calibrated and, with proper use, will provide years of reliable service.SafetyInternational Safety SymbolsThis symbol, adjacent to another symbol or terminal, indicates the user must refer to themanual for further information.Backlight keyON-OFF keyNotes: Items listed in “10” are located behind the snap-off compartment cover on meter’s right side. Battery compartment, tilt stand, and tripod mount are located on the rear of the instrumentGetting StartedPower ON-OFF•Power the meter by pressing and holding the power button for at least 1.5 seconds.•Press and hold the power button for at least 1.5 seconds to power OFF the meter.•This meter is powered by six (6) 1.5VDC ‘AA’ batteries or by optional AC adaptor. If the meter will not switch ON please check that fresh batteries are installed in the rear battery compartment or, in the case of the AC adaptor, check that the adaptor is connected correctly to the meter and to an AC source.Display BacklightTo turn the display backlight ON or OFF, press and hold the backlight button for at least 1.5 seconds. The meter will beep when switching the backlight ON or OFF unless the beeper isdisabled.Vibration SensorConnect the vibration pickup to the cable supplied. Make sure it is firmly attached.Connect the cable to the meter by attaching it to the BNC connector on the top of the meter.If the surface to be tested is magnetic, attach the magnetic base to the vibration pickup and attach the pickup to a flat surface.If the surface to be tested is not magnetic, hold the pickup against the surface. Do not hold the cable while making measurements.Units of MeasureThe currently selected unit of measure is shown on the meter’s LCD. To change the unit ofmeasure, press and hold the UNIT button until the desired unit of measure appears and then release the UNIT button. The meter begins scrolling through the available units of measure after the UNIT button has been depressed for at least 1.5 seconds. The saved units will become the default turn-on units.INDICATORUNIT DISPLAYACCm/s2gVELmm/scm/sDISP p-p mmACC ft/s2VEL In/sDISP p-p inchFunction SelectionThe currently selected function is shown on the meter’s LCD. To change the function, press and hold the FUNCTION button until the desired function appears, then release the FUNCTION button.The available functions are:RMS: typical selection for Acceleration and VelocityPEAK: displays the peak value of the vibrationMAX HOLD: displays and holds the max value measuredMAX HOLD ResetPress and hold the ▲ and ▼ buttons for 1.5 seconds to clear the max Hold reading.Data HoldTo freeze a displayed reading on the LCD, momentarily press the HOLD button (the HOLD icon will appear above the reading). To exit HOLD, press the HOLD button again.ZERO AdjustmentThe ZERO function is used to remove any small offset caused by temperature changes or other environmental changes. The zero will only work for a display of 10 or less digits.1. Connect the vibration sensor to the meter2. Set the measurement function to Acceleration3. Make sure the sensor is motionless and not subject to any vibrations4. Press and Hold the ▼ and ▲buttons for 1.5 seconds and the meter will zeroMax-Min Reading RecordFor a given measurement session, this meter can record the highest (MAX) and the lowest (MIN) readings for later recall.1. Press the MAX-MIN button momentarily to access this mode of operation (REC icon appears)2. The meter is now recording the MAX and MIN readings.3. Press the MAX-MIN button again to view the current MAX readings (MAX icon appears). Thereadings on the display are now the highest readings encountered since the REC icon wasswitched on (when the MAX-MIN button was first pressed).4. Press the MAX-MIN button again to view the current MIN readings (MIN icon appears). Thereadings on the display are now the lowest readings encountered since the REC icon wasswitched on (when the MAX-MIN button was first pressed).5. To exit the MAX-MIN mode, press and hold the MAX-MIN button for at least 1.5 seconds. Themeter will beep, the REC-MAX-MIN icons will switch off, the MAX-MIN memory will clear, and the meter will return to the normal operating mode.Setup ModeBasic settings at a glanceTo view the current configuration of the meter with regard to time, date, and datalogging sampling rate press the SET button momentarily. The meter will now display the configuration in quicksuccession. If the information is missed on the first try, simply press the SET button again until all of the information is noted.Accessing the Setup mode1. Press and hold the SET button for at least 1.5 seconds to access the Setup menu.2. Press the SET button momentarily to step through the available parameters. The parametertype is shown on the bottom of the LCD and the current selection for that type is shown above it.3. When a parameter is displayed that is to be changed, use the arrow keys to change the setting.Press the ENTER button to confirm a change.4. Press and hold the SET button for at least 1.5 seconds to exit the Setup mode. Note that themeter automatically switches out of the Setup mode if no key is pressed within 7 seconds.5. The available Setup parameters are listed below. Additional detailed information is providedbelow this list:dAtE Set the clock (Year/Month/Date; Hours/Minutes/Seconds)SP-t Set the datalogger sampling ratePoFF Automatic power-off management (Enable or disable the auto-power off function)bEEP Set the beeper sound ON/OFFdEC Set the numerical format; USA (decimal: 20.00) or European (comma: 20,00)Sd F Format the SD memory cardSetting the Clock Time1. Access the dAtE parameter.2. Use the ENTER button to step through the selections (year, month, day, hour, minute, second)3. Use the arrow keys to change a value4. Press and hold the SET button for at least 1.5 seconds to exit to the normal operation mode (orsimply wait 7 seconds for the meter to automatically switch to the normal operating mode).5. The clock will keep accurate time even when the meter is switched off. However, if the batteryexpires the clock will have to be reset after fresh batteries are installed.Setting the Datalogger Sampling Time (Rate)1. Access the SP-t parameter.2. The sampling rate can be set to 0, 1, 2, 5, 10, 30, 60, 120, 300, 600, 1800 or 3600 seconds.3. Use the arrow keys to change the digit values.4. Press the ENTER button to confirm the entry.5. Press and hold the SET button for at least 1.5 seconds to exit to the normal operation mode (orsimply wait 7 seconds for the meter to automatically switch to the normal operating mode).Enabling/Disabling the Auto Power OFF FeaturePoFF parameter.the1. Access2. Use the arrow buttons to select ON or OFF. With the Auto Power OFF feature enabled, themeter will automatically switch OFF after 10 minutes of inactivity.3. Press ENTER to confirm setting.4. Press and hold the SET button for at least 1.5 seconds to exit to the normal operation mode (orsimply wait 7 seconds for the meter to automatically switch to the normal operating mode).Set the Beeper Sound ON or OFFbEEP parameter.1. Accessthe2. Use the arrow buttons to select ON or OFF.3. Press ENTER to confirm setting.4. Press and hold the SET button for at least 1.5 seconds to exit to the normal operation mode (orsimply wait 7 seconds for the meter to automatically switch to the normal operating mode). Numerical Format (comma or decimal)European and USA numerical formats differ. The meter defaults to USA mode where a decimal point is used to separate units from tenths, i.e. 20.00; The European format uses a comma, i.e.20,00 to separate units from tenths. To change this setting:thedEC parameter.1. Access2. Use the arrow buttons to select USA or EUro.3. Press ENTER to confirm setting.4. Press and hold the SET button for at least 1.5 seconds to exit to the normal operation mode (orsimply wait 7 seconds for the meter to automatically switch to the normal operating mode).SD Card FORMATTING1. AccessSd-F parameter.the2. Use the arrow buttons to select YES to format the card (select NO to abort). Note that all dataon the card will be lost if formatting is attempted.3. Press ENTER to confirm selection.4. Press ENTER again to re-confirm.5. The meter will automatically return to the normal operating mode when formatting is complete.If not, press and hold the SET button for at least 1.5 seconds to exit to the normal operationmode.System ResetIf the meter’s keys become inoperable or if the display freezes, the Reset button can be used to reset the instrument.•Use a paper clip or similar item to momentarily press the reset button located on the lower right side of the instrument .•After pressing the Reset button, switch the instrument ON by pressing and holding the POWER key for at least 1.5 seconds. If using the power adaptor unplug the adaptor and then plug it back in again to power the meter.DataloggingTypes of Data Recording•Manual Datalogging: Manually log up to 99 readings onto an SD card via push-button press.•Automatic Datalogging: Automatically log data onto an SD memory card where the number of data points is virtually limited only by the card size. Readings are logged at a rate specified by the user.SD Card Information•Insert an SD card (from 1G size up to 16G) into the SD card slot at the bottom of the meter. The card must be inserted with the front of the card (label side) facing toward the rear of the meter.•If the SD card is being used for the first time it is recommended that the card be formatted and the logger’s clock set to allow for accurate date/time stamping during datalogging sessions.Refer to the Setup Mode section for SD card formatting and time/date setting instructions.•European and USA numerical formats differ. The data on the SD card can be formatted for either format. The meter defaults to USA mode where a decimal point is used to separate units from tenths, i.e. 20.00. The European format uses a comma, i.e. 20,00. To change this setting, refer to the Setup Mode section.Manual DataloggingIn the manual mode the user presses the LOG button to manually log a reading onto the SD card.1. Set the sampling rate to ‘0’ seconds as described in the Setup Mode section.2. Press and hold the LOG button for at least 1.5 seconds and the DATALOGGER icon will appearon the LCD; the lower portion of the display will show p-n (n = memory position number 1-99).Note that if PSI is set as the unit of measure it appears as P51 (where a ‘5’ is used as an ‘S’) in the same area of the LCD where memory locations are shown. This can be disorienting at first.3. Momentarily press the LOG button to store a reading. The DATALOGGER icon will flash eachtime a data point is stored.4. Use the ▲ and ▼ buttons to select one of the 99 data memory positions in which to record.5. To exit the manual datalogging mode, press and hold the LOG button for at least 1.5 seconds.The DATALOGGER icon will switch off.Automatic DataloggingIn automatic datalogging mode the meter takes and stores a reading at a user-specified sampling rate onto an SD memory card. The meter defaults to a sampling rate of two seconds. To change the sampling rate, refer to the Setup Mode section (the sampling rate cannot be ‘0’ for automatic datalogging):1. Select the sampling rate in the Setup Mode to a value other than zero.2. Press and hold the LOG button for at least 1.5 seconds. The meter will flash the DATALOGGERicon at the selected sampling rate indicating that readings are now being automatically recorded to the SD card.3. If a card is not inserted or if the card is defective, the meter will display SCAN SD indefinitely. Inthis case, switch the meter OFF and try again with a valid SD card.4. Pause the datalogger by pressing the LOG button momentarily. The DATALOGGER icon willstop flashing and the sample rate will display for a short time. To resume logging simply press the LOG button again momentarily.5. To terminate the datalogging session press and hold the LOG button for at least 1.5 seconds.6. When an SD card is used for the first time a folder is created on the card and named VBD01.Up to 99 spreadsheet documents (each with 30,000 readings) can be stored in this folder.7. When datalogging begins a new spreadsheet document named VBD01001.xls is created on theSD card in the VBD01 folder. The data recorded will be placed in the VBD01001.xls document until 30,000 readings are reached.8. If the measurement session exceeds 30,000 readings, a new document will be created(VBD01002.xls) where another 30,000 readings can be stored. This method continues for up to99 documents, after which another folder is created (VBD02) where another 99 spreadsheetdocuments can be stored. This process continues in this same fashion with folders VBD03through VBD10 (last allowable folder).SD Data Card to PC Data Transfer1. Complete a datalogging session as detailed in above in the previous sections. Hint: For thefirst few tests, simply record a small amount of test data. This is to ensure that the datalogging process is well understood before committing to critical, large scale datalogging.2. With the meter switched OFF, remove the SD Card.3. Plug the SD Card directly into a PC SD card reader. If the PC does not have an SD card slot,use an SD card adaptor (available at most outlets where computer accessories are sold).4. Power the PC and run a spreadsheet software program. Open the saved documents in thespreadsheet software program (see example spreadsheet data screen below).Spreadsheet data exampleRS-232/USB PC InterfaceThe optional 407001A software kit (software and cable) allows streaming of data to a PC viathe RS232 Output jack.AC Power AdaptorThis meter is normally powered by six (6) 1.5V ‘AA’ batteries. An optional 9V power adaptor is available. When the adaptor is used, the meter is permanently powered and the power button will be disabled.Battery Replacement and DisposalWhen the low battery icon appears on the LCD, the batteries must be replaced. Several hours of accurate readings are still possible in this condition; however batteries should be replaced as soon as possible:•Remove the two (2) Phillips screws from the rear of the meter (directly above the top of the tilt stand).•Remove and safely place the battery compartment and screws where they will not be damaged or lost.•Replace the six (6) 1.5V ‘AA’ batteries observing polarity.•Replace the battery compartment cover with the two (2) Phillips screws.All EU users are legally bound by the battery ordinance to return all used batteries tocollection points in your community or wherever batteries / accumulators are sold!Disposal in the household garbage is prohibited!SpecificationsDisplay Backlit LCD; LCD size: 52 x 38mm (2 x 1.5”)Status indicators Over-range audible beep and low battery display iconFrequency Range 10Hz to 1kHzDatalogger Sampling Rate AUTO LOGGING: From 1 to 3600 seconds.MANUAL LOGGING: Set the sampling rate to ‘0’ seconds Memory Card SD memory card; 1G to 16GB sizeData Hold Freeze the displayed readingMemory Recall Record and Recall the Maximum and Minimum readingsDisplay update rate Approx. 1 secondData Output RS-232 / USB PC computer interfaceOperating Temperature 0 to 50°C (32 to 122°F)Operating Humidity 85% R.H. max.Auto Power OFF A fter 10 minutes of inactivity (can be disabled)Power Supply Six (6) 1.5 VDC batteries (optional 9V AC adaptor)Power Consumption Normal operation (backlight and datalogger OFF): approx. 5mAdcWith backlight OFF and datalogging ON: approx. 25mAdcWith backlight ON add approx. 12mAdcWeight 343g (0.75 lbs.) w/ batteries; 241g (0.53 lbs.) w/o batteriesDimensions Meter: 182 x 73 x 47.5mm (7.1 x 2.9 x 1.9”)Vibration sensor: round 16mm (0.63”) diameter, 37mm (1.46”)lengthElectrical SpecificationsFunction Unit Range Accuracym/s20.5 to 199.9 m/s2g 0.05 to 20.39 G ft/s2 2 to 656 ft/s2± ( 5%rdg + 2 d ) @ 80 and 160HzAccelerationCalibration Point: 50 m/S^2 ( 160 Hz )mm/s 0.5 to 199.9 mm/scm/s 0.05 to 19.99 cm/s inch/s 0.02 to 7.87 inch/s ± ( 5%rdg + 2 d ) @ 80 and 160HzVelocityCalibration Point: 50 mm/s ( 160 Hz )mm 1.999mm inch 0.078inch ± ( 5%rdg + 2 d ) @ 80 and 160HzDisplacementCalibration Point: 0.141 mm ( 160 Hz )Above specification tests under the environment RF Field Strength less than 3 V/M & frequency less than 30 MHz only and 23±0.5ԨCopyright © 2011 Extech Instruments Corporation (a FLIR company)All rights reserved including the right of reproduction in whole or in part in any form。
流速测算仪说明书
流速测算仪使用说明书文章来源:/esite/detail10077395.htm目录1:技术要求2:测量原理3:仪器的操作使用4:数据的存储5:流量计算6:存储数据查询7:仪器的维护8:仪器的全套设备9: 流速仪型号、延时输入表10:仪器软件操作说明注:本说明书中的参数只供参考,使用时应按照鉴定证书的参数为准便携式流速测算仪便携式流速测算仪是专门为水文站,水文地质调查,环保监测、灌区等部门而专门研制的新型仪器。
该仪器具有耗电省、功能齐全、自动化程度高、稳定可靠,适用性强等优点。
适用于接收各种转子流速传感器所产生的信号。
一:技术指标▲流速范围:0.05~7m/s▲精度:<1.5%▲显示:汉字液晶显示,4行32位▲存储:可存储100个断面数据▲通讯:标准RS232接口▲无线:具有无线接口,可与缆道等配套使用▲工作温度:-10℃~50℃▲工作电源:7.2V\\4200mAh,可充电二: 原理流速、流量计算:测流速时,由于水力推动转子流速仪旋转,流速仪内部信号装臵产生转数信号,便携式流速测算仪接收信号,再根据下面公式计算流速: V = K •N/T + C(m/s)。
式中V:测流时段内平均流速K: 桨叶水力螺距C: 流速仪校订常数T: 测流时间(单位为S)N: 时段内信号数本仪器使用时,K、C均为校订常数,测流时,只要测出T和N,即可算出流速V。
依据流量公式Q=V•S而设计,只要计算出断面截面积S并臵入就可求得流量Q(m ³/s)注该机流量适合管道和标准小渠道和标准出水口用。
三: 仪器的操作使用:仪器开机显示如图1所示:请输入流速仪型号→1 2图1: 型号设臵本仪器共设3个操作按键,如图2所示:换屏臵数移位图2:如上所示3.1 参数设臵操作:3.1.1用臵数键和移位键将流速仪型号臵入, 黑色闪烁光标(z)在哪个位臵闪烁可按下臵数键修改该位臵数据,按一下换位键将光标移到下一位臵。
如1206B流速仪臵入12即可,(具体型号看说明书最后一页)显示如下:请输入流速仪型号→0 0图3:按“臵数”键到显示2为止请输入流速仪型号→1 2图4: 型号设臵型号臵好后按换屏键进入仪器参数设臵显示图面同时保存以上设臵(如下图)。
豫州希凯视觉数字科技有限公司产品说明书:移动速度检测仪快速入门指南
Network Traffic Camera • User ManualPortable Radar Speed DetectorQuick Start Guide© 2019 Hangzhou Hikvision Digital Technology Co., Ltd. All rights reserved.This Manual is the property of Hangzhou Hikvision Digital Technology Co., Ltd. or its affiliates (hereinafter referred to as “Hikvision”), and it cannot be reproduced, changed, translate d, or distributed, partially or wholly, by any means, without the prior written permission of Hikvision. Unless otherwise expressly stated herein, Hikvision does not make any warranties, guarantees or representations, express or implied, regarding to the Manual, any information contained herein.About this ManualThe Manual includes instructions for using and managing the Product. Pictures, charts, images and all other information hereinafter are for description and explanation only. The information contained in the Manual is subject to change, without notice, due to firmware updates or other reasons. Please find the latest version of this Manual at the Hikvision website ().Please use this Manual with the guidance and assistance of professionals trained in supporting the Product.Trademarks Acknowledgement●and other Hikvision’s trademarks and logos are the properties of Hikvision in various jurisdictions.●Other trademarks and logos mentioned are the properties of their respective owners.LEGAL DISCLAIMER●TO THE MAXIMUM EXTENT PERMITTED BY APPLICABLE LAW, THIS MANUAL AND THE PRODUCT DESCRIBED, WITHITS HARDWARE, SOFTWARE AND FIRMWARE, ARE PROVIDED “AS IS” AND “WITH ALL FAULTS AND ERRORS”.HIKVISION MAKES NO WARRANTIES, EXPRESS OR IMPLIED, INCLUDING WITHOUT LIMITATION, MERCHANTABILITY, SATISFACTORY QUALITY, OR FITNESS FOR A PARTICULAR PURPOSE. THE USE OF THE PRODUCT BY YOU IS AT YOUR OWN RISK. IN NO EVENT WILL HIKVISION BE LIABLE TO YOU FOR ANY SPECIAL, CONSEQUENTIAL, INCIDENTAL, OR INDIRECT DAMAGES, INCLUDING, AMONG OTHERS, DAMAGES FOR LOSS OF BUSINESS PROFITS, BUSINESS INTERRUPTION, OR LOSS OF DATA, CORRUPTION OF SYSTEMS, OR LOSS OF DOCUMENTATION, WHETHER BASED ON BREACH OF CONTRACT, TORT (INCLUDING NEGLIGENCE), PRODUCT LIABILITY, OR OTHERWISE, IN CONNECTION WITH THE USE OF THE PRODUCT, EVEN IF HIKVISION HAS BEEN ADVISED OF THE POSSIBILITY OF SUCH DAMAGES OR LOSS.●YOU ACKNOWLEDGE THAT THE NATURE OF INTERNET PROVIDES FOR INHERENT SECURITY RISKS, AND HIKVISIONSHALL NOT TAKE ANY RESPONSIBILITIES FOR ABNORMAL OPERATION, PRIVACY LEAKAGE OR OTHER DAMAGES RESULTING FROM CYBER-ATTACK, HACKER ATTACK, VIRUS INSPECTION, OR OTHER INTERNET SECURITY RISKS;HOWEVER, HIKVISION WILL PROVIDE TIMELY TECHNICAL SUPPORT IF REQUIRED.●YOU AGREE TO USE THIS PRODUCT IN COMPLIANCE WITH ALL APPLICABLE LAWS, AND YOU ARE SOLELYRESPONSIBLE FOR ENSURING THAT YOUR USE CONFORMS TO THE APPLICABLE LAW. ESPECIALLY, YOU ARE RESPONSIBLE, FOR USING THIS PRODUCT IN A MANNER THAT DOES NOT INFRINGE ON THE RIGHTS OF THIRD PARTIES, INCLUDING WITHOUT LIMITATION, RIGHTS OF PUBLICITY, INTELLECTUAL PROPERTY RIGHTS, OR DATA PROTECTION AND OTHER PRIVACY RIGHTS. YOU SHALL NOT USE THIS PRODUCT FOR ANY PROHIBITED END-USES, INCLUDING THE DEVELOPMENT OR PRODUCTION OF WEAPONS OF MASS DESTRUCTION, THE DEVELOPMENT OR PRODUCTION OF CHEMICAL OR BIOLOGICAL WEAPONS, ANY ACTIVITIES IN THE CONTEXT RELATED TO ANY NUCLEAR EXPLOSIVE OR UNSAFE NUCLEAR FUEL-CYCLE, OR IN SUPPORT OF HUMAN RIGHTS ABUSES.●IN THE EVENT OF ANY CONFLICTS BETWEEN THIS MANUAL AND THE APPLICABLE LAW, THE LATER PREVAILS.Regulatory InformationFCC InformationPlease take attention that changes or modification not expressly approved by the party responsible for compliance could void the user’s authority to operate the equipment.FCC compliance: This equipment has been tested and found to comply with the limits for a Class A digital device, pursuant to part 15 of the FCC Rules. These limits are designed to provide reasonable protection against harmful interference when the equipment is operated in a commercial environment. This equipment generates, uses, and can radiate radio frequency energy and, if not installed and used in accordance with the instruction manual, may cause harmful interference to radio communications. Operation of this equipment in a residential area is likely to cause harmful interference in which case the user will be required to correct the interference at his own expense. FCC ConditionsThis device complies with part 15 of the FCC Rules. Operation is subject to the following two conditions:1. This device may not cause harmful interference.2. This device must accept any interference received, including interference that may cause undesired operation.EU Conformity StatementThis product and - if applicable - the supplied accessories too are marked with "CE" and comply therefore with the applicable harmonized European standards listed under the EMC Directive 2014/30/EU, the LVD Directive 2014/35/EU, the RoHS Directive 2011/65/EU.2012/19/EU (WEEE directive): Products marked with this symbol cannot be disposed of as unsorted municipal waste in the European Union. For proper recycling, return this product to your local supplier upon the purchase of equivalent new equipment, or dispose of it at designated collection points. For more information see: 2006/66/EC (battery directive): This product contains a battery that cannot be disposed of as unsorted municipal waste in the European Union. See the product documentation for specific battery information. The battery is marked with this symbol, which may include lettering to indicate cadmium (Cd), lead (Pb), or mercury (Hg). For proper recycling, return the battery to your supplier or to a designated collection point. For more information see: Industry Canada ICES-003 ComplianceThis device meets the CAN ICES-3 (A)/NMB-3(A) standards requirements.Symbol ConventionsThe symbols that may be found in this document are defined as follows.Safety InstructionsTABLE OF CONTENTSChapter 1 Introduction (6)Introduction (6)Appearance and Interfaces (6)Left Panel (6)Right Panel (7)Chapter 2 Installation (8)Change Battery (8)Insert SIM Card (9)Install Speed Detector (10)Chapter 3 Network Connection (13)Wire over the LAN (13)Activate the Speed Detector (14)Activate via Web Browser (14)Activate via SADP Software (15)Chapter 4 Login (17)Chapter 1 IntroductionIntroductionPortable radar speed detector (hereinafter referred to as speed detector) integrates speeddetection, image processing, smart analysis, license plate recognition, storage and display. It can automatically detect vehicles in specific direction or vehicles exceeded speed limit. It is easy to operate with included lithium battery, radar, LCD display, and solid state drive.Appearance and InterfacesLeft PanelPower Switch19 VDC Power InputNetwork InterfaceUSBSupplement Light Signal OutputBatteryLeft Panel● Power Switch: Long press to power on/off. ● Supplement Light Signal Output: Support external IR, white light supplement, and ICR.Right PanelLens AngleAdjustment ButtonSIM Card SlotRight PanelChapter 2 InstallationChange BatteryPurpose:When battery is in low level, or speed detector is not convenient to be charged, change battery to keep it running normal.Press the battery buckle according to the direction marked in the figure.BatteryBucklePress Battery BuckleDraw out the battery.BatteryDraw Out BatteryInset the new battery into the battery slot.Press the battery buckle according to the direction marked in the figure, to fasten the battery buckle.Fasten Battery BuckleInsert SIM CardUnscrew the two screws in SIM card cover by L-shape hex screwdriver, and take off the cover.SIM Card CoverInsert SIM CardInsert the SIM card into the slot with gap in right side and mental sheet in upward.SIM Card SlotInsert SIM CardTake back the SIM card cover and fix two screws.Install Speed DetectorCheck the speed detector, tripod, tripod PTZ base, and tripod PTZ upper cover. Loosen the knob, and take off the tripod PTZ upper cover.PTZ Upper CoverKnobTake Off PTZ Upper CoverFix the speed detector to PTZ upper cover by screws from tripod package.Speed DetectorPTZ Upper CoverFix Speed Detector and PTZ Upper CoverFix the PTZ upper cover on PTZ base.PTZ BaseFix PTZ BaseTurn the knob to adjust the direction of speed detector according to actual demand.Adjust Direction Lock the knob to fasten the speed detector.Storage media can be used after formatting.Chapter 3 Network Connection●You shall acknowledge that the use of the product with Internet access might be undernetwork security risks. For avoidance of any network attacks and information leakage,please strengthen your own protection. If the product does not work properly, pleasecontact with your dealer or the nearest service center.●To ensure the network security of the speed detector, we recommend you to have thespeed detector assessed and maintained termly. You can contact us if you need suchservice.Before you start:To view and configure the speed detector via a LAN, you need to connect the speed detector in the same subnet with your computer, and install the SADP to search and change the IP address of the speed detector.Wire over the LANThe following figures show the two ways of cable connection of the speed detector and a computer.●Directly connect the speed detector to the computer with a network cable.●Set the speed detector over the LAN via a switch or a router.Network CableComputerPortable Radar Speed DetectorDirect ConnectionSwitchComputerFixed Radar Speed DetectorConnection via a Switch or a RouterActivate the Speed DetectorYou are required to activate the speed detector first by setting a strong password for it before you can use it. Multiple activation methods are supported. Here we take example of activation via web browser and SADP.Refer to the user manual of client software for the activation via client software.Activate via Web BrowserPower on the speed detector, and connect the speed detector to the network.Input the IP address into the address bar of the web browser, and press Enter to enter the activation interface.Activation Interface (Web)Create a password.STRONG PASSWORD RECOMMENDED– We highly recommend you create a strong password of your own choosing (using a minimum of 8 characters and maximum of 63 characters, including upper case letters, lower case letters, numbers, and special characters) in order to increase the security of your product. And we recommend you reset your password regularly, especially in the high security system, resetting the password monthly or weekly can better protect your product.Confirm the password.Click OK to save the password and enter the live view interface.Activate via SADP SoftwareSADP software is used for detecting the online device, activating the speed detector, and resetting the password.Get the SADP software from the official website, and install the SADP according to the prompts.Run the SADP software to search the online devices.Check the device status from the device list, and select the inactive device.SADP InterfaceCreate a password, and confirm it.Click Activate to activate the device.STRONG PASSWORD RECOMMENDED– We highly recommend you create a strong password of your own choosing (using a minimum of 8 characters, including upper case letters, lower case letters, numbers, and special characters) in order to increase the security of your product. And we recommend you reset your password regularly, especially in the high security system, resetting the password monthly or weekly can better protect your product.Change the device IP address to the same subnet with your computer by either modifying the IP address manually or checking Enable DHCP.Modify Network ParametersInput the password and click Modify to activate your IP address modification.Chapter 4 LoginYou can log in to the speed detector via web browser.Open the web browser.In the browser address bar, input the IP address of the speed detector, and press the Enter key to enter the login interface.Input User Name and Password.Click Login.LoginInstall the plug-in before viewing the live video and operating the speed detector. Follow the installation prompts to install the plug-in.You may have to close the web browser to install the plug-in. Please reopen the web browser and log in again after installing the plug-in.0403001091026UD16949B。
支原体自动检测仪说明书

支原体自动检测仪说明书XXXX有限责任公司中国XXXX前言本仪器为精密光谱分析设备,请仔细阅读本说明书,正确使用仪器。
本仪器适用于肺炎支原体检测试剂3小时/6小时恒温孵育,肺炎支原体快速自动定性检测。
本仪器可完成医院信息、病患信息、仪器参数等设置。
执行项目测试、测试结果打印、测试结果保存(SD卡)、HIS系统连接等功能。
请妥善保管本说明书。
使用须知(1)当设备出现异常气味、冒烟现象时,应立即切断电源,并从电源插座拔下电源插头,然后与厂商联系维修。
(2)设备可接触部分已做绝缘处理,正常使用中如有液体洒落设备中或潜在的侵浊性物质与设备接触,不会产生触电危险,请及时擦拭干净,以延长机器的使用寿命。
(3)设备工作时,操作员应双手戴有医用手套。
(4)处理标本时应注意避免被病原体感染的可能性。
(5)应将检测仪电源插头插在指定电源电压的电源插座上。
(6)设备出现故障时,在使用说明书表示的范围内,由设备的管理者进行处理;在此之外的故障修理,应先关闭电源避免因仪器自带电源带来危害,然后联系厂商进行指导维修或现场维修。
(7)如有大量的液体洒在设备内,用户要立刻关闭电源,再联系厂商进行处理。
(8)应正确使用设备,否则可能会导致仪器损坏。
(9)设备内的电池、保险丝等如需更换,联系厂家,由厂家更换。
检测原理试剂原理Mp快检试剂为一种人工合成专用于Mp快速培养检测的红色液体培养介质,其组成材料是根据Mp结构繁殖增生所需的营养成分而合理配置的一套含蛋白质、磷脂、碳水化合物、胆固醇、微量元素及复合抑杂菌因子等混合而成的营养成分丰富,特异性强的专用试剂。
样本和Mp快检试剂6小时/3小时快速培养后,阴性溶液呈现红色,阳性溶液呈现黄色。
设备原理1、LED发光,透射过试剂瓶,仪器检测单位接受到光后分析,得出结果。
利用光投射原理,检测到检测物的浓度。
2、加热板加热,温度传感器实时检测温度,保证孵育槽的温度在设定值范围内。
性能参数设备开箱和安装检查运输过程中肺炎支原体自动检测仪是否受到损伤。
测速仪使用方法
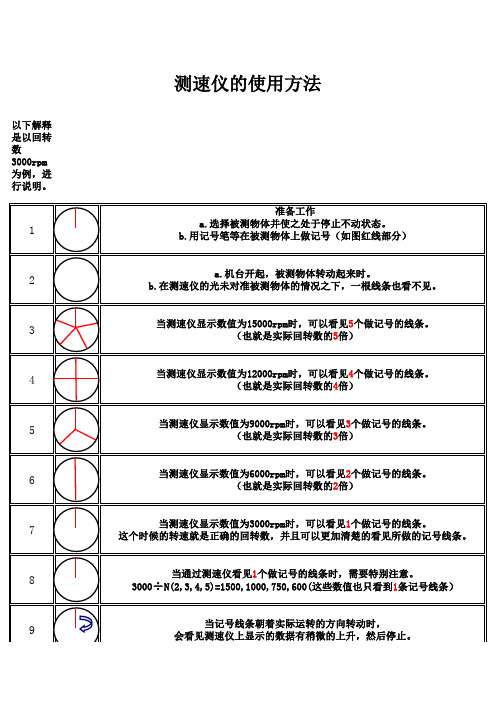
8
当通过测速仪看见1个做记号的线条时,需要特别注意。 3000÷N(2,3,4,5)=1500,1000,750,600(这些数值也只看到1条记号线条)
9
当记号线条朝着实际运转的方向转动时, 会看见测速仪上显示的数据有稍微的上升,然后停止。
10
当记号线条朝着实际运转的反方向转动时, 会看见测速仪上显示的数据有稍微的下降,然后停止。
4
当测速仪显示数值为12000rpm时,可以看见4个做记号的线条。 (也就是实际回转数的4倍)
5
当测速仪显示数值为9000rpm时,可以看见3个做记号的线条。 (也就是实际回转数的3倍)
6
当测速仪显示数值为6000rpm时,可以看见2个做记号的线条。 (也就是实际回转数的2倍)
7
当测速仪显示数值为3000rpm时,可以看见1个做记号的线条。 这个时候的转速就是正确的回转数,并且可以更加清楚的看见所做的记号线条。
测速仪的使用方法
以下解释是以回转数3000rpm为例,进行说明。 准备工作 a.选择被测物体并使之处于停止不动状态。 b.用记号笔等在被测物体上做记号(如图红线部分)
1
2
a.机台开起,被测物体转动起来时。 b.在测速仪的光未对准被测物体的情况之下,一根线条也看不见。
3
当测速仪显示数值为15000rpm时,可以看见5个做记号的线条。 (也就是实际回转数的5倍)
速度检测仪安装使用说明书(新排版)
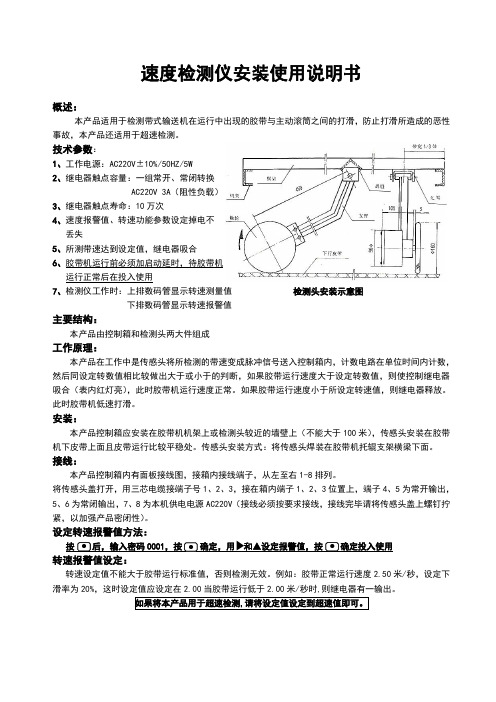
速度检测仪安装使用说明书概述:本产品适用于检测带式输送机在运行中出现的胶带与主动滚筒之间的打滑,防止打滑所造成的恶性事故,本产品还适用于超速检测。
技术参数:1、工作电源:AC220V ±10%/50HZ/5W2、继电器触点容量:一组常开、常闭转换AC220V 3A (阻性负载)3、继电器触点寿命:10万次4、速度报警值、转速功能参数设定掉电不丢失5、所测带速达到设定值,继电器吸合6、胶带机运行前必须加启动延时,待胶带机运行正常后在投入使用7、检测仪工作时:上排数码管显示转速测量值 检测头安装示意图 下排数码管显示转速报警值主要结构:本产品由控制箱和检测头两大件组成工作原理:本产品在工作中是传感头将所检测的带速变成脉冲信号送入控制箱内,计数电路在单位时间内计数,然后同设定转数值相比较做出大于或小于的判断,如果胶带运行速度大于设定转数值,则使控制继电器吸合(表内红灯亮),此时胶带机运行速度正常。
如果胶带运行速度小于所设定转速值,则继电器释放。
此时胶带机低速打滑。
安装:本产品控制箱应安装在胶带机机架上或检测头较近的墙壁上(不能大于100米),传感头安装在胶带机下皮带上面且皮带运行比较平稳处。
传感头安装方式:将传感头焊装在胶带机托辊支架横梁下面。
接线:本产品控制箱内有面板接线图,接箱内接线端子,从左至右1-8排列。
将传感头盖打开,用三芯电缆接端子号1、2、3,接在箱内端子1、2、3位置上,端子4、5为常开输出,5、6为常闭输出,7、8为本机供电电源AC220V (接线必须按要求接线,接线完毕请将传感头盖上螺钉拧紧,以加强产品密闭性)。
设定转速报警值方法: 按 后,输入密码0001,按 确定,用 和▲设定报警值,按 确定投入使用转速报警值设定:转速设定值不能大于胶带运行标准值,否则检测无效。
例如:胶带正常运行速度2.50米/秒,设定下滑率为20%,这时设定值应设定在2.00当胶带运行低于2.00米/秒时,则继电器有一输出。
速度检测仪安全操作及保养规程

速度检测仪安全操作及保养规程随着社会的发展和交通工具的日益普及,道路交通安全成为了人们关注的焦点,严格打击超速现象也成为了治理交通安全的重要措施之一。
速度检测仪作为交警查处超速的重要工具之一,在工作中扮演着重要的角色。
本文将介绍速度检测仪的安全操作以及保养规程。
一、安全操作规程1. 确保设备正常在使用速度检测仪前,必须先检查设备是否正常运行。
具体操作如下:•检查充电电池是否充足,如果电池电量不足,必须先充电再使用•检查测速仪的触发器是否灵敏,若发现问题,请先对触发器进行调整•检查仪器的显示屏是否正常,如发现屏幕出现故障,应先排除故障再使用2. 选择合适的位置在使用速度检测仪时,必须选择合适的位置,如:•停在安全区域内,不得停在主干道上或人流密集区域内•设置稳定的基础为仪器提供足够的支持•与车辆保持一定的距离,在保证个人安全的前提下,确保设备使用的准确性3. 进行标准化操作一定要按照标准化操作程序进行检测。
注意事项如下:•操作前,必须阅读并熟悉使用速度检测仪的使用手册•操作前,必须保证测速仪触发器灵敏度是根据指南进行调整的•操作中,如有疑问或遇到问题,请及时与相关人员沟通4. 安全操作在进行测速时,必须进行安全操作:•驾驶员必须按照规定行驶•测速员必须将测速仪放置于稳定位置•在测速时必须保证测速仪的视线没有遮挡,尽可能的避免光线或其他影响测速精度的干扰•在进行车辆追逐时,要注意安全,不要过度追击二、保养规程为保持速度检测仪的使用性能,我们需要定期进行保养。
下面是保养规程:1. 定期清洁速度检测仪在使用过程中,因为环境和天气的影响,可能会存在污渍和灰尘等脏物,定期清洁是保持仪器使用性能的必要条件。
清洁时需要注意以下事项:•清洁时请注意防水,一定要确认仪器关闭•清洁时请使用干燥而柔软的布或专门的清洁剂,避免使用不当的清洁液体•清洁时请尽量避免清洗仪器中的触摸屏,如果必须清洗,请注意防水2. 定期校准为了保证速度检测仪的测值准确性,我们需要对仪器进行定期校准,校准周期一般为一年。
微机测速仪使用说明书
大连美天三有电子仪表有限公司Dalian Metern SANYOU Electronic Instrument Co.,Ltd.一、 简介微机测速仪 (V 2.0)Micro TachometerUser’s Manual使用说明书 CSY & MCSMETERN 公司生产的多功能微机测速仪,内置单片机,采用数字中控仪表集成总汇技术结构,是测定转速的智能型仪表。
配用低阻抗高灵敏度非接触磁电式传感器。
该仪表集信号检测、数据处理、数字显示,报警指示,报警控制和变送输出等为一体,广泛用于现场指示,闭环控制、报警控制等场所,应用于电力、冶金、化工、钢铁等行业, 专业配套偶合器、鼓风机等设备。
该系列仪表使用简便、性能稳定、抗干扰能力强,满足UL 标准,工作可靠,是工业生产和实验室各类旋转轴转速测量的专业仪表。
二、主要技术参数1.测量范围: 0~9999 r/min ,0~49999 r/min2.测量精度: 绝对精度2r/min3.变送输出: 4~20mA (或1~5V )4.传感器和测速仪距离:小于200米5.传送距离:小于500米6.供电电源:~220V±10%, 50~60Hz ;功耗:小于6W7.带载能力:小于500欧姆8.使用环境:温度:0~45℃,相对湿度:≤85%9.通信方式:RS-48510.配备XS12JK(XG)磁电式传感器使用11.ZYCMT 系列带有反转监控保护装置(请查阅ZYCMT 系列转速控制仪表说明书)三、 仪表的外形和开口尺寸A :外形尺寸:160×80×160(宽×高×长)金属壳B :外形尺寸:160×80×100(宽×高×长)塑壳四、仪表的安装与使用1、磁电传感器的安装磁电式传感器不需要外供电源,频率响应高,性能稳定。
此示意图不代表反转监测的使用(齿盘等分数可以任意设定)。
雷达测速仪使用说明书

雷达测速仪使用说明书(共2页)--本页仅作为文档封面,使用时请直接删除即可----内页可以根据需求调整合适字体及大小--VELOCITY(10-1911CM)型手持式雷达测速仪简要说明:人类乐忠于速度,但问题是很难去测量它!如今,难题已成为了历史!BUSHNELL最新推出了VELOCITY型性能优越的雷达测速仪!以其外型轻巧、操作简便、迅速受到广大测速爱好者的欢迎。
超大清晰的LCD显示屏,读数清晰方便!享受无穷测速乐趣!操作方法:正确安装电池后,合上电池后盖,轻按显示屏下方电源开关,沿物体运动方向瞄准物体并按下操作键,即时,运动物体的速度便会实时显示在显示屏上面!单位切换:当用户想要进行单位切换时,只需将液晶显示屏下方的电源按钮及仪器下方的发射按钮同时按下,即可进行MPH(英里/小时)于KPH(公里/小时)的单位切换。
测速范围汽车:10-200 英里/小时 (即:16-320公里/小时)高尔夫、网球等:10-110英里/小时(即:16-177公里/小时)测量距离汽车: 0~450米高尔夫、网球等:0~27米精度+/- MPH (+/单位显示:英里/小时(MPH)或公里/小时(KPH)显示:LCD数显尺寸:109x213x512mm注意事项:1. 若雷达与被测的目标在同一方向上,则测试的速度是准确的,由于实际测试过程存在夹角的问题,会产生测试的误差,随着角度的增加,误差也在增大,这种现象被称为余弦效应。
故在测量物体速度时,请尽量与被测物体的运动路线保持一致或者尽量减小发射波路线与运动物体路线间的夹角。
使测量更加精确稳定!2. 原仪器不带电池,用户可自配。
3.电池寿命根据电池性能及使用频率而定。
4.保修条款:所有型号的产品自售出之日起,均享受一年的免费维修服务,但是人为造成的误操作或者使用不当除外。
此外,保修期内的维修,客户需负担产品邮寄到美国总公司的运费,维修之后返回客户所需的邮寄费用由我们承担。
SY-800测速仪使用说明书
SY-800速度监控仪说明书一、概述:SY-800型速度监控仪是新一代智能皮带保护装置,它采用微电脑芯片为核心以及先进的传感方式,实现高水准的皮带打滑监测与报警功能。
是电力、矿山、石油、化工行业的理想选择。
二、功能说明为了适应各种情况,本装置用户可以设置使用参数,如:报警带速,警告带速预置等。
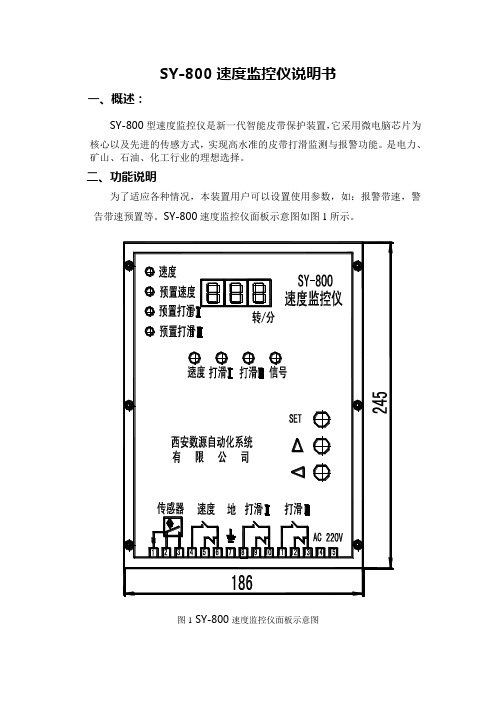
SY-800速度监控仪面板示意图如图1所示。
图1 SY-800速度监控仪面板示意图1.显示区域,采用3位数码显示。
2.指示区域(数码管下部的4只LED),采用LED指示灯报警,其中正常指示为绿色,报警为红色。
另外,有信号指示灯显示传感器信号(绿色)。
3.输入区域,采用三个输入键:设置键,加一键(向上的三角),移位键(向左的三角)。
4.工作状态指示区域(数码管左部的4只红色LED),对应的LED亮,表示速度监控仪工作于相应的状态。
4种工作状态分别是:1)速度,表示此时数码管显示的是皮带测速值;2)预置速度,表示此时数码管显示的是预置速度值;3)预置打滑I,表示此时数码管显示的是预置打滑I值;4) 预置打滑II,表示此时数码管显示的是预置打滑II值。
注意:无论在那种工作状态,速度监控仪都会不间断地监测速度并进行控制。
5.工作状态(1)运行:设备运行后,设备开始检测带速,带速实时显示,当带速下降到警告带速时,LED报警并输出控制信号,如停机等控制等。
(2)设置:在设置过程中,数码管小数点将点亮,小数点并不代表数值,而只是指示当前修改的数位。
设置键:按第一下预置速度指示灯亮,进入预置速度设置;按第二下预置打滑Ⅰ指示灯亮,进入预置打滑Ⅰ设置;按三下预置打滑Ⅱ指示灯亮,进入预置打滑Ⅱ设置;第四下返回速度。
加一键:更改小数点所指示位的数据值。
移位键:将小数点移至所要更改的数据位上。
6.输出:本装置打滑信号的输出,采用继电器节点输出。
各项报警均为一组常开,一组常闭。
采用继电器节点输出,具有可靠性好,触点使用寿命长,利于程控接口。
SE-800说明书
输出与监视器您所使用的 SE-800 设定与应用场合,将决定以何种视讯与音讯装置连接至输出。
如需范例说明,请参阅第 16 页的〈范例应用〉。
虽然 SE-800 的所有输出且有极佳的质量,但请记住,若以递渐方式排列各种格式的视讯质量,则为:SDI (序列数位)、Y.U.V.(模拟色差)、DV 、Y/C (S 视讯)与复合。
音讯输出属于 Line 等级,适合用于连接如扩大器、VCR 或视讯投影机。
监控系统的重要性不需要我们多说。
如果有什么在讯号路径最后阶段(即主输出)听起来或看起来不对,而且如果您可以精确指出讯号路径的问题所在,就能轻易修正问题。
如果可以监控每一个输入频道的视讯与主输出,将使某些设定大幅受益。
由于前面板的头戴耳机控件目,高质量的头戴耳机让您不需复杂的中间步骤,即可以监听音讯,而且获得的效果比扩大器或喇叭更加精准。
建议您同时采用这两种监听方式,而且透过视讯监视器的喇叭的听取音效,也是很好的办法。
更不用说,如果要输出至录音座,则应该也可以轻松监听装置的输出。
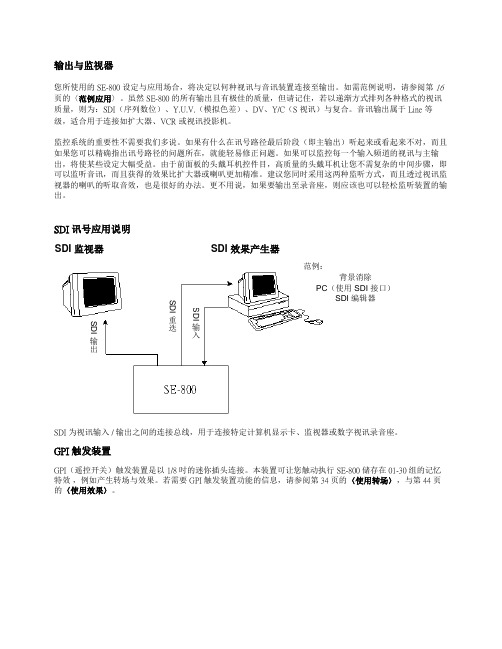
SDI 讯号应用说明SDI 为视讯输入 / 输出之间的连接总线,用于连接特定计算机显示卡、监视器或数字视讯录音座。
GPI 触发装置GPI (遥控开关)触发装置是以 1/8 吋的迷你插头连接。
本装置可让您触动执行 SE-800储存在01-30组的记忆特效 ,例如产生转场与效果。
若需要 GPI 触发装置功能的信息,请参阅第 34 页的〈使用转场〉,与第 44 页的〈使用效果〉。
SDI 监视器SDI 效果产生器SDI输出SDI重迭SDI输入现场表演应用:俱乐部的 VJ/说明会/表演活动…..图标上的文字:这个图示表示俱乐部 VJ 现场活动架设一种方式,也可调整适用于任何表演活动,例如演讲 / 说明会、混合媒体表演,甚至是现场音乐录像带制作。
此处将假设有多个音讯与视讯输入、观众观赏屏幕以及混音同步录制。
如图标连接录像机、输入及监视器装置。
请您:开启所有外围设备的电源,然后再开启 SE-800 的计算机。
多功能表说明书SY800

SY800多功能电测表用户手册SY800 Series Multifunction Power MeterUSER MANUALVersion 1.0上海三樱电气有限公司(中国)HangZhou Weiqidun Technical Electrical Co., Ltd.目录(Content)一、主要特点(MAIN FEATURE) (3)二、功能(FUNCTION) (3)1.测量功能 (3)2.控制功能: (3)3.通讯功能 (4)三、键盘操作和显示(OPE RATION AND DEMONSTRATION) (4)1.面板说明及按键功能 (4)2.运行操作实例(O PERA TION EXAMPLE) (6)四、选型及工作条件(SHAPING AND WORKING CONDITION) (7)1.型号说明(W ORKING CONDITION): (7)2.工作条件(W ORKING CONDITION): (8)五、技术数据(ENGINEERING DATA) (9)1.输入输出(IO) (9)2.电气试验(E LECTR ICAL TES T): (9)六、安装尺寸及端子定义(THE MOUNTING DIMENS IONS AND THE POST DEFINITION) (10)1.安装(I NSTALLMENT) (10)2.端子:(后视图)P OST:(R EAR ELEV A TION) (10)3.端子定义(P OST DEFINITION) (11)七、接线方式(WIRING WAY) (11)1电压输入信号接线(V OLTAGE SIGNAL INPUT WIRING W AY) (11)2电流输入信号接线(E LECTRIC CURRENT SIGNAL INPUT WIRING WA Y) (13)危险和警告本设备只能由专业人士进行安装。
对于因不遵守本手册的说明而引起的故障,厂家将不承担任何责任。
机械测速仪使用方法说明书
机械测速仪使用方法说明书一、前言机械测速仪是一种用于测量物体速度的设备。
它广泛应用于交通管理、工业生产、科学实验等领域。
本使用方法说明书将详细介绍机械测速仪的使用步骤、操作要点及注意事项。
请用户在使用机械测速仪之前仔细阅读本说明书,并按照说明进行操作。
二、产品概述机械测速仪由主体仪器和测速探头组成。
主体仪器包括显示屏、控制按钮和电源接口等。
测速探头通过电缆与主体仪器相连。
机械测速仪采用机械原理进行测速,具有测量精度高、操作简便等特点。
三、使用步骤1. 准备工作将机械测速仪放置在平稳的工作台上,确保仪器稳定不会晃动。
插好电源线并接通电源。
2. 打开主体仪器按下电源按钮,待主体仪器开机完成后,显示屏上将显示当前速度为0。
3. 设置测速范围通过控制按钮选择合适的测速范围。
根据待测速物体的速度范围,选择适宜的范围进行测量。
确保选择的测速范围能够包含待测速物体的实际速度,以获取准确的测速结果。
4. 进行测速将测速探头对准待测速物体。
按下开始按钮,机械测速仪开始工作。
测速过程中,仪器会实时显示物体的速度。
当待测速物体通过测速探头时,仪器将会记录下最近的一次测速结果。
5. 停止测速按下停止按钮,机械测速仪停止测速工作。
此时,仪器将显示最后一次测得的速度,并停止更新。
四、操作要点1. 确保仪器平稳使用机械测速仪时,请将仪器放置在平稳的工作台上,并确保仪器处于稳定状态。
避免仪器晃动对测速结果造成影响。
2. 选择合适测速范围根据待测速物体的速度范围,选择合适的测速范围。
选择过大的范围可能导致精度降低,选择过小的范围可能无法测量到物体的实际速度。
3. 对准测速探头使用机械测速仪时,请确保测速探头与待测速物体保持一定距离,并保持探头的对准。
不良的对准会影响测速结果的准确性。
4. 确定测速时机按下开始按钮后,机械测速仪开始工作。
应在待测速物体经过测速探头时触发开始按钮。
确保测速时机精准。
五、注意事项1. 正确使用电源请使用标准的交流电源,并按照产品规格书中的要求接入正确的电源电压。
【晨光电子】二代测速仪使用说明
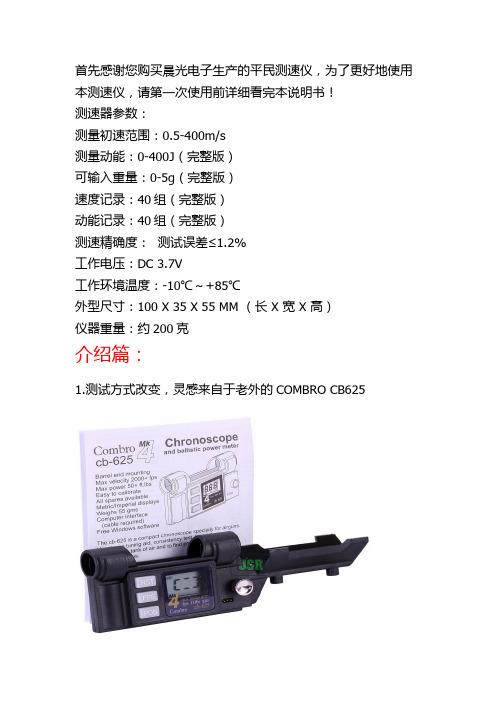
首先感谢您购买晨光电子生产的平民测速仪,为了更好地使用本测速仪,请第一次使用前详细看完本说明书!测速器参数:测量初速范围:0.5-400m/s测量动能:0-400J(完整版)可输入重量:0-5g(完整版)速度记录:40组(完整版)动能记录:40组(完整版)测速精确度:测试误差≤1.2%工作电压:DC 3.7V工作环境温度:-10℃~+85℃外型尺寸:100 X 35 X 55 MM (长 X 宽 X 高)仪器重量:约200克介绍篇:1.测试方式改变,灵感来自于老外的COMBRO CB625当然,外观肯定没有人家那么好,这是我们的二代平民测速仪长*宽*高是10*3.5*5.5cm。
自带一个导轨兼夹具,自带的夹具可以夹持13-23mm外径的圆管,超过23mm的可以用一条橡皮筋绑着固定,也可以用本店定做的U型螺丝固定,如下图:超过23mm时的固定方法,外径最大不得超过35mm。
注:图中U型螺丝为定制版,不是标配,需加5元在本店购买,或者大家也可以直接用一根橡皮筋缠绕绑紧,已有用户测试非常牢固!采用这种测速方法的好处:1.测速精度高。
由于测速仪与设备固定之后,每一次经过的路径都一样,且自带的导轨可以使之与采样板平行,所以测量结果误差小,波动小!1.测速方便。
固定好之后想怎么射就怎么射,再也不用瞄来瞄去,生怕蛋蛋碰到管壁了。
甚至可以一边测速一边校瞄,一举两得!2.体积小,携带和收藏都方便,同时针对大家反映没外壳不好收藏的问题,我们特别定制了一个小纸盒,收纳方便。
2.测量原理改变。
由原来的直插式接收传感器改为最新进口的贴片式传感器,也由原来的串联非隔离信号传输改为并联隔离信号传输,灵敏度更高,测速范围由原来的10-400m/s 变为0.5-400m/s,同时抗干扰性更强,即使其中有一个传感器坏了测速仪仍然能正常工作,故障率大大降低。
3.做工升级,由原来的手工焊接改为专业贴片厂波峰焊,焊接质量更加可靠。
故障率进一步降低。
TP800 realtime PCR仪操作手册
TMSoftwareVersion 1.00 Operation ManualAttention: Thermal Cycler Dice TM Real Time System Single Software Operation Manual should be stored for reference in a secure and accessible location.This document applies to the control and analysis software of the single-wavelength model Thermal Cycler Dice TM Real-Time System Single.单波长<Single-wavelength models>Thermal Cycler Dice TM Real Time System Single MRQ (TaKaRa Code TP870)Thermal Cycler Dice TM Real Time System Single (TaKaRa Code TP850)* For hardware use, refer to the separate user's manual "Hardware Maintenance."* For use of Multiplate RQ software for multi-plate relative quantification, refer to the separate Multiplate RQ user's manual.* The systems below are multi-wavelength models. For software use, refer to the user's manual for the Thermal Cycler Dice TM Real-Time System Software.<Multi-wavelength models>Thermal Cycler Dice TM Real Time System MRQ (TaKaRa Code TP860)Thermal Cycler Dice TM Real Time System (TaKaRa Code TP800)CONTENTS1. Main Parts of the System (4)2. Software Overview2-1. Operation Flow (7)2-2. Startup and Shutdown(1) Startup (8)(2) Shutdown (8)2-3. Layout and Operation of Each Main Screen(1) Initial Screen (9)(2) Plate Setup Screen (10)(3) Thermal Profile Setup Screen (11)(4) Result/Analysis Screen (12)(5) Basic Tools (13)2-4. Initial Settings(1) Registering or deleting a user (16)(2) User Setting (Modifying default settings) (17)(3) Filter Settings (20)2-5. File Operation(1) Creating a New Experiment File (21)(2) Using an Existing Experiment File (21)(3) Experiment File Management (22)3. Performing a Run3-1. Experiment File Settings(1) Creating a New Experiment File (24)(2) Changing the Experiment Type (24)3-2. Set up the PCR Master Mix(1) Preparation of PCR Master Mix (25)(2) Setting up the Plate/Tube (26)3-3. Setting the PCR Conditions(1) Basic Settings (26)(2) Advanced Settings (28)3-4. Run(1) Starting a run (29)(2) Monitoring Run Status (30)(3) Instrument Control during a Run (31)(4) Real Time Results Display (32)(5) Run Completion (33)(6) Run History Verification (33)4. Basic Operations4-1. Plate Document Settings(1) Basic Operations (34)(2) Convenient functions (35)4-2. Basic Operations of Analysis (38)4-3. Changing the Graph Properties (39)5. Absolute Quantification5-1. Plate Document Settings (44)5-2. Analysis(1) Analysis Parameter Settings (46)(2) Analysis Results Display (50)(3) Text Report (52)6. Relative Quantification6-1. Plate Document Settings (54)6-2. Analysis(1) Analysis Parameter Settings (56)(2) Analysis Results Display (56)(3) Text Report (57)7. Plus/Minus Assay7-1. Plate Document Settings (60)7-2. Analysis(1) Analysis Parameter Settings (61)(2) Analysis Results Display (62)(3) Text Report (62)8. Exporting and Printing8-1. Exporting(1) Plate Document and Thermal Profile (64)(2) Graphs (65)(3) Numerical Data (66)(4) Reports (66)8-2. Printing(1) Plate Document and Thermal Profile (67)(2) Graphs (67)(3) Reports (68)9. Hardware Settings9-1. Halogen Lamp(1) Turning the Lamp ON/OFF (69)(2) Lamp Status Verification and Reset after Replacement (69)10. Appendix10-1. Glossary (70)10-2. Troubleshooting (72)10-3. References (75)1. Main Parts of the System[Lid Closed]LED Display AreaPOWER Illuminated when the power switch is in the ON (|) position.Dark when the power switch is in the OFF (O) position. STANDBYBlinks when the halogen lamp and lid are warming up.Illuminated when the halogen lamp and lid have finished warming up. Dark when the equipment is performing a run. RUNIlluminated when a run is being performed.(left and right sides)ON (|), OFF (O)Ventilation Intake(front side)[Lid Open]Ventilation Intake (left and right sides)Power SwitchON (|), OFF (O)(front side)[Back]USBCable ConnectorPowerCable ConnectorVentilation (back)2. Software Overview2-1. Operation FlowSystem Startup1) Start Up the Thermal Cycler Dice™ Real Time System Main UnitTurn the Power Switch at the bottom right of the front panel to ON.2) Start up Computer3) Launch the SoftwareDouble-click the shortcut icon on the desktop to launch the software.Setup of Experiment Files and the Reaction Plate/Tube4) Create a New Experiment FileSelect New from the File menu and set the Experiment Type andOperator Name.5) Prepare the PCR Master Mix6) Set the Plate/TubeLift the handle of the main unit and set the plate or tube on thesample block.Setup of PCR Conditions and Starting a Run7) Set up the PCR ConditionsSet up the PCR conditions in the Thermal Profile Setup screen.8) Perform a RunClick the Start Run button in the Thermal Profile Setup screen.9) Real Time Monitoring of the Fluorescence DataFluorescence data is displayed in the Result/Analysis screen in realtime.Sample Information setting and Data Analysis10) Set up Plate DocumentEnter the sample information in the Plate Setup screen.11) Data AnalysisSet the baseline, threshold level, and other parameters and performanalysis.12) Analysis Results OutputSystem Shutdown13) Software Termination14) Computer Shutdown15) Shutdown of the Main UnitTurn the Power Switch at the bottom right of the front panel to OFF.2-2. Startup and Shutdown(1)Startupa. Verify that the Thermal Cycler Dice™ Real Time System Single main unit is connected to the computer by the USB cable.b. Turn the power switch at the lower right of the front panel to the ON (|) position.[Note] Turning the power ON for the main unit turns the halogen lamp on at the same time. Allow the machine to warm up for about 15 minutes, until the intensity of the lamp light stabilizes. Then allow the lidheater to warm up until the temperature is greater than 105ºC. The STANDBY indicator blinks whilethe machine is warming up. When both the halogen lamp and the lid heater have finished warming up,the indicator is steadily illuminated, and the equipment may then be used.c. Next, turn the computer power ON.d. Once the computer has completed its start up sequence, double-click theThermal Cycler Dice™Real Time System Single software icon on thedesktop.[Note] The software can also be launched by clicking on the start menu at the lower left of the screen and selecting [Program] > [TaKaRa Thermal Cycler Dice] > [Thermal CyclerDice™ Real Time System TP850].e. The splash screen shown at right is displayed, andthe software launches.f. The software initial screen is displayed.[Note] The connection status can be verified by checking instrument status (right port) in the status bar at the bottom of the screen. If properly connected, then “Connected” will be displayed. If not connected, or if the main unit power is OFF, then “Disconnected” is displayed.(2) Shutdowna. Select Exit from the File menu of the software to terminate the software.b. Select Turn off Computer from the start menu at the bottom left of the screen.c. The shutdown screen is displayed.d. Click Turn Off to shut down the computer.e. Turn the power switch of the Thermal Cycler Dice™ Real Time System Single main unit to theOFF (O) position.2-3. Layout and Operation of Each Main Screen(1) Initial ScreenThe initial screen is displayed when the Thermal Cycler Dice™ Real Time System Single software is launched. This is where the initial software options are set.[Initial Screen Display Method]o The Initial Screen is displayed when the Thermal Cycler Dice™ Real Time System Single software is launched.o When the Thermal Cycler Dice™ Real Time System Single software is in use, closing all open experiment files brings the system back to the initial screen.[Main Operations Performed from the Initial Screen]o Create new experiment files.o Open existing experiment files.o Manage experiment files with the Data Manager.o Verify the ON/OFF status and the hours of usage of the halogen lamp in the main unit, or reset the remaining hours of usage after a bulb has been replaced.o Optically calibrate using calibration plate.o Carry out the thermal cycler (main equipment) self-diagnostic function.o Verify the filter set.(2) Plate Setup ScreenThis screen is used for setting the sample information for each well (target name and mark, sample name, sample mark, sample type, etc.).[Plate Setup Screen Display Method]o The Plate Setup screen is displayed when a new experiment file is created or when an existing experiment file is opened.o If switching from another screen, click the Plate Setup button in the area on the left of the screen (the Side Area), or select [Section] > [Plate Setup] from the menu bar.[Main Operations Performed from the Plate Setup Screen]o Set and verify sample information for each well. Set the fluorescence filter to be measured and sample information, or load settings from existing experiment files. Editing can be performed before the run is executed, during execution, or after execution. Sample information that has been set is displayed in each well of the Plate Document.o Save and print the Plate Setup screen as a figure or in report format.o In addition to the above, almost all operations that can be performed from the initial screen can also be performed from this screen.(3)Thermal Profile Setup ScreenThe Thermal Profile Setup screen is for setting the PCR conditions and selecting the fluorescence filter for measuring. It is also possible to start a run from this screen.[Thermal Profile Setup Screen Display Method]o Click the Thermal Profile Setup button in the side area, or select [Section] > [Thermal Profile Setup] from the menu bar.[Main Operations Performed from the Thermal Profile Setup Screen]o Set PCR conditions.o Start a run and control instrument during a run. A run in progress can also be paused (and restarted) or forcibly terminated.o Monitor the progress and status of a run.o Save and print the Thermal Profile screen as a figure or in report format.o In addition to the above, almost all operations that can be performed from the initial screen can also be performed from this screen.(4) Result/Analysis ScreenUsing the Result/Analysis screen, data for the current run can be monitored in real time. After completion of the run, the measured data is analyzed and the results are displayed.[Result/Analysis Screen Display Method]o Click the Result/Analysis button in the side area, or select [Section] > [Result/Analysis] from the menu bar.[Main Operations Performed from the Result/Analysis Screen]o Display real time data during the run.o Set analysis parameters and perform analysis after the run is executed.o Display Amplification Plots and calculate Ct values (Threshold Cycle).o Display the Standard Curve and quantify unknown samples.o Calculate the Relative Quantification value and display the graph (if Relative Quantification is used).o Display the Dissociation Curve and calculate Tm values.o Save and print the measured values, analysis results, analysis settings etc. in graph or report format.o In addition to the above, almost all operations that can be performed from the initial screen can also be performed from this screen.(5) Basic ToolsThe basic tools are commonly used tools available on each screen, including the menu bar, the toolbar, the status bar, and the side area.[Menu Bar]Every command can be performed by making a selection from a menu.Menu Bar ContentsNew Create a new experiment file Open Open an existing experiment fileClose Close an experiment file that is openData Manager Display the Data Manager Screen for experiment file Save Save by overwriting the existing experiment file Save As Save by assigning a user-defined name Load Template Load an existing file as a templateMake Full Report Output a report and exports data and graphs Print Print reportFileExitTerminate the Thermal Cycler Dice Real Time Software Copy Copy the contents of the selected area Paste Paste copied contents Undo Cancel the previous operationEditRedoRe-perform an action that has been cancelled by Undo Plate Setup Display the Plate Setup ScreenThermal Setup Display the Thermal Profile Setup Screen SectionResult/AnalysisDisplay the Result/Analysis Screen Data ProfileDisplay the Data Profile windowAnalysis Data Selection Display the Analysis Data Selection window AnalysisSmoothingDisplay the Smoothing Setting window Start Start a runAdd Cycle Add cycles during a run Pause Pause a run in progress Restart Restart a run that is paused Instrument RunSkip to NextSkip to the next PatternMenu bar, Tool barSide areaStatus barStopForcibly terminate a runLamp On Turn ON the Halogen Lamp of the main unitLamp Off Turn OFF the Halogen Lamp of the main unitLamp Status Display Halogen Lamp usage time and reset timer after lamp has been replacedMaster Data Filter information settings and additional filter settings Filter Set Localized Set Filter information for the file under analysis Optical Display the Optical Calibration ScreenCalibrateThermalMaintenance Mode (not used)DiagnosisSelf-diagnostic function for Thermal Cycler Dice Real Time main unitChange Change a user Setting Display the User Setting screen UserManagementDisplay the User Management screenCascade Display multiple experiment files in cascade view Tile Horizontal Display multiple experiment files tiled horizontally Tile Vertical Display multiple experiment files tiled vertically Window < Experiment File >Switch the display between experiment files Help Display HelpHelp AboutDisplay version Information[Toolbar]Commands are executed by clicking on the icons.[Status Bar]The Status Bar displays the following information.aRun StatusDisplays the filename of the run in progressLamp Displays the state of the Halogen Lamp of the main unit (ON/OFF) b LampStatusTotal TimeDisplays the hours of usage of the Halogen Lamp in the main unita New ExperimentCreates a new experiment file b Open Experiment Opens an existing experiment filec Save Experiment Specifies a name to a new experiment file and saves it, or overwrites the existingfiled Print Experiment Prints a report after setting options on the Report Setting Screen e Copy Copies the contents of the selected area f Paste Pastes the copied contentsg Undo Cancels the previous operationh Redo Returns to the state pertaining before the Undo operation was performed i Zoom In Enlarges the Results/Analysis Screen graph selection area j Zoom Out Returns to the state before enlargement via the Zoom In operation kLamp On/OffShows whether the Halogen Lamp is ON/OFF l HelpDisplays Helpa b c d e f g h i j k la bc deLidDisplays the status of the main unit Lid (Open/Close)c Lid Status TemperatureDisplays the temperature of the Lid (Units: ºC) d Instrument Status Displays the connection status of the PC to the main unit(Connected/Disconnected)eCamera StatusDisplays the connection status of the camera to the main unit (Connected/Disconnected)[Side Area]The side area displays the following buttons and information. Options e~h are displayed when a run is in progress.aPlate SetupPlate Setup Screen displayb Thermal Profile Setup Thermal Profile Setup Screen displayc Result/Analysis Result/Analysis Screen display Constant DisplaydNoteNote input and displayRemaining Time Remaining time until run completion Lid Temperature Current Lid temperature display eTime/TemperatureBlock TemperatureCurrent Block temperature display Pattern Number of the pattern in progress Segment Number of the segment in progress fRunning PointCycleNumber of the cycle in progress Add Cycle Adds a cycles during a run Pause Pauses a run Restart Restarts a paused run Skip to Next Skips to next pattern gInstrument ControlStopForcibly terminates a runRun inProgresshTurn lamp off after runWhen checked, the Halogen Lamp is turned OFF after the run.a efghb cd2-4. Initial Settings(1) Registering or deleting a userThermal Cycler Dice TM Real-Time System Single users can be registered or deleted. User registration is not essential. However, a registered user can manage each experiment file as its creator (operator) or change the default settings of analytical parameters or graph display for the user.[Registration of User Name]Register a Thermal Cycler Dice TM Real-Time System user as follows:a. Select Management from the User menu to displaythe User Management screen.b. Click the New button for the input of a user name andnotes.c. After entering a user name and notes, click the Addbutton.d. After confirming that the name and note are displayedon the lists, click the OK button.[Deletion of User Name]a. Select Management from the User menu to display the User Management screen.b. Select a user name to delete from the list, and click the Delete button.c. After confirming that the name and notes are no longer displayed on the list, click the OK button. [Selection of Operator and User]‘Operator’ refers to the creator that is set when new experiment files are created. Once set, the operator cannot be changed. ‘User’ refers to the experiment file user, which can be changed at any time. If the user of an experiment file is changed, analyses and graph displays are performed according to the unique settings of the user.[Selecting an operator]a. Select New from the File menu to display the NewExperiment Options screen.b. From the Operator Name list, select an operatorand click the OK button.[Selecting a user]By default, the name of the experiment file operator is set as the user name.When necessary, the name can be changed.a. Select Change from the User menu.b. Select a target user name.(2) User Setting (Modifying default settings)Various default settings (analytical parameters, graph display method, etc.) can be modified and saved for each user. This is done on the User Setting screen.[Displaying the User Setting screen]Display the User Setting screen by either of the following methods:[From the New Experiment Options screen]a. Select New from the File menu to display the New Experiment Options screen.b. Click the Edit button on the New Experiment Options screen to display the User Management screen.c. Double-click a target user for selection.[From the Management menu]a. Select Management from the User menu to display the User Management screen.b. Double-click a target user for selection.[From an experiment file]a. Select the experiment file where the user is set.b. Select Settings from the Usermenu.Double-click[Modifying and saving default settings]The User Setting screen has five tabs. Change screens by clicking these tabs. After modifying settings, click the OK button to update the settings. If the Cancel button is clicked, the settings are not updated. Clicking the Reset button restores the default settings of the software. [Analysis]Set analytical items on this screen.For details about each item, see 5-2 (1) and 7-2 (1).[Full Report/Print]Set report output and printing items on this screen.For details about each item, see 8-1 (4).[Chart Properties]Set graph display items on this screen.For details about each item, see 4-3.[Text Report]Set text report display items on this screen.For details about each item, see 5-2 (3), 6-2 (3), and 7-2 (3)[Lamp]Set "Turn lamp off after run" on this screen. This setting becomes valid from the next setting. For details about this function, see 3-4 (3).(3) Filter SettingsOne type of filter (FAM™/SYBR® Green I) is installed in the Thermal Cycler Dice™ Real Time System Single.[Master Data Settings]The master data settings are applied to all experiment files.a. Make sure the initial screen is displayed.b. Select [Instrument] > [Filter Set] > [Master]from the menu bar. The Filter Setting window isdisplayed.c. Select FAM from the Use Filter drop-down list.d. Double-click FAM in the filter list to open theFilter Editor window.e. Select the name of the fluorescent dye from theDye Name drop-down list.Filter Name: Name of the filter (fixed).Dye Name: Name of the fluorescent dye used fordetection (can be selected from list).f. Optional colors can be selected by clickingDisplay Color.g. Click OK. The altered filter information isdisplayed in Filter Info.2-5. File Operation(1) Creating a New Experiment FileCreate a new experiment file to perform a run. Select [File] > [New] from the menu bar. The New Experiment Options window is displayed. After setting experiment type and operator name, click the OK button. A new experiment file is opened. (Refer to section 3-1.)(2) Using an Existing Experiment FileIt is possible to open and operate multiple files at the same time. While a run is in progress for one file, a different file may also be open for changing file settings and data analysis.[Opening a File]o Select [File] > [Open] from the menu bar or click the Open icon in the toolbar.Select the file to be opened in the Open window.o Select [File] > [Data Manager] from the menu bar. The Data Manager window is displayed.Select a file and click the Open button.o The file can also be opened by double-clicking on its file icon, by dragging and dropping the file icon into the Thermal Cycle Dice™ Real Time SystemSingle software screen, or by dragging and dropping thefile icon onto the Thermal Cycle Dice™ Real Time SystemSingle software icon.[Switching Between Multiple Files and Simultaneous Display]o Selecting [Window] > [File Name] from the menu bar causes the selected file to be displayed in the window on top.o Multiple files can also be displayed simultaneously on the same screen in three different ways: side by side horizontally, above and below vertically, and in a cascading fashion where thewindows for each file are overlapping, but the edge of each is visible and may be selected to bring that file to the front. From the menu bar, select [Window] > [Tile Horizontal],[Window] > [Tile Vertical], or [Window] > [Cascade] as appropriate.[Executing Operations in an Existing File]o Data analysis, display, output, and other operations can be performed from the Result/Analysis screen, and settings and sample information can be changed from the Plate Setup screen.o Sample information and settings for an existing file may be changed and data analysis and other operations can be performed while a run is in progress for a new experiment file in thebackground. However, operations on the main unit, such as turning the halogen lamp OFF,cannot be performed.o The PCR reaction conditions can be verified from the Thermal Profile Setup screen after a run is complete, but they cannot be changed. Also, a new run cannot be performed for the same file.Every time a run is performed, a new experiment file is created.[Saving Files]o To overwrite a file, select [File] > [Save] from the menu bar.o To save a file with a different file name, select [File] > [Save as] from the menu bar. The Save window is displayed. Select the destination folder, assign a file name, and save.o A confirmation message is displayed if a file with the same name already exists.[Closing Files]o Select [File] > [Close] from the menu bar, or click the button in the upper right corner.o If the experiment file has not been saved, a confirmation message is displayed asking whether or not to save the file.o The confirmation message is also displayed if changes have been made to an existing experiment file. Selecting Yes will save by overwriting the old file. Selecting No will close the file without saving any changes. If Cancel is selected, the file will not close.(3) Experiment File ManagementUsing the Data Manager, it is possible to search for saved experiment files, verify file information, and change the destination folder for saving.[Experiment File Search and File Information Verification]a. Select Data Manager from the File menu. The Data Manager window is displayed.b. Select the folder to be searched from the tree view.c. Verify the folder in the search path and click the Search button.Check the search subfolder box if subfolders are also to be searched.d. The search results are displayed in the file list.e. Click the experiment type, operator name, or file name columns to sort the file lists according toone type of information. Clicking again causes the sorting order to switch from ascending to descending or vice versa. Click the Renew button to restore the original order.f. If a refined search is necessary, select the items to be refined from the experiment type or operatorname combo box.g. Selecting a file from the file list displays the information for the file at the bottom.File Path Displays the experiment file pathFrom File Path Displays the folder path before the file is movedExperiment Type Displays Experiment TypeOperator Name Displays Operator NameCreate Time Displays the date and time the file was createdUpdate Time Displays the date and time the file was last updatedNote Displays memos entered in Notesh. Click the Open button to open the selected experiment file.[Note] When the Data Manager window is opened with a new experiment file, the Load as Template buttons is displayed. Clicking the Load as Template button causes the Plate Setup and Thermal Profile Setup information for the selected file to be read into the new experiment file.[Changing the Save Destination Folder for Saving]a. Select an experiment file from the file list and drag it to the desired folder in the tree view.b. After the file is moved, the current path is displayed in file path and the former path is displayed in from file path.c. Click the Renew button to update the display.3. Performing a Run3-1. Experiment File Settings(1) Creating a New Experiment FileCreate a new experiment file to perform a run.a. Select New from the File menu.b. The New Experiment Options window isdisplayed.c. Select an Experiment Type.Absolute Quantification: Performs absolute quantification using a standard sample for which the absolute quantity is known.Relative Quantification: Performs a comparison of expression levels between samples. This method is mainly used for a gene expression analysis.Plus/Minus Assay: Plus/minus judgments are done for the target and the internal control respectively. Those results are combined to make an integrated judgment of Plus/Minus for the unknown sample.d. Select an operator in the Operator Name field.[Note] If the operator name is not registered, register a new operator name in the Management Operator window, and then select the name after it has been registered (Refer to 2-4).e. Click the OK button when the settings are complete.(2) Changing the Experiment TypeNormally the experiment type is set when a newexperiment file is created, but the settings can be changedafterwards, if necessary. They can be changed at any timeexcept when a run is being performed, but some of thesettings must be changed in the Plate Setup screen.a.Select [Analysis] > [Data Profile] from the menu bar.The Data Profile window is displayed.b.Click the Edit button to allow changes to theexperiment type.c.Set the experiment type and data polarity.[Note] Selecting "-" from the Data Polarity menu causes sign inversion of the fluorescence value. This setting is used for the detection method in which the fluorescence value decreases as the amount of the PCRsubstance increases.d.Click the OK button after the settings are complete.。
测速仪使用说明(二)
测速仪使用说明(二)
测速仪使用说明
一、什么是测速仪
测速仪,又称速度测量仪器,是一种专门用于测量物体运动速度
的仪器设备。
它通常由传感器、处理器和显示器组成,并具备不同的
测量方式和功能。
二、测速仪的基本操作
使用测速仪需要按照以下步骤进行:
1.安装电池:检查测速仪是否需要电池来供电,如果需要,请按照
说明书上的指引安装电池。
2.开关机:打开测速仪的电源开关,等待仪器启动完成。
3.选择测量模式:根据需要选择测速仪的测量模式,如速度测量模
式、距离测量模式等。
4.设置测量参数:根据具体需求,设置测量仪的参数,如单位选择、
精度设置等。
5.对准目标:将测速仪对准测量对象,确保传感器能够准确读取目
标的速度。
6.启动测量:按下测速仪上的测量按钮或触摸屏按钮,开始进行测
量。
7.记录测量结果:根据显示屏上的测量结果,记录下相应的数据。
三、注意事项
在使用测速仪时,请务必注意以下事项:
•操作规范:请按照说明书的指引正确操作测速仪,避免因操作不当导致的数据错误或设备损坏。
•环境适应:确保测速仪工作在合适的环境条件下,避免高温、低温、潮湿等极端环境对测量结果的影响。
•传感器检查:在每次使用测速仪之前,请检查传感器是否完好,并清洁传感器表面,以保证准确的测量。
•电池管理:合理使用和管理电池,及时更换电池以免影响测速仪的正常使用。
•储存与维护:妥善保管测速仪,定期进行仪器校准和维护,确保其长时间稳定可靠地工作。
以上即是测速仪使用说明,希望能帮助您正确高效地使用测速仪。
皮带测速仪产品使用说明(通用)
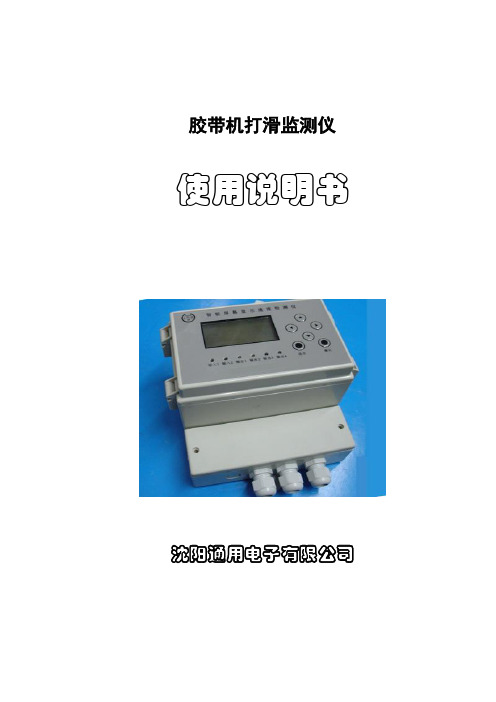
胶带机打滑监测仪使用说明书沈阳通用电子有限公司一、概述本产品适用于矿山、冶金、电力、码头等有带式输送机或旋转设备场合使用。
用于时实监测带速或转速的变化具有报警和信号远传功能。
本产品采用液晶点阵显示,显示信息内容丰富直观有利于现场观测和维护。
具有远程RS485通讯和4-20mA电流量输出方式,方便的和其他设备相联接,便于在系统中使用。
本产品采用功能强大的ARM32位单片机作为中央处理器,具有运算速度快、集成度高、维护简单故障率小、抗干扰等特点。
本产品综合了多种速度检测器的功能,在使用性能上相当完善。
工作参数通过键盘设置,使用维护方便,设置的工作参数永久保存,不怕掉电,是自动化控制系统中理想的一次检测仪表设备。
二、特点:本产品是综合了其他同类产品的优点,具有强大的优势。
在功能上有以下特点。
1、信号输出方式:有三种信号输出方式:A、RS485远程通讯接口B、4-20mA信号电流量输出接口C、4组继电器输出接口因为有灵活的输出选择所以更容易使用。
可以就地产生报警信号信号和远程传输信号。
2、信号输入方式有两路信号输入:A、主信号输入B、辅助信号输入因为有主信号输入和辅助信号的输入,所以可以测量物体的绝对和相对的运动。
使用更加灵活方便。
3、显示操作采用滚动菜单方式作为操作,更加有利于参数的设置和查询,显示信息量大,方便用户使用。
4、参数保护功能具有参数设置保护功能,用户可以设置密码来保护系统参数。
可以防止运行参数被误操作更改带来的系统运行错误。
增加了系统的稳定性。
5、输出测试当系统连接好后可以测试与该设备连接的信号。
测试信号输出有开关量测试、电流量测试。
容易判别系统连接的正确性,提供方便准确的测试维护方法。
三、键盘说明:该产品的键盘布局如下图所示,键盘由六个按键组成。
分别由上、下、左、右、退出和确定键组成。
操作直观方便简单。
按键说明:上、下、左、右按键是选择相应的操作。
退出按键是取消当前的操作或退到上一级菜单操作。
测试仪使用说明书
测试仪使用说明书转辙机综合测试仪使用说明书一、开机/关机1.开机按下键并保持2-3s后,仪器开机并开始初始化自检,自检期间蜂鸣器鸣响。
初始化完毕后进入主菜单,蜂鸣器停止鸣响,进入主菜单开机完毕。
主菜单显示当前存储器通道号、当前道岔号、当前日期、时钟及电池电量。
2.关机在任意状态下,按下键后仪器即时关机,关机后关闭所有电源。
并将部分设定内容存储。
二、设定内容及操作方法1.显示液晶对比度当显示液晶受温度、光照等因数造成显示不清时,你可以通过设置液晶的显示对比度进行修正。
在主菜单下按键及键可调整液晶的显示对比度。
设定内容可自动保存。
2.显示液晶辅助背光开关当使用环境的光线不足、能见度较低,你可以开关液晶的辅助背光。
在主菜单下按键及键可开关液晶的辅助背光。
设定不可保存。
3.修改当前通道在自动、手动、显示等菜单中按键及键可改变当前的默认存储通道。
4.设置菜单在主菜单下按键后进入设置菜单,你可以在此菜单中修改道岔号、当前时钟、打印数据间隔。
1)改变当前的道岔号在设置菜单中选择1进入。
显示当前的道岔号,随光标位置输入新的道岔号后按确定完成修改。
2)调整日期、时钟在设置菜单中选择2开始进行调整。
随光标位置输入新的日期、时间后按确定完成修改。
3)修改打印数据间隔在设置菜单中选择3进行修改。
首先显示的是当前的打印数键或键来进行修改,设定范围为0.15s – 0.9s,设定间隔为 0.15s。
三、电池充电当电池电量降至30 %时,仪器的蜂鸣器鸣响,电池欠电报警,请立即停止使用,并请及时充电。
当可能较长时间不用时,请带电保存。
并请每3个月充电一次。
电池的充电时间为12-16 小时。
四、连接、联线请将综合测试线的电压测试线并接在转辙机电机电源线的任意两相上。
请将综合测试线的电流测试线串接在转辙机电源线的回路中。
请将综合测试线的时间测试线接在转辙机到位闭合的一组备用接点上。
请将拉力传感器替换转辙机与安装装置的连接销后用联线与仪器连接。
SpeedFlow速度测量仪器用户操作指南说明书
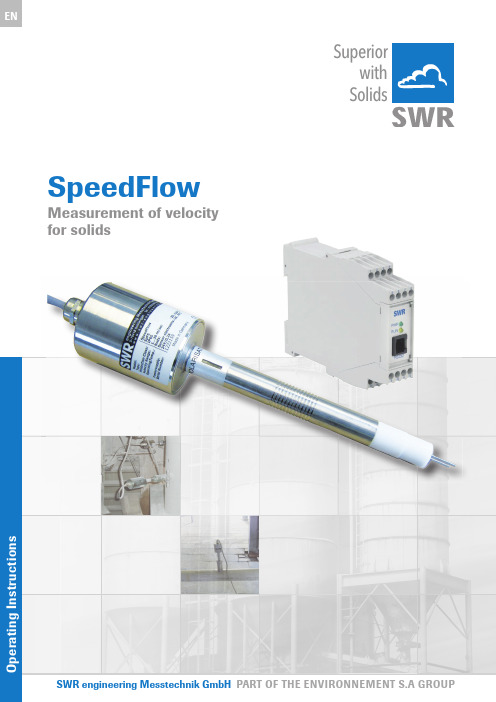
SpeedFlowMeasurement of velocityfor solidsSuperior with SolidsCONTENTS Page 1. System overview . . . . . . . . . . . . . . . . . . . . . . . . . . . . . . . . . . . . . . . . . . . . . . . . . . . . . . . . . . . . . . . . . . . . . . . 31.1 Using the optional C1-box . . . . . . . . . . . . . . . . . . . . . . . . . . . . . . . . . . . . . . . . . . . . . . . . . . . . . . . . . . . 32. Function . . . . . . . . . . . . . . . . . . . . . . . . . . . . . . . . . . . . . . . . . . . . . . . . . . . . . . . . . . . . . . . . . . . . . . . . . . . . . . 43. Safety . . . . . . . . . . . . . . . . . . . . . . . . . . . . . . . . . . . . . . . . . . . . . . . . . . . . . . . . . . .. . . . . . . . . . . . . . . . . . . . . 5Normal use . . . . . . . . . . . . . . . . . . . . . . . . . . . . . . . . . . . . . . . . . . . . . . . . . . . . . . . . . . . . . . . . . . . . . . . . 5 3.1Identification of hazards . . . . . . . . . . . . . . . . . . . . . . . . . . . . . . . . . . . . . . . . . . . . . . . . . . . . . . . . . . . . . 5 3.2Operational safety . . . . . . . . . . . . . . . . . . . . . . . . . . . . . . . . . . . . . . . . . . . . . . . . . . . . . . . . . . . . . . . . . . 5 3.3Technical statement . . . . . . . . . . . . . . . . . . . . . . . . . . . . . . . . . . . . . . . . . . . . . . . . . . . . . . . . . . . . . . . . 53.44. Mounting and installation . . . . . . . . . . . . . . . . . . . . . . . . . . . . . . . . . . . . . . . . . . . . . . . . . . . . . . . . . . . . . . . 6Supplied equipment . . . . . . . . . . . . . . . . . . . . . . . . . . . . . . . . . . . . . . . . . . . . . . . . . . . . . . . . . . . . . . . . 6 4.1Required tools . . . . . . . . . . . . . . . . . . . . . . . . . . . . . . . . . . . . . . . . . . . . . . . . . . . . . . . . . . . . . . . . . . . . . 6 4.2Mounting of the sensor . . . . . . . . . . . . . . . . . . . . . . . . . . . . . . . . . . . . . . . . . . . . . . . . . . . . . . . . . . . . . 6 4.3Mounting of the transmitter . . . . . . . . . . . . . . . . . . . . . . . . . . . . . . . . . . . . . . . . . . . . . . . . . . . . . . . . . 94.45. Electrical connection . . . . . . . . . . . . . . . . . . . . . . . . . . . . . . . . . . . . . . . . . . . . . . . . . . . . . . . . . . . . . . . . . . 106. Commissioning . . . . . . . . . . . . . . . . . . . . . . . . . . . . . . . . . . . . . . . . . . . . . . . . . . . . . . . . . . . . . . . . . . . . . . . 117. Menu structure of the SpeedFlow configuration program . . . . . . . . . . . . . . . . . . . . . . . . . . . . . . . . . . 128. System settings in detail . . . . . . . . . . . . . . . . . . . . . . . . . . . . . . . . . . . . . . . . . . . . . . . . . . . . . . . . . . . . . . . 139. Brief description of the PC operating software . . . . . . . . . . . . . . . . . . . . . . . . . . . . . . . . . . . . . . . . . . . . 15DRC tab . . . . . . . . . . . . . . . . . . . . . . . . . . . . . . . . . . . . . . . . . . . . . . . . . . . . . . . . . . . . . . . . . . . . . . . . . 15 9.1System tab . . . . . . . . . . . . . . . . . . . . . . . . . . . . . . . . . . . . . . . . . . . . . . . . . . . . . . . . . . . . . . . . . . . . . . . 16 9.29.3List tab . . . . . . . . . . . . . . . . . . . . . . . . . . . . . . . . . . . . . . . . . . . . . . . . . . . . . . . . . . . . . . . . . . . . . . . . . . 17Trend tab . . . . . . . . . . . . . . . . . . . . . . . . . . . . . . . . . . . . . . . . . . . . . . . . . . . . . . . . . . . . . . . . . . . . . . . . . 18 9.4Sensor tab . . . . . . . . . . . . . . . . . . . . . . . . . . . . . . . . . . . . . . . . . . . . . . . . . . . . . . . . . . . . . . . . . . . . . . . .189.510. Maintenance . . . . . . . . . . . . . . . . . . . . . . . . . . . . . . . . . . . . . . . . . . . . . . . . . . . . . . . . . . . . . . . . . . . . . . . . . 1911. Warranty . . . . . . . . . . . . . . . . . . . . . . . . . . . . . . . . . . . . . . . . . . . . . . . . . . . . . . . . . . . . . . . . . . . . . . . . . . . . . 1912. Troubleshooting . . . . . . . . . . . . . . . . . . . . . . . . . . . . . . . . . . . . . . . . . . . . . . . . . . . . . . . . . . . . . . . . . . . . . . 1913. Technical data . . . . . . . . . . . . . . . . . . . . . . . . . . . . . . . . . . . . . . . . . . . . . . . . . . . . . . . . . . . . . . . . . . . . . . . . 201. System overviewA complete measurement point consists of the following components:•Transmitter in DIN rail housing•Sensor accommodation for welding to the pipeline•Sensor (union nut, distance washer, sealing ring for adjusting to the wall thickness)•Operating instructions•C1-box (optional)The measuring sensor is connected to the transmitter using a shielded 4-wired cable with the length of the cable not exceeding 300 m.1.1 Using the optional C1-boxThe C1-box is a terminal block with a fuse and terminal resistor for connecting longer bus and supply lines.2. Function•The SpeedFlow is a measuring system which has been specially developed for measuring the speed of solids being transported.•The sensor uses the triboelectric effect. It is only used in metallic pipelines.•The electrodes fitted in the pipeline receive an electrical pulse from the solid particles as they pass.The received signals are evaluated using an auto-correlation process which thus calculates the speed.• A measurement point generally consists of the sensor, C1-box and the transmitter.Fig. 2: SpeedFlow sensor in the pipeline3. SafetyThe SpeedFlow measuring system has a state of the art, reliable design and and has been tested and found to be in a perfectly safe condition when it left the factory. Nevertheless the system components may present dangers to personnel and items if they are not operated correctly.The operating instructions can therefore be read in full and the safety instructions followed to the letter.If the device is not used correctly for its intended purpose the manufacturer's liability and warranty will be void.3.1 Normal use•The measuring system may only be installed in metallic pipes to measure the medium passing through them.It is not suitable for any other use or measuring system modifications.•Only genuine spare parts and accessories from SWR engineering may be used.3.2 Identification of hazards•Possible dangers when using the measuring system are highlighted in the operating instructions using the following symbols:•This symbol is used in the operating instructions to denote actions which, if they are not performed correctly may result in death or injury.Attention!• This symbol is used in the operating instructions to denote actions which may result in danger to property.3.3 Operational safety•The measuring system may only be installed by trained, authorised personnel.•In case of maintenance-work on the pipe or on components of the SpeedFlow sensor, make sure that the piping is in unpressurised condition.•Switch off the power supply before completing any maintenance work, cleaning work or inspections on the pipelines or the SpeedFlow components.•The sensor must be taken out of the pipeline before any welding work.•The components and electrical connections must be inspected for damage at regular intervals. If any signs of damage are found, they must be rectified before the devices are used again.3.4 T echnical statement•The manufacturer reserves the right to adjust technical data to technical development without notice.SWR engineering will be delighted to provide information about what the operating instructions is up to date and any amendments which have been made to it.4. Mounting and installation4.1 Supplied equipment•Transmitter in DIN rail housing•Sensor accommodation for welding to the pipeline•Sensor (union nut, distance washer, sealing ring for adjusting to the wall thickness)•Operating instructions•C1-box4.2 Required tools•Ø 20 mm-twist drill bit•32 mm open-ended spanner for union nut•Pliers for circlips (Ø 20 mm) to adjust the sensor to the wall thickness4.3 Mounting of the sensorProceed as follows to install the sensor:•Decide on the installation position on the pipe. It should be installed from the top on horizontal or angled pipelines.•Weld the sensor accommodation on to the pipe.•Drill through the pipe through the sensor (Ø 20 mm). Ensure that the borehole is not angled so that the sensor can be installed precisely later.Warning!•After drilling it is essential to check whether the drill bit has caused any burr on the borehole edges.Any burr on the pipe must be removed using a suitable tool. If the burr is not removed it may affect the sensor's calibration.•If the sensor is not installed immediately insert a dummy plug until it is installed (see also fig. 4). The dummy plug must be inserted together with the seal, two sealing rings and the circlips for shafts and secured using the union nut. Use a 32 mm open-ended spanner to tighten the union nut.Fig. 4: Installation of the sensoraccommodation and the dummy plug Distance washer 1 mmO-ring-type sealingring 19 x 2Sensor accomodationUnion nutCirclips for shaftsDummy plugqqqqqqq•Remove the dummy plug to insert the sensor.•The sensor is supplied ready-assembled for the specified wall thickness or, if no wall thickness was specified, to a wall thickness of 4 mm. Check again that it is correctly adjusted before installation (see table). If necessary the wall thickness must be remeasured with a depth gauge. The weld-on socket is93 mm long. It is important that the sensor does not project into the pipe. The sensor may be up to1 mm inside the pipe wall without this causing a measurement error.Wall thickness (mm)Position on the sensor neck Number of distance washers3.04.05.56.58.09.010.511.513.014.011223344552121212121•Now the sensor is put into the sensor accommodation and screwed with the union nut according to figure 5a.Fig. 5a: Installation of sensor accommodation and sensorSensor accommodationO-ring-type sealing ring 19 x 2Distance washer 1 mm Circlip for shafts 20 x 1.2Distance washer 1 mm Union nut Sensorqqqqq qq12 • and align it longitudinally to the pipe axis as marked on the sticker (Fig. 5b). The two sensor-rods must beinline with the flow. Then seal the measurement point with the union nut.Fig. 5b: Sensor alignment▼Flow d irectio n4.4 Mounting of the transmitter•The entire transmitter can be installed at a maximum distance of 1 km from the sensor.The housing is prepared for installation on a DIN rail to DIN EN 60715 TH35.Fig. 6: DIN rail housing for the transmitterFig. 7: Field housing for the C1-box5. Electrical connectionFig. 9: Electrical connection of the transmitter6. CommissioningCheck the following:•The correct connection between the sensor and transmitter.•The correct installation of the sensor on the internal wall of the transport pipe.If despite the above being correct the measurement is still not successful, consult SWR.Commissioning the SpeedFlowThe sensor is an absolute measuring device and must be parameterised during the commissioningprocedure. The menu functions in the supplied SpeedFlow configuration program are essentially self-explanatory. The program has been tested with all current Windows operating systems.The connection may be made using the RS 232 C interface (socket in the front panel) using the supplied cable or using the integral RS 485 interface (bus-capable) on screw terminals 11 and 12. By assigningdifferent addresses to the various transmitter the devices can be actuated in the bus using the ModBusprotocol. The following is a brief introduction as a summary.All the changed values must be saved by exiting the menu level and confirming the save function.Starting the menu After starting the SpeedFlow configuration program, open the interface (COM1to 10 can be selected). Fix the baud rate at 9600 Bd.Set the address of the transmitter (standard = 1).Current output The output values are set in menu points 3.1 to 3.8.The output value (current) is assigned to the measuring range here.Standard 0 = 4 mAMax = 20 mAThe measuring range filter is used to adjust to slower recording devices or acontinuous output at the analogue output.Alarms can be entered by the user in menu 2.Analogue output is modified in menu 3 and can be adjusted here to suit theuser's requirements. (Between 0 - 22 mA)Storage After making changes they can be saved using menu point Device Program.If you confirm Overwrite calibration the change will be made.Following the menu parameters in detail:7. Menu structure of the SpeedFlow configuration program1. Measuring range1.1 T ag no Adjust material (10 digits)1.2 Start of measuring range Range 0 (999)1.3 End of measuring range Range 0 (999)1.4 Filter value Range 0.1 ... 99.9 s2. Alarms2.1 Alarm 12.1 Alarm type Select: Min / Max / None2.2 Alarm value-10 to 110 % in physical units2.3 Alarm down time Range 0.1 ... 99.9 s2.4 Alarm hysteresis0.1 ... 99.9 %2.5 Operating mode Select: Working / Closed-circuit principle2.6 Sensor alarm Alarm for sensor error: On / Off3. Analogue output3.1 Start of range Range: 0 ... 22 mA (standard: 4 mA)3.2 End of range Range: 0 ... 22 mA (standard: 20 mA)3.3 MIN limit Range: 0 ... 22 mA (standard: 3 mA)3.4 MAX limit Range: 0 ... 22 mA (standard: 20 mA)3.5 Alarm value Range: 0 ... 22 mA (standard: 3 mA)3.6 Filter time Range: 0.1 ... 99.9 s (standard: 1 s)3.7 Calibration: 4 mA Adjust output current (4 mA calibrated)3.8 Calibration: 20 mA Adjust output current (20 mA calibrated)8. System settings in detail1. MEASURING RANGE1.1 T ag no.Freely selectable designation of the measuring medium or place,max. 10 characters1.2 Start of measuring rangeEnter the value of the required start of the measuring range.Normally 0.0.1.3 End of measuring rangeEnter the value of the required end of the measuring range.1.4 Filter valueAdjustable damping for the display in seconds.Range: 0.1 ... 99.9 s2. ALARMSEffect on the relay2.1 Alarm typeMin/Max - upper or lower limit value2.2 Alarm valueTrigger thresholdRange -10 ... 110 % of the measuring range values in physical units.2.3 Alarm down timeResponse time for how long the value must be below or above the limit valuebefore the alarm relay switches. Range: 0.1 ... 99.9 s2.4 Alarm hysteresisValue to reset the alarm.Range: 0.1 ... 99.9 % of the defined measuring range.2.5 Operating modeSelect the contact: Work or closed-circuitNO (working current) - NC (closed-circuit current)2.6 Sensor alarmAlarm for sensor errorON /OFF3. ANALOGUE OUTPUT3.1 Start of rangeValue to be set for minimum current output.(Standard 4 mA) - Range 0 ... 22 mA3.2 End of rangeValue to be set for maximum current output.(Standard 20 mA) - Range 0 ... 22 mA3.3 MIN limitMinimum current output value to be set. Range 0 ... 22 mA (standard 3 mA)3.4 MAX limitMaximum current output value to be set.Range 0 ... 22 mA (standard 20 mA)3.5 Alarm valueOutput value to be set for alarm (sensor error or internal alarm), at the same time the relay drops out.Range 0 ... 22 mA (standard 3 mA)3.6 Filter timeDamping to be set for the current output.Range 0.1 ... 99.9 s (standard 1 s)3.7 Calibration 4 mAMin. output current to be setAdjust to the external measuring system (if display is different).Adjust the output current to 4 mA using the and keys.3.8 Calibration 20 mAMax. output current to be setAdjust to the external measuring system (if display is different).Adjust the output current to 20 mA using the and keys.<><>9. Brief description of the PC operating softwareThe “SPF Service V.5.xx (E)” PC software can communicate with a sensor via RS 232 (front connector on the rail [DRC]) or via RS 485 (screw-terminal).The ModBus RTU log is used.•Interface standard is 9600 baud, 8 data bits, even parity, 1 stop bit.•Standard sensor address is 1.•Only one point-to-point connection can be established with one sensor via RS 232.• A bus system can be established via RS 485.• 1 sensor can be portrayed with the standard PC software.•Up to 10 sensors can be portrayed with an optional PC software.All settings required to operate the system can be activated via the PC software.•Interfaces and log file settings (data logger function) are activated in the System tab.•Current output, the signal’s measuring range, alarms and relay actions are set in the DRC tab.•Parameters for improving the measurement procedure are set in the Sensor menu.•The List and Trend tabs provide an overview of the measurement results from the measuring points.9.1 DRC tabSettings for customer system signals, see section 7.9.2 System tabLanguage:•German or English can be selected.Backup files:•Saving program data:Saves the settings from the PC program in a file so that they are available during the next start-up.These are automatically saved at the end of the program.•Save sensor parameters in a file / load sensor parameters from a file:Here, the measuring point parameters (DRC and sensor) can be saved into and read back from a file.•All backup files are saved in text format and can be opened with a normal text program. Communication:•COM port (COM1 to 10) of the interface used on the PC.• The baud rate for the communication must be the same on both devices.• If the baud rate for the DRC is changed, the new transmission rate will only apply after the DRC has been switched off and on again.• ModBus query rate and Timeout:Here, the intervals at which a query is sent to the connected system is set along with the time frame in which the response can be expected.Logging (PC data logger):• A log file is created for the sensor. The logs are saved as CSV files.•The decimal separator (comma or point) can be defined by CSV with decimal point.•The logging time interval can be entered as Log interval [ms].•The file name is automatically filled in with the ModBus address and serial number of the sensor in order to enable clear identification.•Automatic numbering of the files can be activated with the Auto-Increment option.The file numbers then increase each day (at midnight) and each time the program is started.•The file number can be manually adjusted with “Increase no.” or “Reset no.”.•The file path and active logging can be set in the footer.No COM-port scan (auto-start):If this option is selected, when starting, the software immediately begins with the most recently configured port and protocol settings.9.3 List tabHere, the sensor is portrayed in an overview list.Up to 10 sensors can be managed with the optional PC software.The sensor is portrayed with its main measurement value Vm and several secondary measurement values which provide information about the quality and condition of the measuring point.All values in this list are held in the log file and portrayed as trend lines (Trend tab).9.4 Trend tabAll values measured by the sensor from the overview list (List tab) are portrayed here as trends.Vm and Vcc are scaled on the left scale and all other values are scaled on the right scale.If upper and lower scale values are entered in the grey fields , these will be used - if the fields remain empty,automatic scaling will take place. With Zoom and Pos , the signal’s resolution and history can be set.9.5 Sensor tabThe measurement parameters, measurement values and quality numbers of the currently selected sensor are portrayed here. These parameters are provided as default settings or, if necessary, are selected when starting upthe sensor for the first time and permanently saved in the sensor.These parameters should only be set by trained personnel - as a rule by SWR employees - and should only be adjusted in special cases.10. Maintenance•Switch the power supply off before all maintenance and repair work on the measuring system.The transport pipe must not be operational to replace the sensor.•Repair and maintenance work may only be carried out by electricians.•The system requires no maintenance.11. WarrantyOn condition that the operating conditions are maintained and no intervention has been made on the device and the components of the system are not damaged or worn, the manufacturer provides a warranty of 1 year from the date of delivery.In the event of a defect during the warranty period, defective components will be replaced or repair at SWR's plant free of charge at discretion. Replaced parts will become SWR's property. If the parts are repaired or replaced at the customer's site at its request, the customer must pay the travelling expenses for SWR's service personnel.SWR cannot accept any liability for damage not suffered by the goods themselves and in particular SWR cannot accept liability for loss of profit or other financial damages suffered by the customer.Warning!The electrical installation may only be inspected by trained personnelProblem Cause MeasureMeasuring system does not work.POW LED not lit.RUN LED not lit.Power supply interrupted.Check the power supply.Cable break.Check the connection cables for a possible cable break.Fuse defective.Replace fuse.Device defective.Notify SWR and rectify the error as instructed on the telephone.Measuring system does not work.POW LED lit.RUN LED not lit.Microprocessor does notstart.Switch the power supply off and on again.Remove programming cable.Measuring system works.POW LED lit. RUN LED flashes quickly.No sensor communication.Sensor defective.Cable break between sensor and measuring system. Sensor connected incorrectly.Check connection cable.Sensor defective.Replace sensor.Sensor not receiving 24 Vsupply.Make sure the power supply is connected.Excessive voltage drop in thesupply cable to the sensor.Increase supply cable cross-section.Measuring systemoutputs incorrect values.Calibration incorrect.Calibration factor changed. Normal V = 1Switch output relaychatters.Hysteresis too low.Increase hysteresis. Check for fault caused by external consumer.Do not open, as otherwise the warranty claim expires!12. T echnical dataSensor Housing material Stainless steel 1.4571Protection category IP 65, dust Ex zone 20 or gas Ex zone 1 (optional)Operating temperature Sensor tip -20 ... +80 °C Optional: -20 ... +200 °C Sensor electronic: 0 ... +60 °C Max. working pressure 1 bar, optional 10 bar Sensor tip material Tungsten carbite Transmitting power Max. 5 mW Weight Approx. 1.5 kgDimensions Ø 60, Ø 20, L 320 mm (incl. rod length)Accuracy ± 1 % in calibrated rangeTransmitter Power supply 24 V DC ± 10 %Power consumption 20 W / 24 VA Protection category IP 40 to EN 60 529Operating temperature -10 ... +45 °C Dimensions 23 x 90 x 118 (W x H x D)WeightApprox. 172 g DIN rail mountingDIN 60715 TH35Connection terminals Cable cross-section 0,2 – 2,5 mm² [AWG 24-14]Current output signal 4 ... 20 mA (0 ... 20 mA), load < 500 WAlarm output Relay with switching contact - Max. 250 V AC, 1 A Data backupFlash memory (A l l r i g h t s r e s er v e d .)SWR engineering Messtechnik GmbHGutedelstraße 31 · 79418 Schliengen (Germany)Fon +49 7635 827248-0 · Fax +49 7635 827248-48 · Superior with Solids。
限速器测试仪仪器操作规程
DXC-B电梯限速器测试仪目录1. 总则 (3)2. 仪器组成 (3)2.1控制检测部分 (3)2.2手持部分 (4)3. 主要技术参数 (5)4. 主要功能 (5)5. 使用说明 (6)5.1 时间设定及修改 (6)5.2参数设置 (6)5.3查看数据 (7)5.4 删除数据 (8)5.5 数据导出 (8)5.6数据测量 (9)5.7 实际检测限速器 (10)6. 软件介绍 (12)6.1软件安装 (12)6.2功能介绍 (12)7. 打印机说明 (15)8. 故障及处理方法 (16)9.注意事项 (16)1.总则(1)目的:为了规范限速器测试仪的操作,特制定本规程.(2)适用范围:本规程适用于使用限速器测试仪对限速器的电气开关动作速度、机械动作速度的测试操作。
(3)使用前准备:确认仪器在有效检定周期内。
2.仪器组成限速器测试仪有两大部分组成:手持部分(图2)和控制检测部分(图1)。
2.1控制检测部分控制检测部分包括控制面板及安全开关接口、通信线接口、驱动轮和测速轮接口等。
图1安全开关插口:用于连接安全开关线。
USB插口:用于连接电脑,将检测数据导入到电脑中;测速轮和驱动电机插座:用于连接手持部分的测速轮和驱动轮;传感器插口:用于连接传感器;驱动开关:用于控制驱动电机是否工作;换向开关:用于改变限速器驱动轮的转动方向即驱动电机的正反转;打印机:打印当前测量数据;接地线:为防止工作场所接地不良,请务必使用随机附带的接地线。
2.2手持部分包括驱动轮、测速轮、手柄等,见图2。
测量轮设计成随动形式,保证测量的方便和接触的可靠。
驱动轮测量轮图23.主要技术参数●测量范围:0.5—10m/s●准确度:﹤±1%●保存测量次数:100组●电源:交流220V●驱动电机最高转速:3000r/m4.主要功能●测量线速度并保存最大测量数据功能;●测量限速器电气开关动作速度和限速器动作速度并自动保存数据;●数据查看和浏览功能;●参数设置功能;●时钟功能;●删除功能;●数据导出功能,检测数据可以导出到计算机(需专用软件)进行保存打印等。
- 1、下载文档前请自行甄别文档内容的完整性,平台不提供额外的编辑、内容补充、找答案等附加服务。
- 2、"仅部分预览"的文档,不可在线预览部分如存在完整性等问题,可反馈申请退款(可完整预览的文档不适用该条件!)。
- 3、如文档侵犯您的权益,请联系客服反馈,我们会尽快为您处理(人工客服工作时间:9:00-18:30)。
SY-800速度监控仪说明书
一、概述:
SY-800型速度监控仪是新一代智能皮带保护装置,它采用微电脑芯片为核心以及先进的传感方式,实现高水准的皮带打滑监测与报警功能。
是电力、矿山、石油、化工行业的理想选择。
二、功能说明
为了适应各种情况,本装置用户可以设置使用参数,如:报警带速,警告带速预置等。
SY-800速度监控仪面板示意图如图1所示。
图1 SY-800速度监控仪面板示意图
1.显示区域,采用3位数码显示。
2.指示区域(数码管下部的4只LED),采用LED指示灯报警,其中正
常指示为绿色,报警为红色。
另外,有信号指示灯显示传感器信号(绿色)。
3.输入区域,采用三个输入键:设置键,加一键(向上的三角),移位
键(向左的三角)。
4.工作状态指示区域(数码管左部的4只红色LED),对应的LED亮,
表示速度监控仪工作于相应的状态。
4种工作状态分别是:
1)速度,表示此时数码管显示的是皮带测速值;
2)预置速度,表示此时数码管显示的是预置速度值;
3)预置打滑I,表示此时数码管显示的是预置打滑I值;
4) 预置打滑II,表示此时数码管显示的是预置打滑II值。
注意:无论在那种工作状态,速度监控仪都会不间断地监测速度并进行控制。
5.工作状态
(1)运行:
设备运行后,设备开始检测带速,带速实时显示,当带速下降到警告带速时,LED报警并输出控制信号,如停机等控制等。
(2)设置:
在设置过程中,数码管小数点将点亮,小数点并不代表数值,而只是指示当前修改的数位。
设置键:按第一下预置速度指示灯亮,进入预置速度设置;按第二下预置打滑Ⅰ指示灯亮,进入预置打滑Ⅰ设置;按三下预置打滑Ⅱ指示灯亮,进入预置打滑Ⅱ设置;第四下返回速度。
加一键:更改小数点所指示位的数据值。
移位键:将小数点移至所要更改的数据位上。
6.输出:
本装置打滑信号的输出,采用继电器节点输出。
各项报警均为一组
常开,一组常闭。
采用继电器节点输出,具有可靠性好,触点使用
寿命长,利于程控接口。
三、技术指标:
1.适应检测转速30-999 rpm
2.要求检测的速度打滑率:10~50%
3.测量转速误差±1转
4.继电器运行寿命:10万次
5.触点容量:AC220V 3A
6.供电电压:AC220V 50Hz
7.使用环境温度:-25°— +50℃
8. 转速显示范围:0 –999 rpm
9.传感器防护等级:IP67
四.安装说明
1.传感器可放在胶带机从动辊侧安装方便的部位,并在从动辊端面外缘
的合适部位水平固定一个直径大于1cm的螺栓,螺栓的长度视安装方式
而定。
见图2。
2.安装传感器,应尽量保证安装板与胶带机从动辊端面平行,传感器支
架轴线与胶带平面最好垂直,螺栓的端面尽量与传感器的端面水平,且
对准传感器中心。
见图2、3。
图2 SY-800速度监控仪监测头安装示意图
图3 SY-800速度监控仪传感器安装孔图
3.SY-800速度监控仪箱体安装尺寸见图4。
4.传感器与箱体应就近安装,箱体应安装与不直接承受水冲洗和剧烈震动的地方。
图4 SY-800速度监控仪箱体安装示意图
五.接线说明(见表1)
表1 SY-800 速度监控仪端子接线图(从左至右)。
