布兰查德:高级宏观经济学ch07
全套教学课件《高级宏观经济学》
全套教学课件《高级宏观经济学》一、教学内容本节课的教学内容来自于《高级宏观经济学》教材的第五章,主要内容包括:国民收入的测量、国民收入的决定、消费与储蓄、投资与资本形成、货币与利率、通货膨胀与失业等。
本节课将重点讲解国民收入的测量和决定。
二、教学目标1. 让学生了解和掌握国民收入的测量方法,包括GDP和GNP的计算方法。
2. 让学生理解国民收入的决定因素,包括消费、储蓄、投资等。
3. 培养学生运用宏观经济学理论分析和解决实际问题的能力。
三、教学难点与重点重点:国民收入的测量方法,国民收入的决定因素。
难点:GDP和GNP的计算方法,投资与资本形成的区别与联系。
四、教具与学具准备教具:PPT课件、黑板、粉笔。
学具:笔记本、课本、文具。
五、教学过程1. 实践情景引入:通过播放一段关于我国经济增长的新闻报道,引发学生对国民收入的兴趣。
2. 知识讲解:讲解国民收入的测量方法,包括GDP和GNP的计算公式,并通过PPT课件展示实例。
3. 例题讲解:选取一道关于国民收入测量的例题,引导学生运用所学知识进行解答。
4. 随堂练习:布置一道关于国民收入测量的练习题,要求学生在课堂上完成。
5. 知识拓展:讲解国民收入的决定因素,包括消费、储蓄、投资等,并通过PPT课件展示相关数据和图表。
6. 例题讲解:选取一道关于国民收入决定的例题,引导学生运用所学知识进行解答。
7. 随堂练习:布置一道关于国民收入决定的练习题,要求学生在课堂上完成。
9. 板书设计:板书国民收入的测量方法和决定因素。
六、作业设计1. 作业题目:请运用所学知识,计算我国2019年的GDP和GNP。
答案:2019年我国GDP为99.1万亿元,GNP为100.6万亿元。
2. 作业题目:请分析影响我国国民收入决定的主要因素。
答案:影响我国国民收入决定的主要因素包括消费、储蓄、投资等。
七、课后反思及拓展延伸课后反思:本节课通过实践情景引入,激发了学生的学习兴趣,通过知识讲解、例题讲解和随堂练习,使学生掌握了国民收入的测量方法和决定因素。
布兰查德宏观经济学第七版第7版英文版chapter (7)
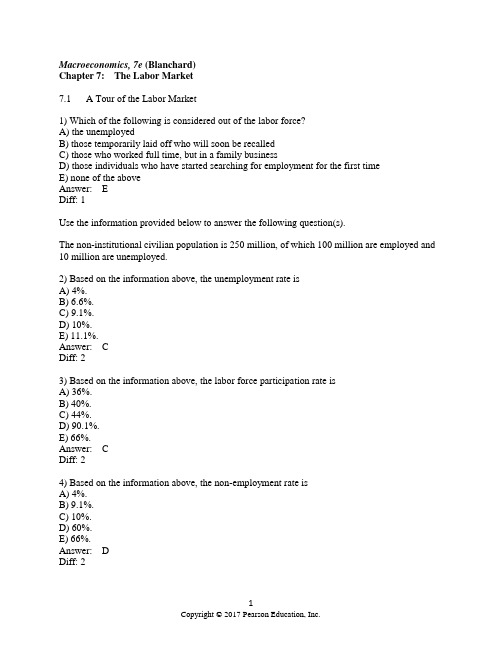
Macroeconomics, 7e (Blanchard)Chapter 7: The Labor Market7.1 A Tour of the Labor Market1) Which of the following is considered out of the labor force?A) the unemployedB) those temporarily laid off who will soon be recalledC) those who worked full time, but in a family businessD) those individuals who have started searching for employment for the first timeE) none of the aboveAnswer: EDiff: 1Use the information provided below to answer the following question(s).The non-institutional civilian population is 250 million, of which 100 million are employed and 10 million are unemployed.2) Based on the information above, the unemployment rate isA) 4%.B) 6.6%.C) 9.1%.D) 10%.E) 11.1%.Answer: CDiff: 23) Based on the information above, the labor force participation rate isA) 36%.B) 40%.C) 44%.D) 90.1%.E) 66%.Answer: CDiff: 24) Based on the information above, the non-employment rate isA) 4%.B) 9.1%.C) 10%.D) 60%.E) 66%.Answer: DDiff: 25) Which of the following individuals would be considered unemployed?A) an individual who works only part-timeB) an individual who works full-time in a family business, but is not paidC) an individual who is not working and is not looking for workD) all of the aboveE) none of the aboveAnswer: EDiff: 26) Based on the data provided in the chapter, which of the following represents the largest component of the labor force?A) discouraged workersB) retired individualsC) employedD) unemployedAnswer: CDiff: 17) The labor force is defined asA) the sum of the employed and unemployed.B) the total number employed.C) the total number of working age individuals in the population.D) the sum of the number of employed, unemployed and discouraged individuals. Answer: ADiff: 18) The participation rate in the United States in 2010 was approximately equal toA) 96%.B) 90%.C) 65%.D) 26%.E) 5%.Answer: CDiff: 19) Which of the following represents the participation rate?A) the ratio of the number employed to the size of the labor forceB) the ratio of the number employed to the civilian noninstitutional populationC) the ratio of the labor force to the civilian noninstitutional populationD) the ratio of the labor force to the total number of employed and unemployed workers Answer: CDiff: 110) The average amount of time people spend unemployed is approximatelyA) 1 month.B) 6 months .C) 12 months.D) none of the aboveAnswer: DDiff: 211) The Current Population Survey interviews approximately how many households each month?A) 5,000B) 10,000C) 60,000D) 100,000Answer: CDiff: 112) In the United States, how many workers become unemployed, on average, every day?A) 5,000B) 10,000C) 50,000D) 100,000Answer: CDiff: 113) In the United States, the average length of time people spend unemployed isA) approximately one month.B) between two and three months.C) between ten and eleven months.D) greater than twelve months.Answer: BDiff: 214) A reduction in the unemployment rate will tend to cause which of the following?A) an increase in the separation rateB) a reduction in the nominal wageC) a reduction in the duration that one is unemployedD) none of the aboveAnswer: CDiff: 215) When the unemployment rate is low, we would expect thatA) the probability of losing a job is high.B) the probability of losing a job is low.C) the probability an unemployed individual will find another job is low.D) the separation rate will increase.Answer: BDiff: 216) The participation rate in the U.S. has increased steadily over time. First, explain what the participation rate represents. Second, explain why the participation rate has increased. Answer: The participation rate is the ratio of the labor force to the working age population. One of the reasons for the significant increase in the participation rate is the increasing participation of women in the labor force.Diff: 217) What effect does the existence of discouraged workers have on the ability of the official unemployment rate to provide accurate information about the extent to which labor is employed? Answer: Discouraged workers are individuals who have stopped searching for employment because, for example, they have become "discouraged" with the prospects of finding employment. Once they stop searching (after 4 weeks), they are no longer counted as unemployed and, therefore, in the labor force. Such a dynamic would cause the official unemployment to fall. Alternatively, the existence of discouraged workers implies that the official unemployment rate underestimates the extent to which labor is being is not being used. This explains why the existence of discouraged workers can cause the unemployment rate to be an imperfect measure of the utilization of labor.Diff: 218) First, provide a brief explanation of what the unemployment rate measures. Second, explain how changes in each of the components of the unemployment rate can cause changes in the unemployment rate.Answer: The unemployment rate measures the percentage of the labor force that is unemployed. The unemployment rate is based on a monthly survey of households. Individuals are classified as employed, unemployed, or out of the labor force. Individuals employed or unemployed are in the labor force. Suppose individuals decide to enter the labor force for the first time. This increase in the size of the labor force, all else fixed, would cause an increase in the unemployment rate.On the other hand, if there were an increase in the number of individuals unemployed (caused by, for example, firms laying off workers as demand for their products falls), we would observe no change in the labor force but an increase in the unemployment rate.Diff: 27.2 Movements in Unemployment1) Data on labor-force flows show thatA) almost all separations are due to death.B) almost all separations are due to serious illness.C) almost all separations are quits.D) almost all separations are layoffs.E) none of the aboveAnswer: EDiff: 22) Data on labor-force flows show thatA) in any given month, almost none of the unemployed gets jobs.B) in any given month, almost all of the unemployed gets jobs.C) the average duration of unemployment is about 2 weeks.D) the average duration of unemployment is about 2 years.E) in any given month, about one-fourth of the unemployed get jobs.Answer: EDiff: 23) Which of the following variables is most directly determined in the labor market?A) stock pricesB) nominal wagesC) interest ratesD) all of the aboveE) none of the aboveAnswer: BDiff: 14) The two labor markets in the "dual labor market" areA) southern versus northern.B) western versus eastern.C) English speaking versus non-English speaking.D) domestic versus foreign.E) none of the aboveAnswer: EDiff: 15) When the Current Population Survey (CPS) was introduced in 1940, it was based on a survey of approximately 8,000 households. The CPS survey is now based on a survey of how many households?A) 8,000B) 10,000C) 12,000D) 20,000E) 60,000Answer: EDiff: 26) As the unemployment rate falls,A) the proportion of the unemployed finding a job increases.B) the separation rate increases.C) the young and unskilled experience larger-than-average decreases in unemployment.D) both A and C.E) all of the aboveAnswer: DDiff: 27.3 Wage Determination1) Which of the following statements about wage setting is true?A) most workers in the U.S. have their wages set by formal contracts.B) formal contracts play a more important role in Japan and Western Europe than in the United States.C) the minimum wage in the U.S. is about 75% of the average wage.D) all of the aboveAnswer: BDiff: 12) The reservation wage isA) the wage that an employer must pay workers to reduce turnover to a reasonable level.B) the wage that ensures a laid-off individual will wait for re-hire, rather than find another job.C) the lowest wage firms are allowed by law to pay workers.D) the wage offer that will end a labor-strike.E) none of the aboveAnswer: EDiff: 13) Efficiency wage theory suggests thatA) workers will be paid less than their reservation wage.B) productivity might drop if the wage rate is too low.C) the government can only set tax rates so high before people will prefer not to work.D) unskilled workers will have a lower turnover rate than skilled workers.E) firms will be more resistant to wage increases as the labor market tightens. Answer: BDiff: 24) If efficiency wage theory is valid, we would expect a relatively low premium over the reservation wage whenA) the unemployment rate is low.B) the job requires very little training.C) workers can be easily monitored.D) workers have few other options for employment in the area.E) all of the aboveAnswer: CDiff: 25) Henry Ford's experiment with efficiency wages resulted inA) a dramatic drop in productivity.B) a dramatic increase in the turnover rate.C) a reduction in the layoff rate.D) new problems with the work force, like drunkenness and reckless driving.E) no noticeable effects.Answer: CDiff: 26) In the wage-setting relation, the nominal wage tends to decrease whenA) the price level increases.B) the unemployment rate decreases.C) unemployment benefits decrease.D) the minimum wage increases.E) all of the aboveAnswer: CDiff: 17) In the wage setting relation W = P e F(u,z), the variable z does not include which of the following variables?A) the minimum wageB) unemployment benefitsC) the extent to which firms mark up prices over their marginal costD) all of the aboveE) none of the aboveAnswer: CDiff: 18) Labor productivity is represented by which of the following?A) the ratio of output to employmentB) workers per unit of capitalC) capital per workerD) the ratio of output to populationE) the ratio of output to the labor forceAnswer: ADiff: 19) Today, about ________ of U.S. workers have their wages set by collective bargaining agreements.A) 10%B) 15%C) 20%D) 25%Answer: ADiff: 210) Explain several implications and characteristics of efficiency wage theories.Answer: The efficiency wage theory suggests that firms will pay workers a wage in excess of the workers' reservation wage to minimize quits and to increase productivity. The efficiency wage theory also suggests that nominal wages will be a function of labor market conditions. As the unemployment rate falls, the nominal wage will rise.Diff: 211) Explain how an increase in the unemployment rate will affect bargaining power and nominal wages.Answer: As the unemployment rate increases, it is more difficult for individuals to find employment at other firms. So, workers' bargaining power will fall. As bargaining power falls, the nominal wage will fall.Diff: 212) First, explain what the WS relation represents. Second, explain why it has its particular shape.Answer: The WS relation illustrates the effect of changes in the unemployment rate on the real wage implied by the wage-setting behavior of firms and workers. The WS curve (or relation) is downward sloping because as the unemployment rate increases, workers have less bargaining power so the nominal wage will decrease. This decrease in W, given P, implies that the real wage will also fall. Hence, the WS curve is downward sloping.Diff: 27.4 Price Determination1) The price setting equation is represented by the following: P = (1 + m)W. When there is perfect competition, we know that m will equalA) W.B) P.C) 1.D) W/P.E) none of the aboveAnswer: CDiff: 22) Explain why nominal wages are a function of the expected price level.Answer: Workers and firms care about the real wage. Nominal wages are typically set for a period of time by contracts. Individuals will, therefore, be concerned about what the future price level will be when determining the nominal wage. When setting the nominal wage, individuals will form expectations of what the future price level will be. They will use this to help determine the nominal wage.Diff: 27.5 The Natural Rate of Unemployment1) The natural rate of unemployment is the rate of unemploymentA) that occurs when the money market is in equilibrium.B) that occurs when the markup of prices over costs is zero.C) where the markup of prices over costs is equal to its historical value.D) that occurs when both the goods and financial markets are in equilibrium.E) none of the aboveAnswer: EDiff: 22) The natural level of output is the level of output that occurs whenA) the goods market and financial markets are in equilibrium.B) the economy is operating at the unemployment rate consistent with both the wage-setting and price-setting equations.C) the markup (m) is zero.D) the unemployment rate is zero.E) there are no discouraged workers in the economy.Answer: BDiff: 23) Suppose we wish to examine the determinants of the equilibrium real wage and equilibrium level of employment (N). In a graph with the real wage on the vertical axis, and the level of employment on the horizontal axis, the price-setting relation will now beA) a vertical line.B) a horizontal line.C) an upward sloping line.D) a downward sloping line.E) kinked at the natural rate of unemployment.Answer: BDiff: 24) Suppose we wish to examine the determinants of the equilibrium real wage and equilibrium level of employment (N). In a graph with the real wage on the vertical axis, and the level of employment on the horizontal axis, the wage-setting relation will now beA) a vertical line.B) a horizontal line.C) an upward sloping line.D) a downward sloping line.E) a curve that first slopes upward, then downward.Answer: CDiff: 25) The natural level of employment (N) will increase when which of the following occurs?A) an increase in the markup of prices over costsB) a reduction in unemployment benefitsC) an increase in the actual unemployment rateD) all of the aboveE) none of the aboveAnswer: BDiff: 26) Suppose workers and firms expect the overall price level to increase by 5%. Given this information, we would expect thatA) the nominal wage will increase by less than 5%.B) the nominal wage will increase by exactly 5%.C) the nominal wage will increase by more than 5%.D) the real wage will increase by 5%.E) the real wage will increase by less than 5%.Answer: BDiff: 27) Suppose the actual unemployment rate decreases. This will causeA) an upward shift in the WS curve.B) a downward shift in the WS curve.C) an upward shift in the PS curve.D) a downward shift in the PS curve.E) none of the aboveAnswer: EDiff: 28) Suppose the actual unemployment rate increases. This will causeA) an upward shift in the WS curve.B) a downward shift in the WS curve.C) an upward shift in the PS curve.D) a movement along the WS and the PS curves.E) none of the aboveAnswer: DDiff: 29) With the real wage on the vertical axis and the unemployment rate on the horizontal axis, we know thatA) the WS curve is upward sloping.B) the WS curve is downward sloping.C) the PS curve is upward sloping.D) the PS curve is downward sloping.Answer: BDiff: 210) Based on wage setting behavior, we know that a reduction in the unemployment rate will causeA) no change in the real wage.B) a reduction in the real wage.C) an increase in the real wage.D) an upward shift of the WS curve.Answer: CDiff: 211) Based on price setting behavior, we know that a reduction in the unemployment rate will causeA) no change in the real wage.B) a reduction in the real wage.C) an increase in the real wage.D) an upward shift of the PS curve.Answer: ADiff: 212) Suppose the aggregate production function is given by the following: Y = AN. Given this information, we know that labor productivity is represented by which of the following?A) 1/AB) AC) 1/ND) N/YAnswer: BDiff: 213) Suppose the aggregate production function is given by the following: Y = N. Given this information, we know that labor productivity is represented by which of the following?A) 1/NB) NC) N/YD) 1Answer: DDiff: 214) A reduction in unemployment benefits will tend to cause which of the following?A) an upward shift in the WS curveB) a downward shift in the WS curveC) an upward shift in the PS curveD) a downward shift in the PS curveE) none of the aboveAnswer: BDiff: 215) An increase in the minimum wage will tend to cause which of the following?A) an upward shift in the WS curveB) a downward shift in the WS curveC) an upward shift in the PS curveD) a downward shift in the PS curveE) none of the aboveAnswer: ADiff: 216) Suppose that increased international trade makes product markets more competitive in the U.S. Given this information, we would expect to observe which of the following?A) an upward shift in the WS curveB) a downward shift in the WS curveC) an upward shift in the PS curveD) a downward shift in the PS curveE) none of the aboveAnswer: CDiff: 217) With the real wage on the vertical axis and employment (N) on the horizontal axis, we know thatA) the WS curve is upward sloping.B) the WS curve is downward sloping.C) the PS curve is upward sloping.D) the PS curve is downward sloping.Answer: ADiff: 218) Based on our understanding of the labor market model presented in Chapter 6, we know that an increase in the minimum wage will causeA) an increase in the equilibrium real wage.B) a reduction in the equilibrium real wage.C) a reduction in the natural rate of unemployment.D) both B and CAnswer: ADiff: 219) Based on our understanding of the labor market model presented in Chapter 6, we know that an increase in the markup will causeA) an increase in the equilibrium real wage.B) a reduction in the equilibrium real wage.C) a reduction in the natural rate of unemployment.D) both B and CAnswer: BDiff: 220) Based on our understanding of the labor market model presented in Chapter 6, we know thata reduction in the markup will causeA) an increase in the equilibrium real wage.B) a reduction in the equilibrium real wage.C) an increase in the natural rate of unemployment.D) a reduction in the natural rate of unemployment and no change in the real wage.Answer: ADiff: 221) For this question, assume that Y = N. Based on our understanding of the labor market model presented in Chapter 6, we know that an increase in the minimum wage will causeA) an increase in the natural level of output.B) a reduction in the natural level of output.C) no change in the natural level of output.D) an increase in the natural level of employment.Answer: BDiff: 222) For this question, assume that Y = N. Based on our understanding of the labor market model presented in Chapter 6, we know that a reduction in the markup will causeA) an increase in the natural level of output.B) a reduction in the natural level of output.C) no change in the natural level of output.D) a reduction in the natural level of employment.Answer: ADiff: 223) Based on wage setting behavior, we know that an increase in the unemployment rate will causeA) no change in the real wage.B) a reduction in the real wage.C) an increase in the real wage.D) an upward shift of the WS curve.Answer: BDiff: 224) Based on price setting behavior, we know that an increase in the unemployment rate will causeA) no change in the real wage.B) a reduction in the real wage.C) an increase in the real wage.D) an upward shift of the PS curve.Answer: ADiff: 225) An increase in unemployment benefits will tend to cause which of the following?A) a downward shift in the WS curveB) an upward shift in the PS curveC) an upward shift in the WS curveD) a downward shift in the PS curveE) none of the aboveAnswer: CDiff: 226) A reduction in the minimum wage will tend to cause which of the following?A) an upward shift in the WS curveB) a downward shift in the WS curveC) an upward shift in the PS curveD) a downward shift in the PS curveE) none of the aboveAnswer: BDiff: 227) Explain what effect a reduction in the unemployment rate will have on the real wage based on: (1) the WS relation; and (2) the PS relation.Answer: A reduction in the unemployment rate will increase bargaining power, increase the nominal wage, and therefore increase the real wage based on wage setting behavior. Changes in the unemployment rate have no effect on the real wage based on price setting behavior.Diff: 228) First, explain what the PS relation represents. Second, explain why it has its particular shape. Answer: The PS relation illustrates the effect of changes in the unemployment rate on the real wage implied by the price-setting behavior of firms. Firms set prices as a markup over their marginal cost of producing goods. Given that the marginal cost is assumed to be independent of the level of employment (and, therefore, the unemployment rate), changes in u will have no effect on the price firms set and, therefore, on the real wage based on PS behavior.Diff: 229) Graphically illustrate (using the WS and PS relations) and explain the effects of an increase in the markup on the equilibrium real wage, the natural rate of unemployment, the natural level of employment, and the natural level of output.Answer: An increase in the markup will cause firms to raise the price given the nominal wage. This will cause the real wage based on price setting behavior to decrease; this is represented by a downward shift in the PS curve. This reduction in the real wage will also occur with an increase in the unemployment rate. So, the natural rate of unemployment will rise and the natural level of employment and, therefore, output will fall. The equilibrium real wage will also be lower. Diff: 230) Graphically illustrate (using the WS and PS relations) and explain the effects of an increase in the minimum wage on the equilibrium real wage, the natural rate of unemployment, the natural level of employment, and the natural level of output.Answer: An increase in the minimum wage will cause the nominal wage based on wage setting behavior to increase; this is represented as an upward shift in the WS relation. As the nominal wage increases, firms will respond by increasing the price level so we will observe no change in the equilibrium real wage. We will observe an increase in the natural rate of unemployment and a reduction in both the natural level of employment and output.Diff: 231) Based on your understanding of the labor market model presented by Blanchard (i.e., the WS and PS relations), explain what types of policies could be implemented to cause a reduction in the natural rate of unemployment.Answer: The natural rate of unemployment will change whenever either the PS or WS relations change. To reduce the natural rate, policy makers could implement polices that: (1) reduce unemployment benefits; (2) reduce the minimum wage; or (3) increase competition in product markets.Diff: 232) Explain how a reduction in the unemployment rate will affect bargaining power and nominal wages.Answer: As the unemployment rate decreases, it is easier for individuals to find employment at other firms. So, workers' bargaining power will increase. As bargaining power increases, the nominal wage will increase.Diff: 233) Graphically illustrate (using the WS and PS relations) and explain the effects of a reduction in the markup on the equilibrium real wage, the natural rate of unemployment, the natural level of employment, and the natural level of output.Answer: A reduction in the markup will cause firms to reduce the price given the nominal wage. This will cause the real wage based on price setting behavior to increase; this is represented by a upward shift in the PS curve. This increase in the real wage will also occur with an decrease in the unemployment rate. So, the natural rate of unemployment will decrease and the natural level of employment and, therefore, output will increase. The equilibrium real wage will also be higher.Diff: 234) Graphically illustrate (using the WS and PS relations) and explain the effects of a reduction in the minimum wage on the equilibrium real wage, the natural rate of unemployment, the natural level of employment, and the natural level of output.Answer: A reduction in the minimum wage will cause the nominal wage based on wage setting behavior to decrease; this is represented as an downward shift in the WS relation. As the nominal wage deceases, firms will respond by reducing the price level so we will observe no change in the equilibrium real wage. We will observe a decrease in the natural rate of unemployment and an increase in both the natural level of employment and output.Diff: 235) Explain what effect an increase in the unemployment rate will have on the real wage based on: (1) the WS relation; and (2) the PS relation.Answer: An increase in the unemployment rate will decrease bargaining power, decrease the nominal wage, and therefore decrease the real wage based on wage setting behavior. Changes in the unemployment rate have no effect on the real wage based on price setting behavior.Diff: 2。
布兰查德:高级宏观经济学ch09
© 2003 Prentice Hall Business Publishing
Macroeconomics, 3/e
Olivier Blanchard
Okun’s Law: From Output Growth to Unemployment
▪ The actual relation between output growth and the change in the unemployment rate is known as Okun’s law.
Olivier Blanchard
Output, Unemployment,
9-1
and Inflation
▪ This chapter builds on three relations:
1. Okun’s Law, which relates the change in unemployment to output growth.
Macroeconomics, 3/e
Olivier Blanchard
Okun’s Law: From Output Growth to Unemployment
ut ut1 gyt ▪ According to the equation above, the change
in the unemployment rate should be equal to the negative of the growth rate of output. ▪ For example, if output growth is 4%, then the unemployment rate should decline by 4%.
deviation of unemployment from the natural rate of
高级宏观经济学第七章通货膨胀与失业

第二种情况,成本推进通货膨胀引致失业。 假定原有的需求水平下,经济实现了充分就业和物价稳定,如果发生成本推进通货膨胀,则原来的总需求所能购买的实际产品数量将会减少,也就是说在成本推进压力提高物价水平时,一个已知的总需求只能在市场上支持一个较少的实际产出,所以产出会下降,失业会增加。70年代的美国就证明了这一点。1972年来,石油输出国组织把石油价格翻了两番,使1973年至1975年的物价水平迅速上升,失业率从不到5%下降到1975年的8.5%。
本期价格指数=19/11 ×100% =172.7% 通货膨胀率 =172.7%-1 = 72.7% 表明本期价格水平比基期价格水平上升72.7%,即这一时期(基期到本期)的通货膨胀率为72.7%。
指数(consumer price
index, CPI)又称生活费用指数; 价格指数 (producer price
第三种情况,极度膨胀(byperinflation)导致经济崩溃。
从产生过程来看: 第一阶段,随着通货膨胀的出现,价格不断上升,人们不会让自已的储蓄和现款收入贬值,而愿意在价格上升前把它花掉。从而产生过度的消费购买,这样储蓄和投资都会减少,从而扩张了需求,但是长时期如此,势必造成下一阶段增长率下降。
相反,那些靠变动收入维持生活的人,则会从通货膨胀中受益。这些人的货币收入会走在价格水平和生活费用上涨之前。从利润得到收入的企业主就是这样一种人。如果商品价格比资源价格上升得快,则企业的收益比成本增加的快。
其次,通货膨胀对储蓄者不利。
再次,通货膨胀可以在债权人和债务人之间发生收入再分配的作用。如,借款的名义利率为10%,而通胀率为20%,则实际利率为-10%,实际利率等于名义利率与通货膨胀率之差。
抑制性的通胀——如果政府对价格进行某种形式的控制,使得物价同市场供求脱离关系时,过度需求就不会引起物价水平上涨,或物价上涨有限而不足以反映过度需求的真实水平。此时被称作抑制性的通货膨胀。在抑制性的通货膨胀中,过度需求不会因政府对价格的控制而消失,而是转化为商品短缺和供应紧张,形成隐弊的通货膨胀。抑制性的通货膨胀严重到一定程度,物价最终还将突破限制而有所上涨,黑市交易猖獗,不过这种物价上涨是滞后的。
高级宏观经济学完整教学课件

金融市场的不稳定性对宏观经济波动的影响日益显著,未来研究将 更加注重金融市场与宏观经济的关联性分析。
人工智能与宏观经济决策
随着人工智能技术的快速发展,未来研究将更加注重将人工智能技 术应用于宏观经济决策中,提高决策的科学性和准确性。
THANKS
感谢观看
经济增长理论
经济增长的源泉
包括资本积累、劳动力增加、技术进步等。
经济增长模型
如索洛模型、拉姆齐模型等,用于分析经济 增长的动态过程。
经济增长的差异与收敛
不同国家和地区之间的经济增长存在差异, 但长期来看可能存在收敛趋势。
可持续增长与绿色发展
强调在经济增长的同时,注重环境保护和资 源节约,实现可持续发展。
阐述消费者行为和企业决策如何构成宏观经济分 析的基础。
市场均衡与价格水平决定
市场类型与均衡分析
介绍不同类型市场(完全竞争、垄断、寡头 等)的均衡条件及价格水平决定机制。
一般均衡理论
探讨在多个市场相互作用下实现一般均衡的 条件和过程。
价格水平调整与宏观经济波动
分析价格水平调整对宏观经济波动的影响及 传导机制。
介绍金融市场的类型、功能及运行机 制,包括货币市场、资本市场等。
货币政策工具与目标
货币政策传导机制
分析货币政策如何通过金融市场传导 至实体经济,以及影响货币政策效果 的因素。
阐述货币政策的目标、工具(如利率 、存款准备金率等)及其实施方式。
04
国际宏观经济学
国际贸易与汇率制度
01
02
03
04国际贸易理论货币政与财政政策货币政策工具
包括公开市场操作、存款准备金率、利率等 ,用于调节货币供应量和市场利率。
《高级宏观学教学资料》ch 7n

7.6 Empirical Applications
1. 价格调整的微观证据 (1) 价格变动很不灵活:价格调整的平均时间为1年左右
(Blinder),4-6个月(Bils等) (2)价格调整并无简单模式 一般而言,只有当通胀率高到使厂商产品的实际价格下降
10%后,厂商才会提价(p330下)。这与Fischer和Taylor模型假定不 一致。
Et2mt 1
1 2
Et2 pt1 pt2
(7.20)移项得 :
pt1
2 1
Et 1mt
1 1
pt2
由(7.22)顺推 :
Et2 pt1
2 1
Et 2 mt
1 1
pt2
(假定Et2 Et1mt Et2mt )
(7.21) (7.22) (7.23)
5
将(7.23)代入(7.21)得(7.24)
Q pi*t pt yt
c0
长期均衡条件 : yt 0, pi*t pt xt xt1 mt pt
pi*t
Et
p* it 1
mt
pt
(7.33)变为:
u mt vmt mt
(7.34)
u (1 v)mt
Q 长期中u 0, v 1
(7.33)式变为: 同理:
xt xt1 (1 )mt xt1 xt (1 )mt1
2
7.1 Dynamic New Keynesian Models 的基础
消费者效用最大化行为决定实际工资:
Wt Pt
BYt 1
假设:Yt =Lt =Ct
(7.6)
Yt由上章(6.8)式即新凯恩斯主义的IS曲线决定:
lnYt
lnY t
高级宏观经济学教案

2
货币供给
3
主要宏观经济政策问题 通货膨胀 通货膨胀的原因 通货膨胀的治理 失业 失业(自然失业)的原因 失业的治理 货币政策 货币政策(货币供给)的目标 货币政策的影响 货币政策的有效性 财政政策 财政政策的目标 财政政策的影响 财政政策的有效性
现代主流宏观经济学都是具有微观基础的一般均衡模型
人均产出(Y/L)的增长来源于人均资本存量和技术进步,但只有技术进步才能够导致人均产出的永久性增长。
通过调节储蓄率可以实现人均最优消费和最优资本存量的“黄金律”增长。
储蓄率的变化只会暂时性地影响增长率,而不会永久性地影响;储蓄率的显著变化对平衡增长路径上的产出变化只有较小的影响,且作用缓慢。
上篇 拉姆齐-卡斯-库普曼斯模型
储蓄率的一个永久性的增加,导致个人平均产量的暂时性增加。
储蓄率的变化只有水平效应,但没有增长效应,它改变经济的偏好增长路径名因而改变任一时点上工人的平均产量水平,但并不影响处于偏好增长时每个工人平均产量的增长率。在索洛模型中只有技术进步率的变化有增长效应,所有其他变化都只有水平效应。
1
2
对消费的影响
在索洛模型中,储蓄率s被假定为外生参数,储蓄率的变动将影响稳态的人均消费和动态的人均消费水平。
问题的提出
如果
第二章 索洛模型的背后: 无限期界和世代交叠模型
01
与最优储蓄(相对应于最优资本存量和最优消费)相比会出现“过度储蓄”(即“过度积累”)的情况,而一个高于黄金率的储蓄率被证明是动态无效的。
g
K/Y
资本产出比
0
结论:在索洛模型中,无论从任何一点出发,经济向平衡增长路径收敛,在平衡增长路径上,每个变量的增长率都是常数,且是外生决定的。特别是,在该路径上,人均产出的增长率仅取决于技术进步率。
布兰查德宏观经济学优秀课件

3
Chapter 7: Epilogue: The Story of Macroeconomics
27-2 The Neoclassical Synthesis
Paul Samuelson wrote the first modern economics textbook: Economics
The neoclassical synthesis refers to a large consensus that emerged in the early 1950s, based on the ideas of Keynes and earlier economists. The neoclassical synthesis was to remain the dominant view for another 20 years. The period from the early 1940s to the early 1970s was called the golden age of macroeconomics.
5
Theories of Consumption, Investment, and Money Demand
Chapter 7: Epilogue: The Story of Macroeconomics
Modigliani
In the 1950s, Franco Modigliani and Milton Friedman independently developed the theory of consumption, and insisted on the importance of expectations.
- 1、下载文档前请自行甄别文档内容的完整性,平台不提供额外的编辑、内容补充、找答案等附加服务。
- 2、"仅部分预览"的文档,不可在线预览部分如存在完整性等问题,可反馈申请退款(可完整预览的文档不适用该条件!)。
- 3、如文档侵犯您的权益,请联系客服反馈,我们会尽快为您处理(人工客服工作时间:9:00-18:30)。
M Y Y , G, T P
( , , )
Macroeconomics, 3/e Olivier Blanchard
© 2003 Prentice Hall Business Publishing
7-3
Equilibrium in the Short Run and in the Medium Run
1. When Y > Yn, P > Pe. 2. When Y < Yn, P < Pe.
3. An increase in Pe shifts the AS curve up, and a decrease in Pe shifts the AS curve down.
© 2003 Prentice Hall Business Publishing Macroeconomics, 3/e Olivier Blanchard
P P (1 ) F (u, z)
e
In words, the price level depends on the expected price level and the unemployment rate. We assume that and z are constant.
© 2003 Prentice Hall Business Publishing
© 2003 Prentice Hall Business Publishing
Macroeconomics, 3/e
Olivier Blanchard
Properties of the AS curve
1. The AS curve is upward sloping. As explained earlier, an increase in output leads to an increase in the price level. 2. The AS curve goes through point A, where Y = Yn and P = Pe. This property has two implications:
IS relation: Y C(Y T ) I (Y , i ) G
M LM relation: YL(i ) P
© 2003 Prentice Hall Business Publishing Macroeconomics, 3/e Olivier Blanchard
Aggregate Demand
© 2003 Prentice Hall Business Publishing Macroeconomics, 3/e Olivier Blanchard
1. An increase in output leads to an increase in the
price level. This is the result of four steps:
1. Y N 2. N u
3. u W
4. W P
© 2003 Prentice Hall Business Publishing
CHAPTER
7
Putting All Markets Together: The AS-AD Model
Prepared by: Fernando Quijano and Yvonn Quijano
© 2003 Prentice Hall Business Publishing
Macroeconomics, 3/e
© 2003 Prentice Hall Business Publishing
Macroeconomics, 3/e
Olivier Blanchard
7-2
Aggregate Demand
The aggregate demand relation captures the effect of the price level on output. It is derived from the equilibrium conditions in the goods and financial markets. Recall the equilibrium conditions for the goods and financial markets described in chapter 5:
M Y Y , G, T P
( , , )
© 2003 Prentice Hall Business Publishing
Macroeconomics, 3/e
Olivier Blanchard
Aggregate Demand
Shifts of the Aggregate Demand Curve An increase in government spending increases output at a given price level, shifting the aggregate demand curve to the right. A decrease in nominal money decreases output at a given price level, shifting the aggregate demand curve to the left.
Macroeconomics, 3/e
Olivier Blanchard
Properties of the AS Relation
Y P P (1 ) F 1 , z L
e
The AS relation has two important properties:
© 2003 Prentice Hall Business Publishing
Macroeconomics, 3/e
Olivier Blanchard
Properties of the AS Relation
Y P P (1 ) F S relation has two important properties:
Y AS Relation P P (1 ) F 1 , z L
e
M AD Relation Y Y , G, T P
Equilibrium (即中期均衡)depends on the value of Pe. The value of Pe determines the position of the aggregate supply curve, and the position of the AS curve affects the equilibrium.
2. An increase in the expected price level leads, one
for one, to an increase in the actual price level. This effect works through wages:
1. P e W 2. W P
© 2003 Prentice Hall Business Publishing
Macroeconomics, 3/e
Olivier Blanchard
Aggregate Supply
The Aggregate Supply Curve Given the expected price level, an increase in output leads to an increase in the price level. If output is equal to the natural level of output, the price level is equal to the expected price level.
Therefore, for a given labor force, the higher is output, the lower is the unemployment rate.
© 2003 Prentice Hall Business Publishing
Macroeconomics, 3/e
Aggregate Supply
The Effect of an Increase in the Expected Price Level on the Aggregate Supply Curve An increase in the expected price level shifts the aggregate supply curve up.
W P e F (u, z)
P (1 )W
© 2003 Prentice Hall Business Publishing
Macroeconomics, 3/e
Olivier Blanchard
Deriving the Aggregate Supply Relation
Step 1: Eliminate the nominal wage from: W P e F (u, z) and P (1 )W, then:
The Derivation of the Aggregate Demand Curve An increase in the price level leads to a decrease in output.
M P i demand Y P
© 2003 Prentice Hall Business Publishing
Macroeconomics, 3/e
Olivier Blanchard
Deriving the Aggregate Supply Relation