TK点印迹图像分析软件使用说明
图像测量软件 iSolution Lite 使用手册说明书

Features included in iSolution LiteInclude:Live Measurement and Overlay SettingsUsers can perform measurements on the live preview image, using the crosshair or grid masks to center and count. The grid masks include calibration data. Calibration marker (scale bar) can be placed on the live preview image. The marker (scale bar) can also be burned on each captured image automatically. Any standard file format image can be chosen to see it above live preview image.Calibration (Auto, Manual)All measurements start with an accurate calibration. Auto, Semi-Auto calibration functions allow the software to calculate the pixels-per-unit value automatically. Only setting the unit for the calibration scale and the distance between the scale marks is needed. This feature greatly improves the accuracy and repetition of measurements. Manual calibrations are easily added and saved for recall from a drop down menu. All calibrations can be saved as files, which let the calibration be retrieved by simply opening the saved files later.Calibration can be protected by password option. Two password options, one in calibration menu itself and the other in camera resolution option, protect calibration by unexpected change. A scale bar can be permanently added to each image. Scale bar properties for color, size and text are simple to optimize for any image background.Z-Axis Extended Focus Imaging (EFI), with displacement compensation for stereo microscopesSamples with curves or of varying heights are difficult to bring into focus under highly magnified conditions. And more a stereomicroscope takes images with tilting due to its own structural characteristics. Thus, each image is out of its supposed position when you move microscope to the Z-axis getting the right focus. Our displacement compensation function allows you to rearrange these images automatically and manually.Software can combine a stack of images sequentially captured at different levels of focus and combine them into a single in-focus image. You can count on our software not to leave any trace of the composites.3D Visualization. . . clearly view complex structuresA Three-dimensional picture can be created from any image. The 3-D presentation is based upon intensity values of the image and can be displayed as a normal or wire frame image. Z axis information can easily be adjusted to optimize the 3-D effect. To better visualize an image in 3-D, software offers full 360 degrees of rotation on X-Y-Z axis. A 3D image can then saved in JPG, TIF or BMP format.Image Stitching. . . create a mosaic of the “Big Picture”With our software, you can create auto and manual composites of continuously captured images in order to minimize the reduction in the field-of-view that typically comes with increased magnification. Combined images are automatically corrected for brightness without leaving any stitching mark. Live Image Comparison. . . for fast inspection and size verificationFor QA testing or quick go/no-go inspections any stored image can be used as a reference image onto which the live preview image is projected.Time Lapse Capture and Movie File Production. . . Import into Power PointSoftware features a Time Lapse Capture function that supports TIF, BMP and JPG file formats. The Time Lapse Capture function also includes an Auto Save feature byyyyy/mm/dd/hour/minute/second. You can save video movie recordings in AVI, MPG, MPEG, and MOV formats.Combine Image Planes - Fluorescence ImagingMerge and pseudo color monochrome images into a single RGB composite.Export Into Excel® - with one mouse clickA single mouse click exports the original image with measurement, calibration, annotation overlay,measurement data, statistics, and chart.Manual Measurement Tools - Including Various Perpendicular DistanceSoftware’s versatile manual measurement features include tools for measuring lengths, areas, and angles and can even auto detect an object's outline and then make specified measurements. The software is equipped with a wide choice of powerful measurement tools including 3-point circle functionality, Npoint circle measurement functionality, parallel line distance measurement, perpendicular distance measurement and object distance measurement. In addition, a zoom-in window can be used to determine the accurate measuring point of an object.Once you've measured a specimen you can easily export all of the images, measurement data and statistics to an Excel® file. With iSolution Lite, comprehensive statistics and data are just one effortless mouse click away.Line ProfilingSingle, multiple, parallel and polyline commands provide Gray/Red/Green/Blue intensity values for specific lines within an image. The profile data of each pixel on the line can be exported to MS Excel. Auto TraceUsing an automatic edge detection algorithm, our software will perform an auto trace measurement function around a closed object. This function greatly increases accuracy and saves time when making measurements of complex shapes.Image ProcessingManual Brightness, Contrast, Gamma, Background Subtraction, Shading Correction, Histogram, Clone, Crop, AOI, Resize, Rotate, Split, Merge Monochrome series into RGB Color, Combine different exposure Images for highlight reduction, Image Mode Change, Grayscale, RGB, HSB, YUV Pseudo Color view, Full range of enhancement and morphology filters 8bit and 16bit per channel Manual MeasurementsPoint Count, Straight Line, Circle by radius, Circle by N points, Circle by diameter, Circle by 3 points, rectangle, polygon, polyline, splice lines from a common point, auto trace, angle parallel lines, perpendicular width, perpendicular from common line, angle between 2 lines, distance, perpendicular distance.Shading CorrectionThe edge parts of captured image by low magnification have background shading frequently, which can be removed by the shading correction function. The color of the original image remains the same though. A standard image is acquired from a blank space on the slide glass, or from an out of focus image in a metallurgical specimen. Such a standard image is used to correct the background shading of all other captured images.AnnotationLine, arrow, polyline, spline, rectangle, ellipse, textRegion of Interest- ROI. . . . with unique add/subtract capabilityRectangle, arbitrary rectangle, circle, arbitrary ellipse, polyline, spline, magic wand ROI itself can be saved to work with other images. The saved ROI can be placed on the exact same location of other images.View and Zoom ImageManual zoom In-Out, User Defined, Fit to Window, 1600% Zoom in Window for Accurate Edge Detect, sizeable context Window to view all open ImagesImage EditingUndo, Redo, Copy, Paste, Paste New, Delete, Delete All, Annotate, Image InformationSave OptionsTXT File Format, image and measurement data together in Proprietary .img File Format for future editing and data collectionSupported Image File Formatsjpg, jpeg, tif, tiff, bmp, gif, pcx, tga, mpg, mpeg, avi, mov, img, rpt, txt and etc.Report GeneratorCreate Report, Insert Image and Data, Insert other OLE ObjectsWindow ViewSplit Horizontal, Split Vertical, Cascade, Tile Horizontal, Tile Vertical, Arrange icons, Dynamic User Interface (UI), Classic, ModernTime Lapse Sequence ControlPlay Forward, Backward, Making Movie File (mpg, avi, mov) with Still Images, Split Single Image from Sequence FilePerfect Focus EnhancementiSolution FL implements a perfect function of focus compensation irrespective of the status of lights and specimen.Reflected Light SubtractioniSolution FL creates clear, evenly illuminated images by removing the bright saturated light from a highly reflective sample.System Requirements• PC with a Pentium-class processor; Pentium 300MMX or higher recommended• Microsoft Windows Win7/Vista/WinXP/2000/ME/Win98SE operating system• 32 MB of RAM or more (128 MB recommended)• 15 MB or more hard-disk space (50 MB recommended)• CD-ROM drive• VGA or higher-resolution monitor; Super VGA recommended (1024 x 768 pixel and 24 bit and more color support video card is recommended)• Microsoft Mouse or compatible pointing device• USB- or LPT-port for hardware key (depends on delivery).Supported imaging devices1. TWAIN Driver2. DirectShow/ WDM (Windows driver mode) driver3. i-Link DevicesAll PixeLINK cameras.Optronics digital cameras- MicroFire- MacroFire- QuantiFire and QuantiFire XI- Microcast- All MPX series cameras- All QPX series camerasJenoptik ProgRes digital cameras- C3 (cooled and non-cooled)- C5 (cooled and non-cooled)- C14- ProgRes CF and CFScan (cooled, non-cooled, and scan)- ProgRes MF (cooled, non-cooled, and scan)-ProgRes all CMOS cameras.Nikon digital cameras- DS-U2 Fi1- DS 5M/2M-U2- DS 5M/2M-U1- DXM 1200C- DXF 1200FPixera digital camera- Penguin series all models- Pro series all modelsScion corporation digital camera-CFW series all modelsMatrix vision-mvBlueFox digital cameraArtray- ARTCAM-500MI- ARTCAM-300MI- ARTCAM-200MI- ARTCAM-130MI (color, mono, and NIR) - ARTCAM-036MI (color, mono, and TWIN) - ARTCAM-500P- ARTCAM-200SH- ARTCAM-150P-II (color and mono)- ARTCAM-098 (color and mono)- ARTCAM-34MCLumenera- Infinity 1 series all models- Infinity 2 series all models- Infinity 3 series all models- Infinity X and Infinity X-21XLi camera- M series cameras- DC series cameras- DX series camerasSpot digital camera- Insight- FlexQimaging digital cameras- MicroPublisher- RetigaAll Leica digital cameras by TWAINCarl Zeiss AxioCam by TWAINFlashBus frame grabber- Spectrim Lite- Spectrim Pro- MV LiteMatrox frame grabber- Meteor IIAvermedia frame grabber- EZMakerConsumer digital camerasIMT i-Solution Inc. 。
ImageLab中文操作手册

Image Lab™中文操作手册F a s t a n d R e l i a b l eImage Lab 全自动图像获取和分析软件用于Molecular Imager ChemiDoc™ XRS+、Molecular Imager Gel Doc™ XR+ 和 Criterion Stain Free TM 成像系统,可应用于凝胶电泳和转印膜的数字成像和分析,而自动化的工作流程能加速图像获取步骤及参数优化,并针对调整好的凝胶或转印膜影像进行系统性分析,进而得到所需的分析数据结果。
一、软件操作界面启动精灵程序桌面主窗口工具列分析工具列状态列1. 主窗口工具列a ta2. 显示工具列3. 分析工具列(1)图像工具(Image To ols)(2)泳道及条带工具(Lane and Ban d To ols)(3)分子量工具(MW Molecular W e igh t)(4)自动定量工具(Q u anti ty Too l s)(5)注释工具(A nnot a tion To ols)(6)手动定量工具(V o lum e To ols)二、使用Image Lab 软件进行化学发光图像获取流程1. 建立图像获取程序:放大图像显示设定缩小全窗口大小亮度明暗度转换改变图像色彩转换3D成模式像图像信息在凝胶成像(Gel Imaging)对话框中选择Chemi(化学发光)应用程序(1)在成像区域(Imaging Area)对话框中的下拉式选单中选择合适的样品大小(非必需,可之后通过Position Gel选择)(2)选择成像曝光(Image Exposure)方法,可以人为评估曝光时间并以手动设定(Manual Exposure),或是使用信号累积模式(Signal Accumulation Mode,SAM)来进行操作。
在建立一个化学发光的程序时最难的任务就是图像曝光的确定,因为您想获得一个充分利用了相机大的动态范围的图像。
ImageQuant TL 8.1操作指南说明书
ImageQuant TL 8.1操作指南引言●IQTL是一款多功能定量分析软件,能够对蛋白条带、克隆计数、96孔板进行定量分析。
对于工业用户,其对蛋白分子量及纯度的分析尤其适用。
●IQTL 软件对分析图片有一定的要求,要求图片由专业的分析成像设备拍摄,图片格式应为.gel或16bit .tif。
●若图片为8 bit RGB格式,即相机拍摄格式,需要用第三方软件(如photoshop)将格式转换为16 bit .tif灰度图像。
1)打开软件双击桌面ImageQuant TL 图标,弹出control centre对话框,IQTL分析软件提供多种分析模式。
●1D gel analysis 适用于分析一维凝胶电泳分析,如SDS-PAGE或IEF凝胶,也适用于对western blotting结果进行定量分析●Analysis toolbox 适用于对图像进行区域分析●Colony counting 适用于培养皿培养的菌落进行计数●Array analysis 适用于对斑点进行定量分析,如斑点杂交,蛋白芯片等。
1.1菜单栏选中进入分析模式后,菜单栏显示如下:File—可以对图片进行打开、保存、另存为、叠加、反色计算、查看信息、打印设置等操作;Edit—可对数据进行导入导出等操作;View—可选择显示涂层,调节图像色彩、对比度等;Analysis—选择图像分析步骤;Object—调整对象Window—调整窗口Help—帮助1.1.1图像叠加IQTL软件提供对相同大小图像进行叠加的功能。
要求需要叠加的图像在同一文件夹中,图像大小完全一致创建的叠加图片在同一文件夹中1)点击File—Create Multiplex Image2)弹出Create Multiplex Image对话框3)在Name中输入叠加后图片名称4)点击Browse,选择需要叠加的图片,点击open打开5)点击Create,创建图片,创建的图片格式为.ds。
【膜分离】AKTApure操作培训教程
3.1 使用脱盐柱进行蛋白缓冲液的置换 .................................................................................................................... 79 3.2 离子交换层析实验.................................................................................................................................................... 86 3.3 应用亲和层析纯化 His 标签蛋白 ......................................................................................................................... 98
目录
1. 新装 Unicorn 软件的基本设置.......................................................................................1
1.1 系统设置.........................................................................................................................................................................1 1.2 新建用户及权限设置 ..................................................................................................................................................3 1.3 系统默认参数设置.......................................................................................................................................................4 1.4 校正..................................................................................................................................................................................5
分析测量图象软件Imagepro(DOC)
分析测量图象软件Imagepro-Plus教程一、入门Imageproplus(IPP)的主要用途是分析测量图象。
本人使用该程序进行生物图象分析有一段时间,写此帖的主要目的还是与大家交流使用心得,并总结一下使用方法。
如果你是刚接触IPP,最好先从本帖看起,并同时打开你电脑上的IPP程序照着操作。
学会一个软件需要花一段时间的,两分钟不可能学会。
两小时也太短。
但我相信,照着我这几个帖子作下来,至少是可以用IPP干一点事情了。
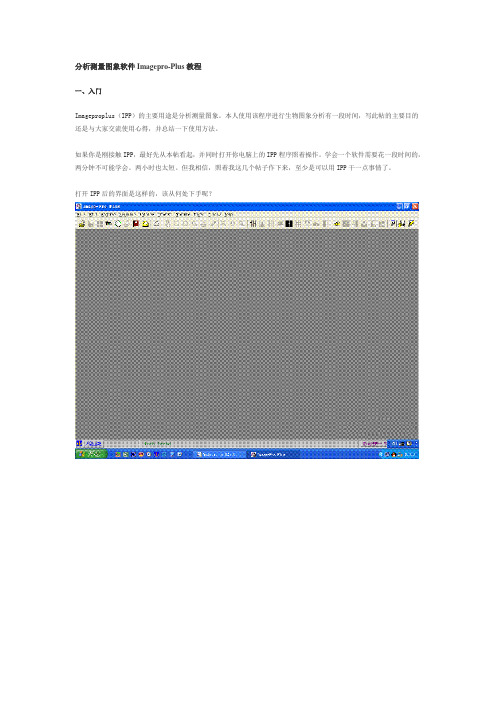
打开IPP后的界面是这样的,该从何处下手呢?既然是处理图片,当然是先要打开一张要处理的图片嘛这张照片中的黄色部分是免疫组化染色的阳性表达成分。
处理目标是通过测量图片中黄色部分的"黄"度来反映相应蛋白表达的的“量”。
对该图片进行观察,可以看到图片中主要有三种主要颜色,一是染成蓝色的细胞核,二是呈现出黄色的胞浆,三是细胞间的空隙区域,呈现出浅蓝色,是为背景。
所以首先要把图片中呈现黄色的区域给挑选出来,这部分区域是我们最感兴趣的地方,叫作AOI(area of interest)。
AOI是IPP中最有用最重要的概念。
如何能够准确地选取AOI就是使用IPP的关键操作。
一旦准确地选取了AOI,下面的测量分析就好办了。
对不同的图片,需灵活地使用各种适当的AOI工具,就这张图片来说,AOI是黄色区域,因此用颜色分类的AOI工具是最有效的。
点击measure---count/size,弹出分类测量窗口在窗口中选中manual,再点击select color,弹出颜色选择窗口segmentation,这个工具是IPP最有特色的颜色选取工具之一。
用好这个工具是使用IPP的要点。
对于目标颜色鲜明的图片,用吸管工具是最简单的。
点一下吸管图标,在目标区域点一下,就可以选中该点的颜色,当然一下是不可能完全选中所需要指定的全部区域,可以在未选中的地方接着再点,这样多次选取,直到把想选中的区域全部选中为止。
gene_tool操作指南
即可自动打开 Excel 程序 显示所有的结果
2 编辑新的 Marker
当 要 编 辑 新 的 Marker 时 在 标 准 分 子 量 对 话 框 Assign
molecular weight 中点击 Edit Standard 如图
再点击 New standard 按钮 出现编辑新 Marker 的对话框 如图
基因公司售后部
一 进入 GeneTools 在桌面上双击软件图标 这时出现选择用户 的对话框 如图
选择用户或输入新的用户名 点击 OK 即可进入 GeneTools 软件环 境 二 确定所分析图片的属性
打开你所分析的图片 这时出现确定该图片属性的对话框 如图
从 Document 中选择图片的种类 Colony Gel PCR Spot blot 从 Electrophoresis direction 中选择电泳的方向 从 Image type 中 选 择 图 片 的 类 型 Fluorescence ( 荧 光 ) Absorption(吸收光) 如果想手动调节选带 则可在 Number of 中输入泳道的数目 若想让软件自动寻道 可设为默认值 0 设置完后 点击 OK 即可进入分析环境
双击 Track1 即可得到第一泳道的波形图 再双击即可取消 该波形图 若依次双击其它泳道则所选泳道的波形同时出现在坐标 中 七 Spot blot 图片的分析
打开一个 Spot blot 图片后 在其属性中选取 Spot blot 然 后点击 OK 打开图片后若软件没有自动寻找到杂交点 可以手 动寻找 在菜单 Spot 中选择 locate 后 软件会自动定义每个杂 交点的位置 同时计算出它们的原始光密度值 如图
三 GeneTools 环境及工具栏的说明
斑点印迹原理、操作步骤及应用
斑点印迹原理、操作步骤及应用一、原理斑点印迹(dot blot)是一种定性检测核酸或蛋白质的技术,其基本原理是硝酸纤维素膜和醋酸纤维素膜具有很强的静电吸附力,在中性条件下即可有效地吸附蛋白质等生物大分子,因而将抗原吸附于纤维素膜后,就可利用纤维素膜作为固相载体进行抗原-抗体反应。
当加入抗体后即可与膜上的抗原结合,然后再加入带有标记物的抗体,使标记通过抗抗体和相应抗体的结合间接地交联于纤维素膜上。
加入标记物相应的底物后,标记物即可与底物作用形成不溶性产物,呈现斑点状着色,从而判定结果。
二、材料免疫斑点印迹所需的材料包括硝酸纤维素膜(或尼龙膜、NC膜),PBS缓冲液,抗原、抗体、标记二抗、相应底物,洗涤液、封闭液,37℃湿盒和温箱。
三、操作步骤免疫斑点印迹根据所用的二抗标记物不同,又可分为:①辣根过氧化物酶免疫斑点试验;②碱性磷酸酶免疫斑点试验;③金银染色免疫斑点试验(使用胶体金作为抗抗体的标记物)等。
其中最常用的是以辣根过氧化物酶标记系统为基础的免疫斑点试验。
具体操作步骤如下:1.抗原包被将0.01mol/L PBS pH 7.4稀释的已知抗原液2μl点于硝酸纤维素膜(或醋酸纤维素膜)上,置37℃温箱中干燥20~30分钟。
2.封闭滴加封闭液37℃温盒中封闭10分钟,用洗涤液洗1~2次,滤纸吸干。
3.抗原抗体结合加用稀释液稀释的抗体或待检标本,置37℃湿盒中30分钟。
4.洗涤用洗涤液震洗3次×3分钟、吸干。
5.加酶标二抗加入经过辣根过氧化物酶、碱性磷酸酶或胶体金标记的抗抗体,孵育、震洗、吸干。
6.显色加相应标记抗抗体的底物溶液显色5~10分钟,终止反应,观察结果。
四、注意事项免疫斑点印迹要求包被的抗原处于最适浓度,多以蛋白质含量500~1000μg/ml为宜。
浓度过高可出现假阳性,过低则降低试验的敏感性。
注意酶结合物的浓度,最适浓度常与包被抗原浓度有关,应根据试验具体条件作方阵滴定来确定。
手把手教你使用Imagepro-Plus(七)——图象分析策略

手把手教你使用Imagepro-Plus(七)——图象分析策略2006-08-03 10:26文章来源: 丁香园点击次数:1127有了图象分析软件,该怎么应用它来分析工作中的图片呢?这就涉及到图片分析的策略。
这并没有一个权威的或者是已经有定论的方法。
因此我在这里只能讲讲我自己作过的一些显微镜图片分析处理的方法。
从我自己的体会来说,几乎每一项分析其策略都不同。
我也不敢说自己的作法就是正确的。
也没有多少文献可供参考。
比如免疫组化染色图片的图象分析方法,查过一些文献,提到图片的数字分析处理时往往就几句话。
有许多还是用图象分析仪测量的。
我怀疑他们自己也没弄明白具体的分析策略是什么。
有人是这样作的:使用正圆形AOI工具,在一张免疫组化图片上随机选取五个位置,分别测量这五个位置上这个正圆形区域的平均光密度,得到一个平均光密度值与标准差。
我认为这样作是错误的。
因为这个平均光密度值的真值就是这张图片整个的平均光密度值。
因此只要选一个矩形AOI,大小就是这张图片的尺寸,其平均光密度值就是刚才那个平均值的真值,没有标准差。
要作好免疫组化图片的数字分析,从拍摄显微镜照片时开始就要考虑操作细节了。
作切片时要保证各个切片条件的一致就不说了,在使用数码相机拍摄切片照片时得注意什么呢?1.显微镜的亮度要前后保持一致。
这包括电源的电压要稳定,最好给显微镜加稳压电源,光源亮度调节在拍摄一组照片的过程中不能动,聚光镜也不能调。
2.数码相机不能用自动调节设置,全部用手动设置。
包括曝光时间、变焦、光圈。
还有一个很多人都想不到的地方:自动白平衡功能要关掉。
前面的照片中有几张看上去背景是浅蓝色的,这就是数码相机的自动白平衡功能在起作用。
因为整个画面都是黄色的染色,相机就会认为画面色温偏低,要进行一下较正,给加点蓝色吧。
浅蓝色背景其光密度与浅黄色的阳性区域差不多,这样就给准确测量光密度带来了更大的误差。
3.拍摄荧光照片时自动曝光所带来的影响更大。
医疗图像处理软件的使用方法总结

医疗图像处理软件的使用方法总结医疗图像处理软件是医学影像领域中非常重要的工具,它能够帮助医生和医学研究人员对医学影像进行处理、分析和诊断。
本文将总结医疗图像处理软件的使用方法,帮助读者更好地理解和应用这些软件。
首先,我们需要了解医疗图像处理软件的基本功能。
医疗图像处理软件通常具备以下功能:图像导入和导出、图像重建和增强、图像分割和标注、图像配准和对齐、图像测量和分析、图像编辑和制作报告等。
掌握这些功能是使用医疗图像处理软件的基础。
其次,我们需要学会如何导入和导出图像。
在医疗图像处理软件中,图像通常以DICOM(数字图像与通信在医学上)格式保存。
因此,我们需要先将医学影像设备(如CT、MRI等)获取的图像转换为DICOM格式后,才能在软件中进行处理。
一旦图像导入软件,我们可以对其进行编辑、分析和保存。
在导出图像时,我们可以选择不同的格式,如JPEG、PNG或者DICOM等,以便后续使用。
第三,我们需要掌握图像重建和增强的方法。
医学影像中的噪声和伪影对诊断结果具有影响,因此图像重建和增强是医疗图像处理软件中的重要功能。
图像重建技术可以通过对多幅图像进行重建,提高图像质量和分辨率。
图像增强技术可以调整图像的对比度、亮度和锐度,使医生能够更清晰地观察图像细节和异常区域。
第四,图像分割和标注是医疗图像处理软件中的关键功能。
图像分割可以将医学影像中的组织、器官或病变区域进行分离。
常见的图像分割方法包括阈值分割、边缘检测、区域生长等。
图像标注则是给图像中的特定区域进行标记,方便医生进行定量分析和诊断。
在使用图像分割和标注功能时,我们需要根据实际需求选择合适的算法和参数,以达到最佳分割和标注效果。
第五,图像配准和对齐是医疗图像处理软件中的重要环节。
由于不同医学影像设备获取的图像存在位置和角度的差异,对于多模态图像或者时间序列图像,需要将其进行配准和对齐。
图像配准可以校正图像位置和角度的偏差,以便进行准确的分析和比较。
DYNACAM A设备扫描免疫印迹图像设备操作和维护手册说明书

DYNACAMA device for scanning immunoblot imagesDevice operation and maintanance manualThe information contained in this manual are required for operation of this device. Therefore, please, read this manual carefully. Take notice of the notes related to safe operation of the device.CopyrightCopyright © Revised 2008 DYNEX TECHNOLOGIES, spol. s r.o.All rights reserved. No part of this document can be copied, transcribed or altered in any way, electronically or mechanically, including photocopying and recording for any purpose other than the use by the buyer without a prior written permission of DYNEX TECHNOLOGIES, spol. s.r.o.Restrictions and dutiesThe information contained in this document can be changed or adjusted and are not binding for DYNEX TECHNOLOGIES, spol. s r.o. Changes made will be introduced in the new publication of this manual.DYNEX TECHNOLOGIES, spol. s r.o. assumes no liability for usage or safety of devices and software which are not supplied directly by the manufacturer or authorized distributor.Manufacturer:DYNEX TECHNOLOGIES, spol. s r.o.Vodičkova 971/41110 00 Praha 1Czech RepublicContents:1Revision table (2)2General instructions and safety (3)2.1About the manual (3)2.2Symbols and labels (3)2.3Range of use (4)2.4CE marking (4)2.4.1Directive 2004/108/EC: Electromagnetic compatibility (EMC) (4)2.4.2Directive 2006/95/EC Electrical safety (LVD) (5)2.4.3Directive 2002/96/EC on waste electrical and electronic equipment (5)2.4.498/79/EC on in vitro diagnostic medical devices (6)3Device description (6)4Technical specification (7)5Package contents (7)6Device transportation, installation and assembly (8)6.1Device transportation and unpacking (8)6.2Environment requirements (8)6.3Device assembly (8)7Device control description (9)8Software (10)8.1Test interface description (10)8.1.1Basic window (10)8.1.2Setting of plate type window (13)9Maintenance (16)9.1Device cleaning (16)1 Revision tableRevision Date Changes0 7-14 First publication1 4-15 Changes in the controlling SW2 General instructions and safety2.1 About the manualThe device operation and maintenance manual is meant for users of this DYNACAM device (e.g. laboratory technicians) and provides information about this device. The manual contains instructions needed for the installation, operation and general maintenance of this device.Please read the whole manual before you start using the device. Place the manual near the device for easy access by anyone using it.2.2 Symbols and labelsThese symbols will provide you with basic information as well as alert you to possible danger.I On0 OffIn vitro diagnostics medical deviceWarning: danger of damaging your health or your immediate surroundingsManufacturerDate of manufactureSeparate collection of electrical and electronic equipment2.3 Range of useDynacam is a device for scanning images of immunoblot and Westernblot strips according to specifications described in this manual.The device is intended only for …IVD – In Vitro Diagnostic“!All image scanning methods must be validated by the user in combination with the system in accordance with the appropriate laboratory practice and local laws before using the DYNACAM device for IVD.The device can only be used by laboratory technicians instructed in its use.The device can only be used in accordance with the designated range of use.Caution: If the user uses the device in a different way than intended by the manufacturer the safety of work equipment might be violated.2.4 CE markingThe product holds CE marking based on the directives below and information in the manual.*For more information see Declaration of Conformity.2.4.1 Directive 2004/108/EC: Electromagnetic compatibility (EMC)The device was tested by an independent accredited test laboratory, which found the device to meet requirements of technical norm ČSN EN 61326-1 Electrical equipment for measurement, control and laboratory use - EMC requirements - Part 1: General requirementsMeasurement of radiated disturbancesTesting and verification was carried out in accordance with technical norm EN 55011Class B Indus-trial, scientific and medical equipment– Radio-frequency disturbance characteristics Limits and methods of measurementResistanceThe device was tested by an independent accredited test laboratory, which found the device to meet requirements of technical norm ČSN EN 61326-1 Electrical equipment for measurement, control and laboratory use - EMC requirements - Part 1: General requirementsTesting and verification was carried out in accordance with the following technical norms:ČSN EN 61000-3-2 Electromagnetic compatibility (EMC) - Part 3-2: Limits - Limits for harmonic current emissions (equipment input current ≤16 A per phase)ČSN EN 61000-3-3 Electromagnetic compatibility (EMC) – Part 3-3: Limits. Limitation of voltage changes, voltage fluctuations and flicker in public low-voltage supply systems, for equipment with rated current ≤ 16 A per phase and not subject to conditional connection.ČSN EN 61000-4-2 criterion A Electromagnetic compatibility (EMC) - Part 4-2: Testing and measurement techniques - Electrostatic discharge immunity testČSN EN 61000-4-3 criterion A Electromagnetic compatibility (EMC) - Part 4-3: Testing and measurement techniques - Radiated, radio-frequency, electromagnetic field immunity testČSN EN 61000-4-4 criterion A Electromagnetic compatibility (EMC) - Part 4-4: Testing and measurement techniques - Electrical fast transient/burst immunity testČSN EN 61000-4-5 criterion A Electromagnetic compatibility (EMC) - Part 4-5: Surge immunity testČSN EN 61000-4-6 criterion A Electromagnetic compatibility (EMC) - Part 4-6: Testing and measurement techniques - Immunity to conducted disturbances, induced by radio-frequency fieldsČSN EN 61000-4-11 criterion A, C Electromagnetic compatibility (EMC) - Part 4-11: Testing and measurement techniques - Voltage dips, short interruptions and voltage variations immunity tests2.4.2 Directive 2006/95/EC Electrical safety (LVD)The device was tested by an independent accredited test laboratory in accordance with ČSN EN ISO/IEC 17025, No. 1004.3 and is in accord with provision NV č. 17/2003 Sb., which is in conformity with directive 2006/95/EC as for electrical safety.Testing and verification was carried out in accordance with the following technical norms:EN 61010-1 ed.2:2011 Safety requirements for electrical equipment for measurement, control, and laboratory use – Part 1: General requirements2.4.3 Directive 2002/96/EC on waste electrical and electronic equipmentRecommendation for waste disposalThis device contains printed circuit boards and lead soldered electrical wiring. Dispose of it in accordance with directive 2002/96/EC.When recycling/disposing, contact your supplier. Please note that in the event of contamination of the device it is the duty of the user to secure decontamination of the device before the disposal as well as a certificate of decontamination for his supplier securing the waste disposal.2.4.4 98/79/EC on in vitro diagnostic medical devicesA risk management analysis was conducted for this device. This analysis is a part of company ISO documentation and device CE documentation.3 Device descriptionDYNACAM is a tabletop device for scanning images of immunoblots and Westernblots placed in plate wells in which the processing of tests took place.Scanning is carried out by a monochromatic CCD camera. Green LED lights are used as a source of light for image scanning. Strips are scanned one by one.The device is equipped with an appliance for forced airflow around the plate for acceleration of the needed drying of strips before scanning.The plate with strips is inserted into a drawer in the front part of the device. The construction of the drawer lets it to be used with plates of different dimensions and different number of wells. The device is controlled by a PC using a USB connection with it.Selecting of functions is carried out by DLL libraries. These are used by the creators of SW for evaluation of image data.For system operation validation it is possible to run the control SW on display (for description of functions see below).Description of connection ports on the rear side of the devicePower switch USB Device control4 Technical specificationControl of device By PC using SW Dynacam dll interfaceOperating system Windows 7, 32 or 64 bit and higher Communication with PC 2 x USB 2Image scanning principle CCD camera, 5 Mpixel, monochromatic Resolution 500 DPICamera viewing area 460 x 130 mmLED lighting dominant wavelenght 525 nmDrying of strips Airflow with an ambient temperaturePower 22 - 24 V DC (e.g. Switch adapter 100-240V, 50-60Hz)Fuses T2,5 A 250 VMaximum power input 85 VAAverage power consumption during35 VAoperation assaysDimensions 620 mm(W) x 390 mm(D) x 270 mm(H)Weight 15,5 kg5 Package contents1.DYNACAM2.Switching adapter 100 – 240 V 50Hz / 24 V DCB cable 2 pcs4.Operation manual6 Device transportation, installation and assembly6.1 Device transportation and unpackingThe device and its components are transported in special shipping packaging protecting them from damage.Before unpacking the device please check its packaging and then the device and allaccessories. In the event of the device or its packaging being damaged pleaseimmediately contact both the shipping company and the contact person of theauthorized supplier. Keep the packaging for inspection by the carrier. A representativeof the manufacturer shall provide immediate repair or replacement of the device. Unpack the device and its accessories and check the completeness and condition of each item according to chapter Package contents.In the event of damage of some part of the shipment or its incompletion, contact DYNEX TECHNOLOGIES, spol. s r.o. or its representative.6.2 Environment requirementsThe device is intended for indoor use. Place the device in the room so it is protected from too much dust, vibrations, strong magnetic field, direct sunlight, draught, high levels of humidity or significant temperature fluctuations.Operating temperature:+5°C - + 40°CIMPORTANT: If the device was exposed to temperatures outsidethis range, it has to be let to temper itself before turning on to beable to properly function in given temperature range. Neglectingof this procedure may lead to damaging of this device.Storage temperature: 1°C – 50°COperating altitude: up to 2000 msl80%, non-condensingMaximum relativehumidity:6.3 Device assemblyPlace the device on workspace so that the power switch is accessible. In front of the device there has to be enough space for the plate well drawer to eject. It is convenient to place the control PC within reach of the device, preferably on its right side.Plug the external power supply power cord into an electrical outlet. Plug the output power cable into the power connector on the right rear side of the device.Connect the control PC with the corresponding SW installed using two USB cables with plugs on the rear side of the device (its order is not important).Caution! The power supply must be plugged into an electrical outlet providing voltageand current in ranges shown on the source label. Using incompatible electrical outletmay cause electric shock and cause fire hazard.7 Device control descriptionTurn the device on using the switch on its rear right part. Flashing of green/red LED light on the front of the device indicates that the device is switched on.Turn on the PC and run corresponding SW.Eject the plate well drawer and place the spacer according to the type of plate being used.Put the plate with strips into the defined space. Make sure it is freely movable in anteroposterior direction. That will allow the plate to take correct position when the drawer is closed.Insert the drawer into the device and make sure the springs closed the drawer all the way.Carry out drying and image scanning using the control SW.Afterwards take the plate with strips out of the device.8 SoftwareSW package is used to control the DYNACAM device. Using the function offered the device is controlled by the software for evaluating the results of samples. Necessary information for DYNACAM control implementation are shown in a document “DYNACAM interface”.Direct run of the program Dynacam.exe from the SW package can be used for a trial of its functions.A test interface is opened and the device can then be controlled using elements shown in the window on display. In the event of running of this program using DLL library the window is not shown on the screen and user controls must be a part of the superordinate software.8.1 Test interface description8.1.1 Basic windowIn the directory in which DYNACAM SW package is located find the Dynacam.exe file. Double-click it to run. A window opens:Buttons and fields description:Open MachineCarries out connection and initialisation of the device. If there is a symbol * in the field Serial Number, any device connected to the PC is initialised. A specific device is connected by typing its serial number into this field. A part of initialisation is a performance of self-test. The arm with camera assumes a default position and for a short period of time the drying fans and inner lighting start up.After the self-test is carried out successfully, green LED indicators light up.Close MachineStops the communication between the device and PC.Start ScanPreparation for scanning of strip images. Before using this button it is necessary to choose the plate well type being put into the device in the field Tray Name. Clicking on the arrow on the side of the field unrolls a menu with names types of plate wells. Items on the list correspond to xml files, which contain parameters of each type of plate wells and are saved in the directory C:\ProgramData\Dynex\Dynacam\Data\Trays.After the device receives the Start Scan command, the indicatory LED light begins to flash.StopCancels the readiness of the device to scan. The arm returns to its default position and inner lighting is turned off. After the device receives the Stop command its LED light is green.Scan TrayExecutes the scanning of strip images according to the type of plate well set at Start Scan. Exposure time is set in milliseconds in the Exposures field. If multiple scanning of every strip with different exposure times is required, all times are entered into the field divided by a semicolon. Files with the scans are saved in a directory shown in the field Save Directory either absolutely by showing the whole address or relatively (e.g. ./Images/), where the certain directory is in the directory where Dynacam.exe is. Image files are automatically named in the format “image_01_30.png” where the first number means the position of the well and the second means exposure time in milliseconds.Get Strip ImageScans a strip image in a well with a serial number shown in the field Strip or with exposure time according to the value set in the field Exposure time. The image file is saved identically with the previous function. If Increment strip is marked, the value in the field Strip is automatically incremented after every scan.Start DryingStarts the drying of strips. Fans are switched on and the arm inside of the device performs movement over the whole workspace of the plate well drawer. The progress of drying can be put together based on four profiles (Profile 1 – Profile 4). Every profile contains a number of cycles (Cycles) and a fan output (Fan [%]). The number of cycles defines the time of drying. One cycle means a movement of the arm from its default position to the second lateral one and back. One cycle lasts 1 minute. The output of the fan is set in values 0 – 100 %. After beginning of drying the cycles are successively executed in the order 1 – 4. If the cycle is not used the value in the field Cycles will be set to 0. During drying a green LED indicator flashes. After completion of the drying cycles the fan in the rear wall of the device stays turned on for another 40 seconds to ventilate the residual humidity. StopStops the drying process before reaching the set number of cycles. After pressing the button the device finishes the arm movement in progress and then ends drying. It can take up to 30s.Tray SetingsOpens dialog window for creation of collection of parameters of the new plate of strips (see the next chapter).In the Camera Machine Status frame are the instrument status indicators and some performance information. Red colour indicates non active state, while green indicates active state.Machine ConectedActivates after the command Open Machine if the PC and the device are successfully connected. Camera ConnectedActivates after the command Open Machine if the PC and the camera in the device are successfully connected.SelfTestActivates after the command Open Machine if the device self-test is performed successfully. OPENEDActivates after the command Open Machine when the initialisation sequence is performed successfully.SCANActivates after the command Start Scan if the scan conditions are fulfilled.DRYINGIt is active during drying cycles.Remaining CyclesDuring the drying shows the number of remaining drying cycles.Drying FinishedActivated during the drying of strips after finishing all the set drying cycles. It stops to be active after the command Open machine or Start Drying.Last ErrorNumerical designation of the last generated error. If the numbers are 0-0, there was no mistake.Last ErrorText description of the last generated error.There are also these areas in the window:Image panel in which the last scanned image is displayed. By right-clicking on it the dialog Save As is opened. This allows the creation of a file of this image.Detail panel with internal performance information between the PC and the device.8.1.2 Setting of plate type windowThere has to be created an xml file with parameters for every plate well being used. The name of the file corresponds with the name of the type of the plate. Files saved in directory C:\ProgramData\Dynex\Dynacam\Data\Trays are displayed in the field Tray names. Parameters of a type of plate define a position of the arm when scanning the first well, the arm’s shift offset between two neighbouring wells, Area of interest (AOI) of the camera view during scanning.A combination of these parameters enables an exact setting of the characteristic of the scanned image with respect to the lighting of strips and elimination of light reflection in the well walls of different shapes.An example of strip plate parameters:<?xml version="1.0" encoding="utf-16"?><TrayData><WellOffset>574</WellOffset><FirstWellPosition>200</FirstWellPosition><WellNumber>44</WellNumber><AoiWidth>2224</AoiWidth><AoiHeight>110</AoiHeight><AoiLeft>164</AoiLeft><AoiTop>874</AoiTop></TrayData>Pushing the Tray Settings button in the basic window opens a window in which it is possible to choose an existing plate or set up a new one.1. First stripSet a position of the arm over the first well of the plate using buttons in the Machine – X axis area and a live feed. An actual position of the arm is displayed in the upper part of the area (Coordinate). Buttons with symbols + and – move the arm a number of steps set in the neighbouring fields. The Go REL button similarly moves the arm a value in the neighbouring field (it can attain positive or negative values). The Go ABS button moves the arm into the position absolute coordinate (max. value is approx. 30800).Specification of the boundaries of the focus is done by sliders Width, Height, Left and Top. Brightness of the live feed can be set by the Exposure time slider (this value is not saved into the parameters). When the mark Area Of Interest is checked, only a selected area is displayed in the live feed area Image. A complete camera view is displayed by unchecking the AOI mark. The complete camera view eases the AOI placing decision in the terms of mirror geometry and inner lighting (suppression of reflections and shadows).2. Last stripSet the focus on the last well of the plate using the buttons in the Machine – X axis area as well as live feed.3. TrayFill the Tray name and Well number fields (The name of the strip plate and the number of wells).Create the parameter file by pressing the Save button.9 MaintenanceThe device is relatively maintenance free. It is important to keep the surface where the plate is inserted clean. The plate must be able to move as it adjusts itself into the correct position after the drawer is closed.9.1 Device cleaningClean both the surface of the device and the surface inside the drawer. If particularly dirty, use detergent.Use isopropanol to clean the surface of the drawer.Cleaning of the optical system components under the cover of the device must be carried out by a service technician during regular inspections of the device.。
ginkgo-cadx 用法
ginkgo-cadx 用法
Ginkgo CADx是一款开源的医学影像查看器,主要用于查看和
处理医学影像数据,如CT扫描、X射线、MRI等。
它提供了丰富的
功能和工具,使医生和医学影像专业人员能够准确地诊断和分析医
学影像。
使用Ginkgo CADx,用户可以打开和查看DICOM格式的医学影
像文件,进行放大、缩小、旋转、测量和标注等操作。
此外,它还
支持多种图像处理和分析工具,如对比度调整、滤波、三维重建等,帮助用户更好地理解和分析影像数据。
对于临床医生和影像专业人员来说,他们可以利用Ginkgo CADx来快速查看患者的影像数据,进行诊断和治疗计划。
同时,Ginkgo CADx还支持与医院信息系统(HIS)和放射信息系统(RIS)的集成,方便用户管理和共享影像数据。
除此之外,Ginkgo CADx还具有跨平台的特点,可以在Windows、Linux和Mac OS等操作系统上运行,为用户提供了更大的灵活性和
便利性。
它的开源特性也意味着用户可以根据自己的需求进行定制
和扩展,满足不同医疗机构和个人用户的特殊需求。
总的来说,Ginkgo CADx是一款功能强大、灵活性高、易于使用的医学影像查看器,为医学影像领域的专业人员提供了强大的工具和功能,有助于他们更准确地诊断和治疗患者。
Imatest解析度及色彩测试方法

STE 红色白平注: STE 点击录下若弹EP 1 打开色标注SFR:平衡 软件。
SFR:New Color Che EP 2 解析1) 打开软击SFR:New 下,如附图弹出ROI Re 开Imatest :New Filew File 使用条eck 使用条件析度测试方软件,选择File ,弹出红色标示peat 对话框t 软件为测试 解条件‐‐‐‐‐‐‐ C 件‐‐‐‐‐‐‐ Cha 方法择要测图片出路径对话框“解析度测框,点击左解析度软件;hart 为标准art 为标准框,讲需要测试.jpg ”左下角NO 即 Colorche 准ISO 122324色卡,要测试的解析即可eck 为测试33 ,拍摄4正对拍摄析力图片C 试色彩还原性4:3 满屏,充满24色COPY 至当前性、色位 前目弹出弹出此时2) 选择需出红色标出SFR ROI s 出SFR Data 3) 保存计时弹出下图需要测试区出现下图图片标示区域(selection 对对话框,点计算出的数对话框,其区域片时,鼠标大小适中即对话框,点击点击下面“数据及图片其中“Save 标左键按住不即可,无明击下面“YE “OK ”按钮即SFR Result 不动,在图明确规定)。
ES ,Continue 即可。
t ”为保存当图中黑白交界e ”按钮即可当前测试数界出选定如可。
数据及图片,如图,点击”Y 有两绿色STE鼠标注意YES”选择保两张图,下色部分即为P 3 色彩还1) 点击C 前路径标左键框选意:框选区保存路径;下图为我们需解析力读数还原性及白平Color Check 径下,若弹选如上图红色区域不可超出“Figure NO 需要看的,数,LW/PH 平衡测试k 按钮,弹弹出ROI Rep 色标示, 出24色块.1 cycles/pi 红色字体部为单位。
出路径对话peat 对话框ixel ”为我们部分,MTF5话框,将需框,点击左下们需要测试50(corr) …..要测试的图下角NO 试的数据,表. =1057LW/图片COPY 至表中/PH 至当点击点击彩还结果各色一般击”YES,Cont 击”OK”,出还原性测试果,一般控色系的偏移般30万像素tinue”;出现现一系列测试结果,第一控制在100%移值,ΔE 提素ΔE*ab me 现如下图对话测试结果,一项“Mean %~120%之间提供了平均色ean < 25,话框。
TK点印迹图像分析软件使用说明

TK点印迹图像分析软件(版本2.0)使用说明1.实验分析软件初始化1.1 软件初始化1.1.1 初次使用TK点印迹图像分析软件须对软件进行初始化1.1.2 双击桌面上的“TK点印迹图像分析软件”图标,弹出对话框(如图1),以用户名“admin”和密码“hope”登录,点击“确定”,弹出图2对话框,继续点击“确定”;图1图21.1.3 此时出现图3界面,点击左上角的“管理”,在下拉菜单中选择“系统初始化”,点击后出现图4对话框;图3图41.1.4 填写完相关信息后,点击“初始化”; 1.2 添加操作员1.2.1 此时回到图5界面,选择“操作员管理”;图51.2.2 在弹出的对话框中(如图6),填写操作员姓名,密码,并在右边多选框内设定操作员权限,设定完后,点击“保存新操作员”,然后“确认”、“关闭”;图61.2.3 关闭程序后,重新双击桌面图标打开,在登陆框中以保存的操作员登陆,即可进入软件操作界面。
2.分析仪软件操作程序2.1 新建实验2.1.1双击桌面软件图标,打开程序,在弹出的登陆框(图7)中,以已保存的操作员登陆,进入软件操作界面;图72.1.2 点击“新建实验”,按提示输入内容。
(如:图8)注意:“开始时间”和“结束时间”不能相同。
图82.2 实验图像的获取:2.2.1 拍摄实验图像:2.2.1.1 建完实验后,点击“实验”,选择“读取CCD图像”(如图9),弹出“CCD管理器”对话框(如图10),在该对话框中,可以设定拍摄和预览时间,区域合并方式及输出同步模式等参数;图9图10推荐参数为:曝光时间60秒;预览时间50毫秒;区域合并 X方向2像素,Y方向2像素;输出同步模式为 Alternate Normal。
各参数可根据具体情况进行调整。
2.2.1.2打开暗箱下门,放入实验模版,点击对话框“预览”部分的“开始”,弹出预览框,对模版位置进行调整,完成后,点击“停止”,关闭预览框;2.2.1.3关闭暗箱门,调整后曝光时间,点击对话框“拍摄”部分的“读取”,进度条开始倒计时拍摄时间(如图11);图112.2.1.4倒计时结束后,会弹出对话框,提示取出模版(如图12);图122.2.1.5取出模版后,点击“确定”关闭提示,再次关闭暗箱门,在不改变拍摄参数的情况下,点击“读取背景”进行背景拍摄(如图13);图132.2.1.6进度条完成后,背景图片将自动保存,此时点击“完成”,显示拍摄结果;2.2.1.7背景处理:点击菜单栏的“图像”,在“预处理”的下拉菜单中选择“背景消除”(如图14),弹出操作对话框,点击“预览”可观察图片经过“背景消除”的情况,点击“还原”恢复为未经过“背景消除”的图片;图14点击“预览”,并“确定”后,经过“背景消除”的结果被保存(如图15);图152.2.1.8点击“文件”选择“另存为”将经过背景处理的实验图片(如图16),保存在实验文件夹(以备进行实验的复查等);图162.2.1.9保存好后,点击“文件”,选择“导出为工作图片”,将实验图片转换为工作图片(如图17、18);图17图182.2.2打开已有图像:新建实验后,点击“实验”,选择“打开图像文件”,选择已保存的jpg格式图像,点击“确定”,即可将图像转变为工作图像。
ZEISS ATLAS 9000 顶点图像分析仪操作指南说明书
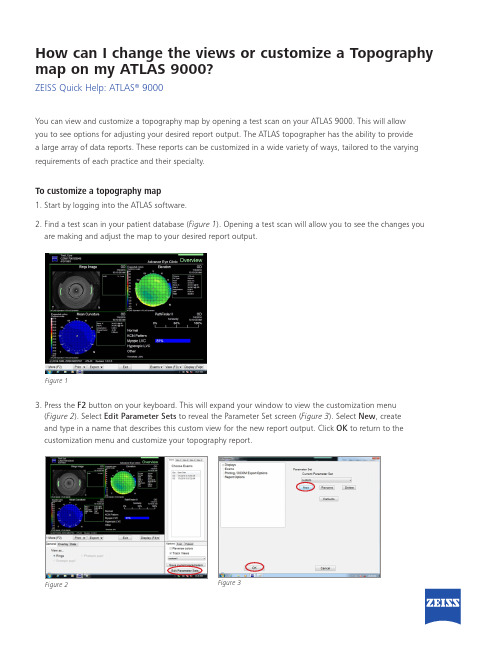
To customize a topography map 1. S tart by logging into the ATLAS software.2. F ind a test scan in your patient database (Figure 1). Opening a test scan will allow you to see the changes you are making and adjust the map to your desired report output.3. P ress the F2 button on your keyboard. This will expand your window to view the customization menu (Figure 2). Select Edit Parameter Sets to reveal the Parameter Set screen (Figure 3). Select New , create and type in a name that describes this custom view for the new report output. Click OK to return to the customization menu and customize your topography report.How can I change the views or customize a Topography map on my ATLAS 9000?ZEISS Quick Help: ATLAS ® 9000Figure 1You can view and customize a topography map by opening a test scan on your ATLAS 9000. This will allow you to see options for adjusting your desired report output. The ATLAS topographer has the ability to provide a large array of data reports. These reports can be customized in a wide variety of ways, tailored to the varying requirements of each practice and their specialty.Figure 2Figure 3To change views1. P ress the Display button and select the desired clinical view from the drop down menu (Figure 4). • T he overview map has quadrants and each quadrant view can be customized with unique displayparameters. For example, when quadrant 1 (top left) is selected (a green border highlight will appear). • W hen you click on a particular view on the map, the corresponding tab view will become active andshow a list of reports that can be selected. (Figure 5)2. O nce you have chosen your desired views for the report, click Save Current Parameters located in the lower right corner of the screen.• Y ou can now use this report when you capture your next image. Consult your local ZEISS ClinicalApplications Specialist for information on specific maps for clinical diagnosis.Page 2 of 2Figure 4Figure 5S E R .8366 P r i n t e d i n t h e U S A C Z -X I /M M X V I T h e c o n t e n t s o f t h i s r e f e r e n c e g u i d e m a y d i f f e r f r o m t h e c u r r e n t s t a t u s o f t h e p r o d u c t i n y o u r c o u n t r y . P l e a s e c o n t a c t y o u r r e g i o n a l r e p r e s e n t a t i v e f o r m o r e i n f o r m a t i o n . S u b j e c t t o c h a n g e i n d e s i g n a n d s c o p e o f d e l i v e r y a n d a s a r e s u l t o f o n g o i n g t e c h n i c a l d e v e l o p m e n t . A T L A S i s e i t h e r a t r a d e m a r k o r r e g i s t e r e d t r a d e m a r k o f C a r l Z e i s s M e d i t e c , I n c . i n t h e U n i t e d S t a t e s a n d /o r o t h e r c o u n t r i e s . © 2016 C a r l Z e i s s M e d i t e c , I n c . A l l c o p y r i g h t s r e s e r v e d .Carl Zeiss Meditec Inc.5160 Hacienda Drive Dublin, CA 94568USA/med Carl Zeiss Meditec AG Goeschwitzer Str. 51-5207745 Jena Germany/med0297Refer to the ATLAS 9000 user manual Instructions for Use for safe and effective operation of the instrument.How can I change the views or customize a Topography map on my ATLAS 9000? | ZEISS Quick Help: ATLAS ® 9000。
TK1检测项目指导手册
第一部分项目运行意义概述胸苷激酶1简称TK1,是一种国际公认的细胞增殖特异性标志物;它参与DNA补救合成途径,是DNA合成的特殊标志酶。
临床上,可用于监测和评估体内细胞的异常增殖速度。
健康人细胞多处于静止状态(非增殖细胞),血清中的TK1酶含量极微,而随着增殖类疾病的发生,尤其是肿瘤、组织异常增生类疾病,细胞发生过度增殖,血清中TK1酶的含量出现显著升高,超过健康人平均水平2倍甚至100倍以上。
所以,通过检测血清中TK1浓度水平的变化,能够敏感地发现细胞增殖异常,动态评估细胞增殖发展趋势,为提前干预治疗高风险癌前病变,遏制肿瘤进程提供重要信息。
在瑞典卡罗琳斯卡大学(诺贝尔医学和生理学奖评审机构)二十多年的研发基础上,华瑞同康生物技术(深圳)有限公司与瑞典Karolinska 大学TK1研究团队共同研制出高灵敏度的胸苷激酶1(TK1)细胞周期分析试剂盒及CIS系列化学发光数字成像仪,该系统是世界上唯一用于临床检验血清中TK1浓度的产品,其特异性高于95%,对各类增殖性疾病的综合检测灵敏度高于70%。
该系统已在多临床领域得到较为广泛地应用:1、独立的肿瘤预后因子:多国家,多机构的研究表明,TK1是优选的预后评估指标,可作为独立的肿瘤预后因子;2、动态评估手术、放化疗效果:能够对各种实体肿瘤(例如:肺癌,胃癌,结肠癌,直肠癌,食道癌,乳腺癌,宫颈癌,前列腺癌等)以及白血病和淋巴癌患者的治疗效果进行评估,为治疗方案的改善提供参考;3、更早评估肿瘤复发风险:对肿瘤康复期患者进行动态跟踪,较影像学更早提示肿瘤复发或转移风险信号;4、评估各类增殖类疾病恶变风险:处于过度增殖的增殖类疾病是肿瘤形成的第一步。
基于TK1与细胞增殖的密切关系,能够灵敏地通过TK1的浓度变化,发现恶性增殖风险,为肿瘤的癌前干预提供了更有效率,更有价值的信息,适用于无疾病人群的恶性增殖风险筛查。
第二部分项目运行准备一.项目环境1、环境参数温度: 24-25℃;湿度:小于65%;实验用水:(1)双蒸水;(2)去离子水;2、实验室设置要求:(1)项目最小占地约8-9平方米;(2)工作区域可放置两张1.5m×0.8m或一张3m×1m工作台;(3)控温设备:30立方米左右的独立空间,可选用2匹的挂式空调进行控温,或选用恒温摇床,如下图:二、项目所需设备1、实验用设备2、实验工具及耗材三、实验样本处理要求及保存样本种类:血清采集要求:1、必须使用无任何添加剂的真空采血管;2、取静脉血2ml(室温);3、建议空腹采血;4、脂血、溶血样本可能造成实验结果的偏差,不建议使用;样本处理:1、采血完成后,室温下静置或37℃水浴至凝固后离心使用;2、离心转速:4000r/min,离心时间:5min;注:室温放置时间不宜超过3h;样本保存:1、离心后的血清如非即时使用,应立即分装,推荐血清分装量100-200μl/管,放置于-20℃保存;2、-20℃保存时间以不超过7天为佳;3、如需长时间保存,建议提高分装量(1.5ml),并放置于-80℃(可保存3年左右);样本运输:1、样本如需外送检验(本市范围内或行程小于3小时),建议采血后先放置于2-8℃静置,到检验点后取出离心,处理要求同上;2、样本如需外送检验(外省市),建议离心后分装至分装管中,血清分装量 1.5ml/管,运输介质建议使用保温箱+化学冰+干冰,干冰用量 2公斤/24小时(根据路程耗费时间增量);样本复融:1、血清使用前需充分振荡混匀;2、冷冻保存的血清样本,需放置于室温完全解冻后使用;3、反复冻融的血清样本严禁使用。
分析测量图象软件Imagepro(DOC)

分析测量图象软件Imagepro-Plus教程一、入门Imageproplus(IPP)的主要用途是分析测量图象。
本人使用该程序进行生物图象分析有一段时间,写此帖的主要目的还是与大家交流使用心得,并总结一下使用方法。
如果你是刚接触IPP,最好先从本帖看起,并同时打开你电脑上的IPP程序照着操作。
学会一个软件需要花一段时间的,两分钟不可能学会。
两小时也太短。
但我相信,照着我这几个帖子作下来,至少是可以用IPP干一点事情了。
打开IPP后的界面是这样的,该从何处下手呢?既然是处理图片,当然是先要打开一张要处理的图片嘛这张照片中的黄色部分是免疫组化染色的阳性表达成分。
处理目标是通过测量图片中黄色部分的"黄"度来反映相应蛋白表达的的“量”。
对该图片进行观察,可以看到图片中主要有三种主要颜色,一是染成蓝色的细胞核,二是呈现出黄色的胞浆,三是细胞间的空隙区域,呈现出浅蓝色,是为背景。
所以首先要把图片中呈现黄色的区域给挑选出来,这部分区域是我们最感兴趣的地方,叫作AOI(area of interest)。
AOI是IPP中最有用最重要的概念。
如何能够准确地选取AOI就是使用IPP的关键操作。
一旦准确地选取了AOI,下面的测量分析就好办了。
对不同的图片,需灵活地使用各种适当的AOI工具,就这张图片来说,AOI是黄色区域,因此用颜色分类的AOI工具是最有效的。
点击measure---count/size,弹出分类测量窗口在窗口中选中manual,再点击select color,弹出颜色选择窗口segmentation,这个工具是IPP最有特色的颜色选取工具之一。
用好这个工具是使用IPP的要点。
对于目标颜色鲜明的图片,用吸管工具是最简单的。
点一下吸管图标,在目标区域点一下,就可以选中该点的颜色,当然一下是不可能完全选中所需要指定的全部区域,可以在未选中的地方接着再点,这样多次选取,直到把想选中的区域全部选中为止。
两分钟学习凝胶分析软件BandScan

两分钟学习凝胶分析软件BandScan(Step by step )转载请注明来自丁香园发布日期: 2005-07-02 12:14 文章作者: palmyard文章编辑: adminStep by step to BandScan>>By Palmyard.按:现在有很多常用的分子生物学软件,但对于初学者,尤其是不太擅长计算机者,使用起来有相当难度。
琢磨说明书,或者自己一点点试验,难免觉得头绪纷繁,乃至兴味索然。
后来我发现,其实用一个实例,从头到尾示范一遍,可以在几分钟内直观地学会这个软件的基本使用方法。
其他的一些情况就可以自己去摸索了,这样学起来很快。
因此我打算做一个常用分子生物学软件STEP BY STEP的系列。
这个想法在心里很久了,但是一直没有时间付诸实践,的确是因为没有较为空闲的时间。
今天就从BandScan这个软件开始。
由于不是很熟悉制作过程,奋战一整天,终于完成了第一个实例学习。
BandScan是一个很常用的凝胶图像分析软件,我们用它重要是为了分析蛋白表达量。
现在,我就以我自己表达的一个蛋白图,来示范这个软件分析的过程。
最后结果是得到目的蛋白占总蛋白的百分数。
1.安装软件BandScan5.0。
主程序可以在网上找到(请搜索以往的帖子或用google搜索BandScan_dl.exe)。
安装以后加个补丁(如果找不到补丁可以email我*****************,这有4.3、4.5和5.0的补丁,请尽量自己先找一下)。
2.安装好以后就会在桌面上出现BandScan的图标。
双击打开。
3.打开后的界面如图。
.打开一张扫描好的电泳图。
BandScan可以识别TIF和JPG格式的图片,很方便。
打开工具栏上的file/open tiff,jpg file format,选中待分析的图片。
5.打开。
这时候凝胶图像显示出来。
1道是低分子量标准,2道是诱导表达的蛋白,3道是未诱导的对照。
Image Lab操作指南
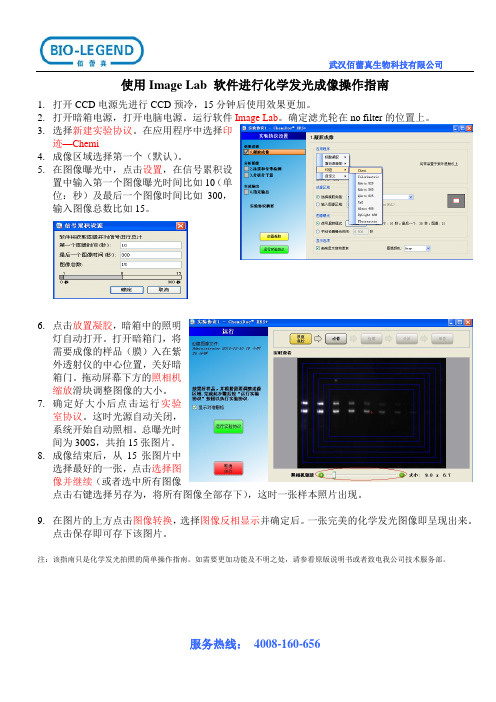
武汉佰蕾真生物科技有限公司
服务热线: 4008-160-656
使用Image Lab 软件进行化学发光成像操作指南
1. 打开CCD 电源先进行CCD 预冷,15分钟后使用效果更加。
2. 打开暗箱电源,打开电脑电源。
运行软件Image Lab 。
确定滤光轮在no filter 的位置上。
3. 选择新建实验协议。
在应用程序中选择印
迹—Chemi
4. 成像区域选择第一个(默认)。
5. 在图像曝光中,点击设置,在信号累积设
置中输入第一个图像曝光时间比如10(单
位:秒)及最后一个图像时间比如300,
输入图像总数比如15。
6. 点击放置凝胶,暗箱中的照明
灯自动打开。
打开暗箱门,将
需要成像的样品(膜)入在紫
外透射仪的中心位置,关好暗
箱门。
拖动屏幕下方的照相机
缩放滑块调整图像的大小。
7. 确定好大小后点击运行实验
室协议。
这时光源自动关闭,
系统开始自动照相。
总曝光时
间为300S ,共拍15张图片。
8. 成像结束后,从15张图片中
选择最好的一张,点击选择图
像并继续(或者选中所有图像
点击右键选择另存为,将所有图像全部存下),这时一张样本照片出现。
9. 在图片的上方点击图像转换,选择图像反相显示并确定后。
一张完美的化学发光图像即呈现出来。
点击保存即可存下该图片。
注:该指南只是化学发光拍照的简单操作指南。
如需要更加功能及不明之处,请参看原版说明书或者致电我公司技术服务部。
T-KING

T-KING007影像式精密测量仪操作规程1.范围:适用于T-KING007影像式精密测量仪用于湿伸缩率的测试。
2 仪器东莞市天勤仪器有限公司T-KING007影像式精密测量仪。
3 仪器校准3.1 在电脑中打开仪器配置软件,在操作台放入标准校正片,移动操作台到任两标准圆处,通过测量标准校正片上两圆心标准间距的方法,来确认仪器是否处于标准状态。
3.2 标准校正片两圆心间距为2.00mm,如3.1中测试结果超出2.00±0.03范围,则用“取比例尺”的方法来校准仪器。
3.3 取比例尺寸3.3.1 选择菜单“工具/自动取比例尺圆”,将标准校正片放于测试玻璃台上,印有“2005”字样一面朝上。
3.3.2在影像绘图区中选择一个标准校正片的标准圆,至其位于十字线的左部(图1),使用鼠标在标准圆内单击,当圆被绘出时即选中了此圆(图2)。
3.3.3 将此标准圆从十字线的左边移至十字线的右边,再次在圆内单击选中此圆(图3)。
3.3.4 将此标准圆从十字线的左边移至十字线的上边,再次在圆内单击选中此圆(图4)。
3.3.5 将此标准圆从十字线的左边移至十字线的右边,再次在圆内单击选中此圆(图5)。
3.3.6 完成了将标准圆左至右,由上到下的操作确认后,按键盘上(回车)ENTER键,即完成了自动取比例尺的全部操作。
图1 图2 图3 图4 图53.3.7 以上取比例尺的操作,也可以通过“选择比例尺”来完成。
3.3.7.1 选择命令“工具/选择比例尺”(如图6),选择软件已保存的0.7倍率所对应的比例尺,即完成操作。
3.4 测试步聚3.4.1 取样取平直无绉的墙纸原纸横×纵宽度为150×100mm,平直放在玻璃操作台中间位置,太偏于玻璃台边沿可能会导致仪器找不到纸边;纸边翘起时可能直尺等在边沿压实。
2017年5月25日批准2017年5月25日实施Q/KAN1205-20173.4.2 打开T-KING软件,移动操作台并调节底灯,至绘图区出现清晰试样左上边缘。
- 1、下载文档前请自行甄别文档内容的完整性,平台不提供额外的编辑、内容补充、找答案等附加服务。
- 2、"仅部分预览"的文档,不可在线预览部分如存在完整性等问题,可反馈申请退款(可完整预览的文档不适用该条件!)。
- 3、如文档侵犯您的权益,请联系客服反馈,我们会尽快为您处理(人工客服工作时间:9:00-18:30)。
TK点印迹图像分析软件(版本2.0)使用说明
1.实验分析软件初始化
1.1 软件初始化
1.1.1 初次使用TK点印迹图像分析软件须对软件进行初始化
1.1.2 双击桌面上的“TK点印迹图像分析软件”图标,弹出对话框(如图1),
以用户名“admin”和密码“hope”登录,点击“确定”,弹出图2对话框,
继续点击“确定”;
图1
图2
1.1.3 此时出现图3界面,点击左上角的“管理”,在下拉菜单中选择“系统初
始化”,点击后出现图4对话框;
图3
图4
1.1.4 填写完相关信息后,点击“初始化”; 1.2 添加操作员
1.2.1 此时回到图5界面,选择“操作员管理”;
图5
1.2.2 在弹出的对话框中(如图6),填写操作员姓名,密码,并在右边多选框内
设定操作员权限,设定完后,点击“保存新操作员”,然后“确认”、“关闭”;
图6
1.2.3 关闭程序后,重新双击桌面图标打开,在登陆框中以保存的操作员登陆,即
可进入软件操作界面。
2.分析仪软件操作程序
2.1 新建实验
2.1.1双击桌面软件图标,打开程序,在弹出的登陆框(图7)中,以已保存的操作
员登陆,进入软件操作界面;
图7
2.1.2 点击“新建实验”,按提示输入内容。
(如:图8)注意:“开始时间”和“结
束时间”不能相同。
图8
2.2 实验图像的获取:
2.2.1 拍摄实验图像:
2.2.1.1 建完实验后,点击“实验”,选择“读取CCD图像”(如图9),弹出“CCD
管理器”对话框(如图10),在该对话框中,可以设定拍摄和预览时间,
区域合并方式及输出同步模式等参数;
图9
图10
推荐参数为:曝光时间60秒;预览时间50毫秒;区域合并 X方向2像素,Y方向2像素;输出同步模式为 Alternate Normal。
各参数可根据具体情况进行调整。
2.2.1.2打开暗箱下门,放入实验模版,点击对话框“预览”部分的“开始”,弹
出预览框,对模版位置进行调整,完成后,点击“停止”,关闭预览框;
2.2.1.3关闭暗箱门,调整后曝光时间,点击对话框“拍摄”部分的“读取”,进
度条开始倒计时拍摄时间(如图11);
图11
2.2.1.4倒计时结束后,会弹出对话框,提示取出模版(如图12);
图12
2.2.1.5取出模版后,点击“确定”关闭提示,再次关闭暗箱门,在不改变拍摄参
数的情况下,点击“读取背景”进行背景拍摄(如图13);
图13
2.2.1.6进度条完成后,背景图片将自动保存,此时点击“完成”,显示拍摄结果;
2.2.1.7背景处理:
点击菜单栏的“图像”,在“预处理”的下拉菜单中选择“背景消除”(如图14),
弹出操作对话框,点击“预览”可观察图片经过“背景消除”的情况,点击“还
原”恢复为未经过“背景消除”的图片;
图14
点击“预览”,并“确定”后,经过“背景消除”的结果被保存(如图15);
图15
2.2.1.8点击“文件”选择“另存为”将经过背景处理的实验图片(如图16),保
存在实验文件夹(以备进行实验的复查等);
图16
2.2.1.9保存好后,点击“文件”,选择“导出为工作图片”,将实验图片转换为工
作图片(如图17、18);
图17
图18
2.2.2打开已有图像:新建实验后,点击“实验”,选择“打开图像文件”,选择已保存
的jpg格式图像,点击“确定”,即可将图像转变为工作图像。
2.3 实验图像的分析
2.3.1取得工作图像后,选择菜单栏“图像编辑”中的“反视”(如图19);
图19
2.3.2再使用“区域切割”,切割选取所需要分析的图像部分(如图19);
2.3.3 点击分析菜单,选择手工或固定方式,对实验图片进行分析。
A.固定法(模板法)
A.1点击菜单栏中的“分析”,选择“固定”;(如图20)
A.2在弹出的“工具”提示框中,调整模版的行列数,在“参数选择”中调整选择
框的大小,然后点击“显示边界”,弹出红色选择框(如图21);
“斑点边界”的高度和宽度均设为87; X、Y方向均为2像素,则高度和宽度均
设为44。
A.3通过方向键移动选择框的位置;尽量保证各样本点在选择框中心附近,然后点
击“背景消除”(如图21);
图20
图21
图22
A.4观察每个样本的消除情况,确保每个样本都在消除框内,没被过渡消除,则点
击“是”,保存背景消除后的结果;如果样本有过度消除的情况,点击“否”,重新框选(如图22);
A.5背景消除后,点击“结果计算”,计算每个样本的值;
结果显示如图23所示:
图23
B.手工法
B.1点击菜单栏中的“分析”,选择“手工”(如图24);
图24
B.2 在“选择区域”中选择“椭圆形”,此时图像上的鼠标键变为十字型(图25);
图25
B.3 圈入斑点,选择“斑点”菜单中的“新斑点”,相应的输入斑点信息(图26、
27);
(前页:图26;左:图27)
B.4 重复步骤B.3,将所需分析的斑点都录入.
B.5 点击“斑点”,选择“显示结果”,手工修改过的样本值保存在计算结果中。
(如
图28)
图28
2.4 关闭实验:计算出结果后,点击“工作图像”框,点击工具栏的“文件”,点击“关
闭实验”(如图29)。
图29
3.成像后的图像说明
图像上的灰色圆点为TK1标准品和含有TK1的血清样品的发光成像,其灰度值的多少与TK1浓度正相关,灰度值越高表示TK1浓度越高。
4.其他功能说明
4.1 删除斑点和修改斑点(图30)
图30
删除斑点:即对录入错误信息或重复录入的斑点进行删除;
点击“斑点”,“删除斑点”,选择标识名,即斑点号,确定斑点名称后,点击“删除”或“放弃”。
修改斑点:即对录入错误信息的斑点进行信息修改;
点击“斑点”,修改“斑点”,选择标识名,即斑点号,确定待修改斑点后,按项目进行修改,点击“保存修改”或“放弃”;或重新圈入所要修改的斑点,选择“斑点”菜单下的“新斑点”,输入相应内容后替换原来的斑点,点击“确定”。
4.2图像旋转功能
点击菜单栏中的图像菜单中的“旋转”,可进行“顺时针90。
”、“顺时针180。
”、“顺时针270。
”、“任意角度”的旋转。
(图31)
图31
选择“任意角度”,如图32所示,左图为原来图像,右图为旋转后图像。
红色方框内添入正数为向右旋转角度,添入负数为向左旋转角度。
图32
4.3信息录入功能
4.3.1 样本信息输入
4.3.1.1输入用户名登录软件后,点击“工具”,“数据录入”(如图33);
图33
4.3.1.2在弹出的对话框中,点击“新增”,然后填写实验名称(“实验名称”应和
实验分析时的实验名称相同),再选择实验行列数,然后点击“确定”(图34);
图34
4.3.1.3在弹出的“数据录入”对话框中点击“编辑”,便可在信息输入框中填写相
关信息,此时“编辑”按钮变为“只读”;填写完后点击“保存”,然后点击“退
出”,最后“关闭”数据录入;可通过使用数据“编辑”、“删除”或“全部删
除”功能对录入数据进行管理;
4.3.2录入信息的调用
4.3.2.1打开或新建实验,点击菜单栏中的“数据管理”,弹出对话框,点击“导入
预录数据”(如图35),对数据进行选择(如图36);
图35
图36
4.3.2.2“选择同名数据”:自动选择实验名相同的数据录入(见
5.3.1.2);
4.3.2.3“选择其他数据”:若实验是对相同样本进行的复检,可直接导入前次实验时
输入的数据,避免了重复输入;
4.3.2.4选择好数据后,点击“确定”,在“录入方式”对话框中,选择“只采用非
空数据”或“完全覆盖”,点击“确定”(如图37),后点击“保存”(如图38);
图37
图38
4.4 打印结果及保存分析结果功能
4.4.1点击“数据”窗口,点击“报告”在弹出的下拉菜单中显示出可选报告格式(如
图39)
4.4.2打印实验报告(如图40)
图40
4.4.3打印个体报告
4.4.3.1弹出“个体报告”对话框,勾选想打印的样本(点击“编辑”可进行“全
选”),点击“文件”,“预览”(如图41);
4.4.3.2点击“文件”,“打印”(如图42);
4.4.4保存:可将计算结果以Excel格式进行保存。
5.常见故障分析与排除。
