Pb-Sn金属相图实验 交大
pb—sn共晶相图相及组织组成物的量化分析
pb—sn共晶相图相及组织组成物的量化分析
晶相图是用于表示材料的相组成的一种绘图工具,主要由相名称、相比例和占总比例组成。
最常用的是Sn-Pb共晶相图。
Sn-Pb共晶相图大致由三个相组成:Sn、Pb和熔盐,代表其中的Sn和Pb的比例来自于其原子比例。
Sn-Pb共晶相图是分析熔锡锡-铅熔接设备成分的重要图表,反映了熔锡锡-铅共晶样品的组成情况。
Sn-Pb共晶相图量化分析首先要按相的位置绘制出各相的成份比例曲线,并利
用相的分割线来确定具体的成份比例。
其次,确定样品里每个元素的含量,以及由此引出的Sn和Pb的比例。
此外,要根据Sn-Pb图里按色彩分布画出熔盐晶体结构,并使用微观组织分析软件来进行微量元素的量化分析。
Sn-Pb共晶相图的量化分析主要针对热收缩材料行业使用的锡-铅熔合工艺的
熔锡锡-铅合金的分析,其精确性对熔锡锡-铅合金的制备性能有着重要意义。
此外,Sn-Pb共晶相图也可以用于传输率和电气特性测试,以及弱电性塑料仪表管材料测试。
二元合金实验报告
实验五二元合金相图一、目的要求1.用热分析法测绘Pb-Sn二元金属相图。
2.了解热分析法的测量技术。
二、基本原理相图是多相(二相或二相相以上)体系处于相平衡状态时体系的某物理性质(如温度)对体系的某一自变量(如组成)作图所得的图形,图中能反映出相平衡情况(相的数目及性质等),故称为相图。
二元或多元体系的相图常以组成为自变量,其物理性质则大多取温度。
由于相图能反映出多相平衡体系在不同自变量条什下的相平衡情况,因此,研究多相体系的性质,以及多相体系相平衡情况的演变(例如冶金工业冶炼钢铁或其他合金的过程,石油工业分离产品的过程等),都要用到相图。
图4.1是一种类型的二元简单低共熔物相图。
图中A、B表示二个组分的名称,纵轴是物理量温度T,横轴是组分B的百分含量B%。
在acb线的上方,体系只有一个相(液相)存在;在ecf线以下,体系有两个相(两个固相——晶体A、晶体B)存在;在ace所包为的面积中,一个固相(晶体A)和一个液相(A在B中的饱和熔化物)共存;在bcf所包围的面积中,也是一个固相(晶体B)和一个液相(B在A中的饱和熔化物)共存;图中c点是ace与bef 两个相区的交点,有三相(晶体A、晶体B、饱和熔化物)共存。
测绘相图就是要将相图中这些分隔相区的线画出来。
常用的实验方法是热分析法。
热分析法所观察的物理性质是被研究体系的温度。
将体系加热熔融成一均匀液相,然后让体系缓慢冷却,并每隔一定时间(例如半分钟或一分钟)读体系温度一次,以所得历次温度值对时间作图,得一曲线,通常称为步冷曲线或冷却曲线,图4.2是二元金属体系的一种常见类型的步冷曲线。
冷却过程中,若体系发生相变,就伴随着一定热效应,团此步冷曲线的斜率将发生变化而出现转折点,所以这些转折点温度就相当于被测体系在相图中分隔线上的点。
若图4.2是图4.1中组成为P 的体系的步冷曲线,则点2、3就分别相当于相图中的点G 、H 。
因此,取一系列组成不同的体系,作出它们的步冷曲线,找出各转折点,即能画出二元体系的最简单的相图(对复杂的相图,还必须有其他方法配合,才能画出)。
铅锡合金金属相图
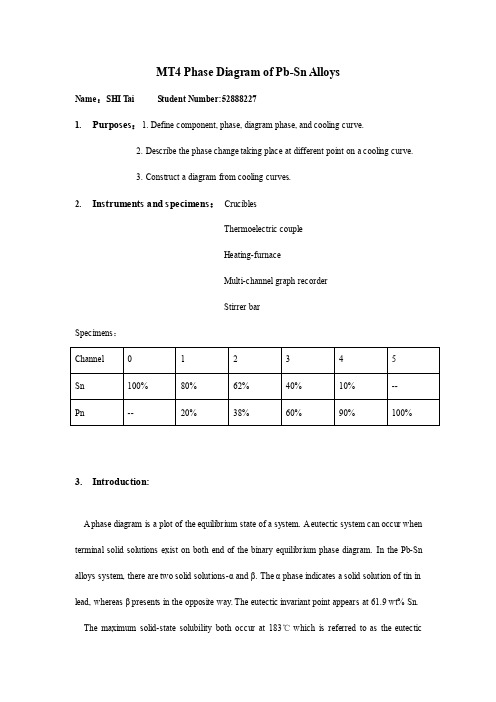
MT4 Phase Diagram of Pb-Sn AlloysName:SHI T ai S tudent Number:528882271.Purposes:1. Define component, phase, diagram phase, and cooling curve.2. Describe the phase change taking place at different point on a cooling curve.3. Construct a diagram from cooling curves.2.Instruments and specimens:CruciblesThermoelectric coupleHeating-furnaceMulti-channel graph recorderStirrer barSpecimens:3.Introduction:A phase diagram is a plot of the equilibrium state of a system. A eutectic system can occur when terminal solid solutions exist on both end of the binary equilibrium phase diagram. In the Pb-Sn alloys system, there are two solid solutions-α and β. T he α phase indicates a solid solution of tin in lead, whereas β presents in the opposite way. The eutectic invariant point appears at 61.9 wt% Sn. The maximum solid-state solubility both occur at 183℃ which is referred to as the eutectictemperature. At this temperature, there exists a point on the phase diagram (a single combination of composition and temperature) where three phases (the two solids and a solid) can exist simultaneously in equilibrium. This combination of temperature and composition is an invariant point on the binary diagram like the freezing point of water on the single component system the eutectic reaction where upon cooling L→α+β represents the isothermal transformation of liquid into two different solids. Depending upon the overall bulk composition of the system, a variety of different equilibrium microstructures are possible. However, as mentioned above, equilibrium requires sufficient time for the system to find the minimum in free energy. In real systems, this is not always possible and non-equilibrium microstructures are common. When this same type of reaction occurs in the solid state where one solid decomposes into two new solid phases isothermally, this is called a eutectoid reaction. γ→α+β.These relationships are determined by these principles of the thermodynamics and have practical applications in many fields of science and engineering.4.Procedure:1.Setting up the apparatus.2.Switch on the bottoms to heat coil until the temperature up to around 400℃.3.Switch on Multi-channel graph recorder and set the chart speed.4.Control the cooling rate under 5℃ per minute.5.Turn off the bottoms when the temperatures of the specimens fall down to 100℃.100020003000400050100 1502002503003504004500 1 2 3 45Amplified Cooling Curves of Pb-Sn AlloysTime(s)5. Results and DiscussionsFigure 1Figure 2Temperature(℃)T able1. The composition of Pb-Sn AlloysT able2. Arrest points of Pb-Sn AlloysFigure 3 The experimental and standard Pb-Sn phase graphAs can be seen from the experimental and standard diagram of Pb-Sn alloys, there are some diversities between them. This experiment studys the binary Pb-Sn system dominated of eutectic alloy system. It is clearly finds the two different elements are absolutely soluble in each other under the liquid condition, while only partially soluble in the solid phase. Alloys in which solid-to-solid convention occurred are easily analyzed for phase graph through the cooling curve method of thermal analysis. This is because the solid condition transformation is often sluggish and the thermal exchange is too small that we can hardly discover by cooling curves.6.The answer to the questions1.What is the expected difference in cooling curves for Pb-10 percent Sn and Pb-40 percent Snalloys? Explian.The cooling curve of 10 percent Sn in Pb has a constant melting piont at 303℃, while the curve for Pb-40 percent Sn ranging from 186℃ to 243℃. This is mainly due to the composition of the alloy.2.Discuss the arrest point in Pb-62 percent Sn alloy.The point is the Eutectic point and the transformation through this point is called Eutectic reaction: L→α+β. It is clearly see the arrest temperature of Pb-Sn alloys is about 186℃, which is a bit different from the data shown in the standard Pb-Sn phase graph (183℃). The reasons may be the follow three. First, a member of our group touched the heat-sensitive line during the experiment, which leads to inaccuracy of measurement. Second, the specimens of Pb-Sn alloys have been used for many times so that they may be partly oxidation by the air, that is to say, the samples isimpurity. Third, there are only 6 channels of samples through the whole experiment. It is a little less to describe a complete phase diagram. To accurately identify the phase boundaries requires many samples.3.What types of binary system are represented by the Pb-Sn diagrams?The Pb-Sn system is characteristic of a valley in the middle. Such system is known as the Eutectic system.4.Would you expect a different in the arrest points obtained by heating curves and coolingcurves?Actually, the difference is that the liquid may cool to a temperature below its freezing point before crystallization occurs, this is called supercooling. Once solidification begins, the temperature will rise to the freezing piont and remain there until solidification is complete. Most alloys will solidify from the molten state over a range of temperature. The cooling curves will thus have liquid-solid transition pionts at two different temperatures representing the beginning and end of solidif ication.7.ReferencePhase Diagram Tutorial: /~pasr1/Non-ferrous metal online: 。
金属相图(Pb-Sn体系)

实验数据记录
实验日期:
;室温: ℃;气压:
KPa
锡的百 0% 分含量 (纯铅)
20%
40%
61.9%
80% 100%
(低共熔物)
(纯锡)
转折点
(t℃)
水平段
(t℃)
数据处理
1.温度换算( ℃ 2.作出Pb-Sn相图; 3.与文献值比较。
K);
T/K
600K
454K
L+Pb(s)
L(单相区)
505K
固态晶形转变点。
真实的Pb—Sn 金属相图
实验结果与讨论
⑴结果:实测值为T铅= T锡= T低共熔=
⑵计算实验偏差: ⑶分析产生偏差的原因: ⑷有何建议与想法?
注意事项
1.Pb-Sn混合物的液相必须均匀互溶(达最高温 度时,搅拌样品);
2.样品的降温速率必须缓慢; 3.操作过程中,要防止样品被氧化及混入杂质; 4.热电偶温度计要插到玻璃套的底部。
观察升温情况 及时停止加热
取出样品、放 入新样品测试
实验结束记录 数据恢复原状
准备样品
按以下比例配制
锡的百 分含量
0%
20%
锡(g) 0 20
铅(g) 100 80
40% 61.9% 80% 100%
40 61.9 80 100 60 38.1 20 0
何时停止加热?
纯Pb、纯Sn、含锡61.9%(低共熔物)三个样品, 如果出现转折点,则停止加热,利用电炉的余热加 热到熔点以上30~40 ℃ 。
含锡20%、含锡40%、含锡80%三个样品,如果出 现转折点,则停止加热,利用电炉的余热使温度再 升高30~50 ℃。
何时停止实验?
Pb-Sn二元相图测定及其组织分析
实验10 二组分合金相图班级:材料(硕)01 组长:丁斌组员:陈越凡门明达王光王晓宇魏瑛康何林温雅欣杨多雪杨俊杰实验日期:2013年5月221.1实验目的1.2①掌握用热分析法测定材料的临界点的方法;②学习根据临界点建立二元合金相图;③自制二元合金金相样品,并分析组织。
热分析法(冷却曲线法)热分析法(冷却曲线法)是绘制凝聚体系相图时常用的方法。
它是利用金属及合金在加热或冷却过程中发生相变时,潜热的释出或吸收及热容的突变,使得温度-时间关系图上出现平台或拐点,从而得到金属或合金的相转变温度。
由热分析法制相图,先做冷却曲线,然后根据冷却曲线作图。
通常的做法是先将金属或合金全部熔化。
然后让其在一定的环境中自行冷却,通过记录仪记录下温度随时间变化的曲线(步冷曲线)。
以合金样品为例,当熔融的体系均匀冷却时(1所示),如果系统不发生相变,则系统温度随时间变化是均匀的,冷却速率较快(如图中ab线段);若冷却过程中发生了相变,由于在相变过程中伴随着放热效应,所以系统的温度随时间变化的速率发生改变,系统冷却速率减慢,冷却曲线上出现转折(如图中b点)。
当熔液继续冷却到某一点时(如图中c点),此时熔液系统以低共熔混合物的固体析出。
在低共熔混合物全部凝固以前,系统温度保持不变,因此步冷曲线出现水平线段(如图中cd线段);当熔液完全凝固后,温度才迅速下降(如图中de线段)。
由此可知,对组成一定的二组分低共熔混合物系统,可根据它的冷却曲线得出有固体析出的温度和低共熔点温度。
根据一系列组成不同系统的步冷曲线的各转折点,即可画出二组分系统的相图(温度-组成图)。
不同组成熔液的冷却曲线对应的相图2所示。
测定一系列不同Pb-Sn合金成分下的由液体缓慢冷却至完全凝固的数据,作冷却曲线,找出转折点或者平台,即对应转变开始或者完成所对应的温度,由此,综合这一系列的温度和其所对应的成分即可作出平衡态下的相图。
图1 图2金相组织分析:何林温雅欣杨多雪杨俊杰组:成分组织相理论相对量相实际相对量α90%87.1% 90%Pb-10%Snα+βⅡβ10%12.9%最终为ɑ固溶体,其冷却到固溶度线以下,将析出二次β,通常呈粒状或小条状分布于晶界与晶内。
上海交通大学_材料科学基础第七章_二元相图和合金的凝固

测定条件:冷却需非常缓慢,保持热力学平衡。
2019/12/1
热分析装置示意图
2019/12/1
二元相图的线、区
• 由凝固开始温度连接起来的线成为液相线(liquidus line)。 • 由凝固终了温度连接起来的线成为固相线(solidus line)。 • 相图中由相界线划分出来的区域称为相区(phase regions)
2019/12/1
共晶合金的平衡凝固及其组织
共晶相图的概念 • 组成共晶相图(the eutectic phase diagram)的两组元,其相
互作用的特点是:液态下两组元能无限互溶,固态下只能部 分互溶(形成有限固溶体或化合物),甚至有时完全不溶,并 具有共晶转变(the eutectic reaction)。 • 所谓共晶转变是在一定条件下(温度、成分),由均匀液体中 同时结晶出两种不同固相的转变,所得到两固相的混合物 称为共晶组织(体)。具有共晶转变的相图称为共晶相图。 • 属于二元共晶相图的合金有:Pb-Sn、Pb-Sb、Al-Si、 Al-Cu、Mg-Si、Al-Mg等。
2019/12/1
需要着重指出的是,在每一温度下,平衡凝固实质包括三个过程:①液相内 的扩散过程。②固相的继续长大。 ⑦固相内的扩散过程。现以上述合金从 小至,2 温度的平衡凝固为例,由图7.16具体描述之。
2019/12/1
平衡凝固过程分析
• 从T1->T2温度,可采取两种方法:
– 每一步都非常缓慢,处于平衡状态; – 一下子降温到T2温度,保温足够长时间,使其扩散均匀
2019/12/1
由相率可知,二元系最多只能三相共存,且在相图上为水平线,如 图7.2。
2019/12/1
7.2 相图热力学的基本要点
PbSn相图实验误差分析
PbSn相图实验误差分析提起金属相图实验误差分析,大家都知道,有人问物理实验冷却法测金属的比热容中的误差分析怎么写,另外,还有人想问光学实验的实验误差分析,你知道这是怎么回事?其实物理实验冷却法测金属的比热容中的误差分析怎么写?金属相图实验误差分析:对误差的分析是不一样的,分光光度计的误差要对数据做统计分析,光谱分析可以与基准物质对照。
在测量三棱镜折射率实验中,当调节分光计的平行光管光轴与望远镜光轴垂直于中心转轴后,由实验可知载物台平面的倾斜程度对最小偏向角的测量没影响,但顶角的测量随着载物台平面的倾斜程度不同,有着不同程度的影响。
当倾斜角度小于2o时,计算得到的折射率值与载物台没有倾斜时得到的值基本一致。
测量通常具有少量的误差,同一项目的重复测量通常会导致读数略有不同。
可以分析这些差异,并遵循一定的已知数学和统计特性。
一般来说,误差分析通常不足以证明数据被或制造,但它可能提供必要的支持证据,以证实怀疑不当行为。
物理化学以测量物理量为基本内容,并对所测得数据加以合理的处理,得出某些重要的规律,从而研究体系的物理化学性质与化学反应间的关系。
金属相图实验误差分析:物理实验冷却法测金属的比热容中的误差分析怎么写大学物理实验——冷却法测金属的比热容中误差主要来源于对温度的测量。
金属相图中的误差分析。
1、读取温度是的视觉误差;2、温度计的对与某时刻的灵敏程度造成的误差;二元合金相图实验误差分析。
3、绘制时间—温度曲线的误差;二元合金相图误差分析。
用加热盘对标准样品加热,同时监视加热温度,达65.0℃停止加热.并将加热盘移开,使样品自然冷却,同时开始记录温度T1和对应时间t1;二组分合金相图误差分析。
物理实验冷却法测金属的比热容中的误差分析怎么写?初始时由于样品温度与室温差别较大,降温较快,所以记录点要略密些,随着样品降温,温差变小,变化缓慢,记录时间间隔可加大,当温度约为40℃时,停止测量。
在一定的条件下得到更接进于真实值的最佳测量结果;确定结果的不确定程度;据预先所需结果,选择合理的实验仪器、实验条件和方法,以降低成本和缩短实验时间。
上海交通大学 材料科学基础第七章 二元相图及其合金的凝固

相图测定方法
二元相图是根据各种成分材料的临界点绘制的,临界点 表示物质结构状态发生本质变化的相变点。 • 动态法
– 热分析法 – 膨胀法 – 电阻法
• 静态法
– 金相法 – X射线结构分析
精确测定相图需多种方法配合使用
2013-8-19
下面介绍用热分析法测量临界点来绘制二元相图的过程。
(4)相界线走向规则:当两相区与单相区的分界线与三相等温线相交 ,则分界线的延长线应进入另一两相区内,而不会进入单相区内。
2013-8-19
7.3 二元相图分析
7.3.1 匀晶相图和固溶体凝固-匀晶相图 1. 匀晶相图
两组元无限互溶的条件: • 晶体结构相同 • 原子尺寸相近,尺寸差<15% • 相同的原子价 • 相似的电负性(化学亲和力)
7.2.4 从自由能—成分曲线推测相图 根据公切线原理可求出体系在某一温度下平衡相的成分。图7.7表 示由T1,T2,T3,T4及T5温度下液相(L)和固相(S)的自由能一成分 曲线求得A,B两组元完全互溶的相图。
2013-8-19
图7.8表示了由5 个不同温度下L,α 和β 相的自由能一成分曲线求 得A,B两组元形成共晶系的相图。
组元B(x1)
组元B(x2)
混 合 物
α相 (n1摩尔,Gm1)
+
β相 (n2摩尔,Gm2)
2013-8-19
混合物中B组元的摩尔分数(x):
n1 x1 n2 x2 x n1 n2
n1Gm1 n2Gm 2 Gm n1 n2
n1 x2 x n2 x x1
n1 Gm 2 Gm n2 Gm Gm1
x1 x x2
x2 x1 ( x2 x) ( x x1 )
实验六、二组分合金相图
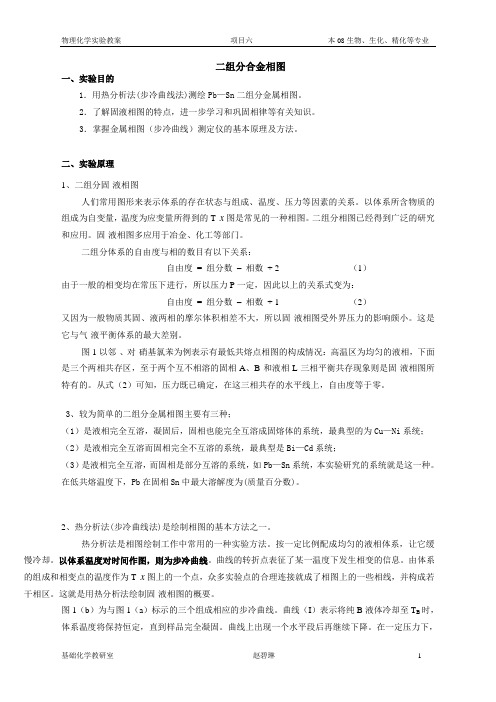
二组分合金相图一、实验目的1.用热分析法(步冷曲线法)测绘Pb—Sn二组分金属相图。
2.了解固液相图的特点,进一步学习和巩固相律等有关知识。
3.掌握金属相图(步冷曲线)测定仪的基本原理及方法。
二、实验原理1、二组分固-液相图人们常用图形来表示体系的存在状态与组成、温度、压力等因素的关系。
以体系所含物质的组成为自变量,温度为应变量所得到的T-x图是常见的一种相图。
二组分相图已经得到广泛的研究和应用。
固-液相图多应用于冶金、化工等部门。
二组分体系的自由度与相的数目有以下关系:自由度= 组分数–相数+ 2 (1)由于一般的相变均在常压下进行,所以压力P一定,因此以上的关系式变为:自由度= 组分数–相数+ 1 (2)又因为一般物质其固、液两相的摩尔体积相差不大,所以固-液相图受外界压力的影响颇小。
这是它与气-液平衡体系的最大差别。
图1以邻-、对-硝基氯苯为例表示有最低共熔点相图的构成情况:高温区为均匀的液相,下面是三个两相共存区,至于两个互不相溶的固相A、B和液相L三相平衡共存现象则是固-液相图所特有的。
从式(2)可知,压力既已确定,在这三相共存的水平线上,自由度等于零。
3、较为简单的二组分金属相图主要有三种;(1)是液相完全互溶,凝固后,固相也能完全互溶成固熔体的系统,最典型的为Cu—Ni系统;(2)是液相完全互溶而固相完全不互溶的系统,最典型是Bi—Cd系统;(3)是液相完全互溶,而固相是部分互溶的系统,如Pb—Sn系统,本实验研究的系统就是这一种。
在低共熔温度下,Pb在固相Sn中最大溶解度为(质量百分数)。
2、热分析法(步冷曲线法)是绘制相图的基本方法之一。
热分析法是相图绘制工作中常用的一种实验方法。
按一定比例配成均匀的液相体系,让它缓慢冷却。
以体系温度对时间作图,则为步冷曲线。
曲线的转折点表征了某一温度下发生相变的信息。
由体系的组成和相变点的温度作为T-x图上的一个点,众多实验点的合理连接就成了相图上的一些相线,并构成若干相区。
Pb-Sn二元相图测定及其组织分析
实验10 二组分合金相图班级:材料(硕)01 组长:丁斌组员:陈越凡门明达王光王晓宇魏瑛康何林温雅欣杨多雪杨俊杰实验日期:2013年5月221.1实验目的1.2①掌握用热分析法测定材料的临界点的方法;②学习根据临界点建立二元合金相图;③自制二元合金金相样品,并分析组织。
热分析法(冷却曲线法)热分析法(冷却曲线法)是绘制凝聚体系相图时常用的方法。
它是利用金属及合金在加热或冷却过程中发生相变时,潜热的释出或吸收及热容的突变,使得温度-时间关系图上出现平台或拐点,从而得到金属或合金的相转变温度。
由热分析法制相图,先做冷却曲线,然后根据冷却曲线作图。
通常的做法是先将金属或合金全部熔化。
然后让其在一定的环境中自行冷却,通过记录仪记录下温度随时间变化的曲线(步冷曲线)。
以合金样品为例,当熔融的体系均匀冷却时(1所示),如果系统不发生相变,则系统温度随时间变化是均匀的,冷却速率较快(如图中ab线段);若冷却过程中发生了相变,由于在相变过程中伴随着放热效应,所以系统的温度随时间变化的速率发生改变,系统冷却速率减慢,冷却曲线上出现转折(如图中b点)。
当熔液继续冷却到某一点时(如图中c点),此时熔液系统以低共熔混合物的固体析出。
在低共熔混合物全部凝固以前,系统温度保持不变,因此步冷曲线出现水平线段(如图中cd线段);当熔液完全凝固后,温度才迅速下降(如图中de线段)。
由此可知,对组成一定的二组分低共熔混合物系统,可根据它的冷却曲线得出有固体析出的温度和低共熔点温度。
根据一系列组成不同系统的步冷曲线的各转折点,即可画出二组分系统的相图(温度-组成图)。
不同组成熔液的冷却曲线对应的相图2所示。
测定一系列不同Pb-Sn合金成分下的由液体缓慢冷却至完全凝固的数据,作冷却曲线,找出转折点或者平台,即对应转变开始或者完成所对应的温度,由此,综合这一系列的温度和其所对应的成分即可作出平衡态下的相图。
图1 图2实验结果:金相组织分析:何林温雅欣杨多雪杨俊杰组:成分组织相理论相对量相实际相对量90%Pb-10%Sn α+βⅡα90% 87.1% β10% 12.9%最终为ɑ固溶体,其冷却到固溶度线以下,将析出二次β,通常呈粒状或小条状分布于晶界与晶内。
铅锡共晶相图分析(图文借鉴)

1、相图分析图3-12为一般共晶型的Pb-Sn合金相图。
其中AEB线为液相线,ACEDB线为固相线,A点为铅的熔点(327℃),B点为锡的熔点(232℃)。
相图中有L、α、β三种相,形成三个单相区。
L代表液相,处于液相线以上。
α是Sn溶解在Pb中所形成的固溶体,位于靠近纯组元Pb的封闭区域内。
β是Pb溶解在Sn中所形成的固溶体,位于靠近纯组元Sn的封闭区域内。
在每两个单相区之间,共形成了三个两相区,即L+α、L+β和α+β。
图3-12 Pb-Sn二元合金相图相图中的水平线CED称为共晶线。
在水平线对应的温度(183℃)下,E点成分的液相将同时结晶出C点成分的α固溶体和D点成分的β固溶体:LE⇄ ( αC + βD)。
这种在一定温度下,由一定成分的液相同时结晶出两个成分和结构都不相同的新固相的转变过程称为共晶转变或共晶反应。
共晶反应的产物即两相的机械混合物称为共晶体或共晶组织。
发生共晶反应的温度称为共晶温度,代表共晶温度和共晶成分的点称为共晶点,具有共晶成分的合金称为共晶合金。
在共晶线上,凡成分位于共晶点以左的合金称为亚共晶合金,位于共晶点以右的合金称为过共晶合金。
凡具有共晶线成分的合金液体冷却到共晶温度时都将发生共晶反应。
发生共晶反应时,L、α、β三个相平衡共存,它们的成分固定,但各自的重量在不断变化。
因此,水平线CED是一个三相区。
相图中的CF线和DG线分别为Sn在Pb中和Pb在Sn中的溶解度曲线(即饱和浓度线),称为固溶线。
可以看出,随温度降低,固溶体的溶解度下降。
2、典型合金的结晶过程⑴含Sn量小于C点成分合金的结晶过程(以合金Ⅰ为例)由图3-12可见,该合金液体冷却时,在2点以前为匀晶转变,结晶出单相α固溶体,这种从液相中结晶出来的固相称为一次相或初生相。
匀晶转变完成后,在2、3点之间,为单相α固溶体冷却,合金组织不发生变化。
温度降到3点以下,α固溶体被Sn过饱和,由于晶格不稳,便出现第二相—β相,显然,这是一种固态相变。
金属二相图实验报告

【实验名称】金属二相图的绘制【实验目的】1.用热分析(布冷曲线法)绘制Bi-Sn二组分金属相图2.掌握热电偶测量温度的基本原理和自动平衡记录仪的使用方法【实验原理】较为简单的二组份金属相图主要有三种: 一种是液相完全互溶, 凝固后, 故乡也能完全互溶成固熔体的系统, 最典型的为Cu-Ni系统;另一种是液相完全互溶而固相完全不互溶, 最典型的是Bi-Cd系统;还有一种是液相完全互溶, 而固相是部分互溶的系统, 如Pb-Sn系统。
本实验研究的Bi-Sn系统就是这一种。
在低共熔温度下, Bi在固相Sn中最大溶解度为21%(质量百分数)。
热分析法(步冷曲线法)是绘制相图的基本方法之一。
它是利用金属及合金在加热和冷却过程中发生相变时, 潜热的释出或吸收及热熔的突变, 来得到金属或合金中相转变温度的方法。
通常的做法是先将金属或合金全部熔化, 然后让其在一定的环境中自行冷却, 并在记录仪上自动画出温度随时间变化的步冷曲线。
当熔融的系统均匀冷却时, 如果系统不发生相变, 则系统的温度随时间的变化是均匀的, 冷却速率较快, 相应的步冷曲线的斜率也比较大;若在冷却过程中发生了相变, 由于在相变过程中伴随着放热效应, 所以系统的温度随时间变化的速率发生改变, 系统的冷却速率减慢, 步冷曲线上出现转折。
当熔液继续冷却到某一点时, 此时的熔液系统以低共熔混合物的固体吸出。
在低共熔混合物全部凝固以前, 系统温度保持不变, 因此步冷曲线上出现水平线段;当熔液完全凝固后, 温度才迅速下降。
由此可知, 对组成一定的二组分低共熔混合物系统, 可以根据它的步冷曲线得出有固体析出的温度和低共熔点温度。
根据一系列组成不同系统的步冷曲线的各转折点, 即可画出二组分系统的相图(温度-组成图)。
用热分析法(步冷曲线法)绘制相图时, 被测系统必须时时处于或接近相平衡状态, 因此冷却速率要足够慢才能得到较好的结果。
【实验仪器与药品】热电偶1支;电炉3个;调压器2个;5支硬制玻璃试管, 分别装有Bi质量百分比分别为30%、57%、80%的Bi-Sn合金, 及纯Bi、纯Sn;测水沸点仪1套(共用);自动平衡记录仪1台。
3.差热分析法测定Pb-Sn的金属相图

差热分析法测定Pb-Sn的金属相图一、实验目的和要求1.用热分析法测绘Pb-Sn二元金属相图,并掌握应用步冷曲线数据绘制二元体系相图的基本方法;2.了解步冷曲线及相图中各曲线所代表的物理意义;二、实验原理相是指体系内部物理性质和化学性质完全均匀的一部分。
相平衡是指多相体系中组分在各相中的量不随时间而改变。
研究多相体系的状态如何随组成、温度、压力等变量的改变而发生变化,并用图形来表示体系状态的变化,这种图就叫相图。
将某一物质进行加热或冷却,在这样的过程中,若有物相变化发生,如发生熔化、凝固、晶型转变、分解、脱水等相变时,总伴随着有吸热或放热的现象。
两种混合物若发生固相反应,也有热效应产生。
因此,在体系的温度——时间曲线上就会发生顿、折,但在许多情况下(例如在试样的来源有限,量很少),体系中发生的热效应相当小,不足以引起体系温度有明显的突变,从而温度——时间曲线的顿、折并不显著,甚至根本显不出来。
在这种情况下,常将有物相变化的物质和一个基准物质(或参比物,即在实验温度变化的整个过程中不发生相变、没有任何热效应产生,如Al2O3、MgO等)在相同的条件下进行加热或冷却时,一旦样品发生相变,则在样品和基准物之间产生温度差。
测定这种温度差,用于分析物质变化的规律,称为差热分析。
本实验采用热分析法绘制相图,其基本原理:先将体系加热至熔融成一均匀液相,然后让体系缓慢冷却,①体系内不发生相变,则温度--时间曲线均匀改变;②体系内发生相变,则温度--时间曲线上会出现转折点或水平段。
根据各样品的温度--时间曲线上的转折点或水平段,就可绘制相图。
纯物质的步冷曲线如①、⑤所示,如①从高温冷却,开始降温很快,ab线的斜率决定于体系的散热程度,冷到A的熔点时,固体A开始析出,体系出现两相平衡(液相和固相A),此时温度维持不变,步冷曲线出现水平段,直到其中液相全部消失,温度才下降。
相图由一个单相区和三个两相区组成:即①溶液相区;②纯A(s)和溶液共存的两相区;③纯B(s)和溶液共存的两相区;④纯A(s)和纯B(s)共存的两相区;水平线段表示:A(s)、B(s)和溶液共存的三相线;水平线段以下表示纯A(s)和纯B(s)共存的两相区;o为低共熔点。
SnPb相图PbSn.ppt

实验原理
相是指体系内部物理性质和化 学性质完全均匀的一部分。
相平衡是指多相体系中组分在 各相中的量不随时间而改变。
研究多相体系的状态如何随组 成、温度、压力等变量的改变而发 生变化,并用图形来表示体系状态 的变化,这种图就叫相图。
本实验采用热分析法绘制相图,其
基本原理:先将体系加热至熔融成一均 匀液相,然后让体系缓慢冷却,①体系 内不发生相变,则温度--时间曲线均匀 改变;②体系内发生相变,则温度--时 间曲线上会出现转折点或水平段。根据 各样品的温度--时间曲线上的转折点或 水平段,就可绘制相图。
曲线③表示其组成恰为最低共 熔混合物的步冷曲线,其形状与纯 物质相似,但它的水平段是三相平 衡。
即 L=A(s)+B(s)
分析2:
相图由一个单相区和三个两相区组成: 即 ①溶液相区;
②纯A(s)和溶液共存的两相区;
③纯B(s)和溶液共存的两相区;
④纯A(s)和纯B(s)共存的两相区;
水平线段表示:A(s)、B(s)和溶液共 存的三相线;水平线段以下表示纯A(s)和 纯B(s)共存的两相区;O为低共熔点。
含锡20%、含锡30%、含锡80%三个 样品,出现了转折点,并在作完水平线 段后又继续降温,表明样品已完全凝固, 即可停止测量。
实验数据记录
实验日期:
;室温: ℃;气压:
KPa
锡的百 分含量
0% (纯铅)
20%
30%
61.9%
80% 100%
(低共熔物)
(纯锡)
转折点
(t℃)
水平段
(t℃)
数据处理
药品仪器
1. EA/J2P00双笔自动平衡记录仪; 2. 电炉; 3. 镍铬—镍硅热电偶; 4. 大、小坩埚; 5. 保温瓶; 6. 坩埚钳; 7. 冰块、石墨; 8. 锡粒(AR),铅粒(AR); 9. 等等。
铅锡合金金属相图

MT4 Phase Diagram of Pb-Sn AlloysName:SHI Tai Student Number:528882271.Purposes:1. Define component, phase, diagram phase, and cooling curve.2. Describe the phase change taking place at different point on a cooling curve.3. Construct a diagram from cooling curves.2.Instruments and specimens:CruciblesThermoelectric coupleHeating-furnaceMulti-channel graph recorderStirrer barSpecimens:3.Introduction:A phase diagram is a plot of the equilibrium state of a system. A eutectic system can occur when terminal solid solutions exist on both end of the binary equilibrium phase diagram. In the Pb-Sn alloys system, there are two solid solutions-α and β. T he α phase indicates a solid solution of tin in lead, whereas β presents in the opposite way. The eutectic invariant point appears at 61.9 wt% Sn. The maximum solid-state solubility both occur at 183℃which is referred to as the eutectictemperature. At this temperature, there exists a point on the phase diagram (a single combination of composition and temperature) where three phases (the two solids and a solid) can exist simultaneously in equilibrium. This combination of temperature and composition is an invariant point on the binary diagram like the freezing point of water on the single component system the eutectic reaction where upon cooling L→α+β represents the isothermal transformation of liquid into two different solids. Depending upon the overall bulk composition of the system, a variety of different equilibrium microstructures are possible. However, as mentioned above, equilibrium requires sufficient time for the system to find the minimum in free energy. In real systems, this is not always possible and non-equilibrium microstructures are common. When this same type of reaction occurs in the solid state where one solid decomposes into two new solid phases isothermally, this is called a eutectoid reaction. γ→α+β.These relationships are determined by these principles of the thermodynamics and have practical applications in many fields of science and engineering.4.Procedure:1.Setting up the apparatus.2.Switch on the bottoms to heat coil until the temperature up to around 400℃.3.Switch on Multi-channel graph recorder and set the chart speed.4.Control the cooling rate under 5℃ per minute.5.Turn off the bottoms when the temperatures of the specimens fall down to 100℃.0 1000 20003000 400050 100 150 200 250300350400 4500 1 2 3 4 5Amplified Cooling Curves of Pb-Sn AlloysTime(s)5. Results and DiscussionsFigure 1Figure 2Temperature(℃)Table1. The composition of Pb-Sn AlloysSample 0 1 2 3 4 5Content (wt%) Sn 100 80 62 40 10 0 Pb 0 20 38 60 90 100Table2. Arrest points of Pb-Sn AlloysSample 0 1 2 3 4 5Temperature ℃237 204 186 243 303 326 186 186Figure 3 The experimental and standard Pb-Sn phase graphAs can be seen from the experimental and standard diagram of Pb-Sn alloys, there are some diversities between them. This experiment studys the binary Pb-Sn system dominated of eutectic alloy system. It is clearly finds the two different elements are absolutely soluble in each other under the liquid condition, while only partially soluble in the solid phase. Alloys in which solid-to-solid convention occurred are easily analyzed for phase graph through the cooling curve method of thermal analysis. This is because the solid condition transformation is often sluggish and the thermal exchange is too small that we can hardly discover by cooling curves.6.The answer to the questions1.What is the expected difference in cooling curves for Pb-10 percent Sn and Pb-40 percent Snalloys? Explian.The cooling curve of 10 percent Sn in Pb has a constant melting piont at 303℃, while the curve for Pb-40 percent Sn ranging from 186℃ to 243℃. This is mainly due to the composition of the alloy.2.Discuss the arrest point in Pb-62 percent Sn alloy.The point is the Eutectic point and the transformation through this point is called Eutectic reaction: L→α+β. It is clearly see the arrest temperature of Pb-Sn alloys is about 186℃, which is a bit different from the data shown in the standard Pb-Sn phase graph (183℃). The reasons may be the follow three. First, a member of our group touched the heat-sensitive line during the experiment, which leads to inaccuracy of measurement. Second, the specimens of Pb-Sn alloys have been used for many times so that they may be partly oxidation by the air, that is to say, the samples isimpurity. Third, there are only 6 channels of samples through the whole experiment. It is a little less to describe a complete phase diagram. To accurately identify the phase boundaries requires many samples.3.What types of binary system are represented by the Pb-Sn diagrams?The Pb-Sn system is characteristic of a valley in the middle. Such system is known as the Eutectic system.4.Would you expect a different in the arrest points obtained by heating curves and coolingcurves?Actually, the difference is that the liquid may cool to a temperature below its freezing point before crystallization occurs, this is called supercooling. Once solidification begins, the temperature will rise to the freezing piont and remain there until solidification is complete. Most alloys will solidify from the molten state over a range of temperature. The cooling curves will thus have liquid-solid transition pionts at two different temperatures representing the beginning and end of solidification.7.ReferencePhase Diagram Tutorial: /~pasr1/Non-ferrous metal online: 。
铅锡合金金属相图
MT4 Phase Diagram of Pb-Sn AlloysName:SHI Tai Student Number:528882271.Purposes:1. Define component, phase, diagram phase, and cooling curve.2. Describe the phase change taking place at different point on a cooling curve.3. Construct a diagram from cooling curves.2.Instruments and specimens:CruciblesThermoelectric coupleHeating-furnaceMulti-channel graph recorderStirrer barSpecimens:3.Introduction:A phase diagram is a plot of the equilibrium state of a system. A eutectic system can occur when terminal solid solutions exist on both end of the binary equilibrium phase diagram. In the Pb-Sn alloys system, there are two solid solutions-α and β. T he α phase indicates a solid solution of tin in lead, whereas β presents in the opposite way. The eutectic invariant point appears at 61.9 wt% Sn. The maximum solid-state solubility both occur at 183℃which is referred to as the eutectictemperature. At this temperature, there exists a point on the phase diagram (a single combination of composition and temperature) where three phases (the two solids and a solid) can exist simultaneously in equilibrium. This combination of temperature and composition is an invariant point on the binary diagram like the freezing point of water on the single component system the eutectic reaction where upon cooling L→α+β represents the isothermal transformation of liquid into two different solids. Depending upon the overall bulk composition of the system, a variety of different equilibrium microstructures are possible. However, as mentioned above, equilibrium requires sufficient time for the system to find the minimum in free energy. In real systems, this is not always possible and non-equilibrium microstructures are common. When this same type of reaction occurs in the solid state where one solid decomposes into two new solid phases isothermally, this is called a eutectoid reaction. γ→α+β.These relationships are determined by these principles of the thermodynamics and have practical applications in many fields of science and engineering.4.Procedure:1.Setting up the apparatus.2.Switch on the bottoms to heat coil until the temperature up to around 400℃.3.Switch on Multi-channel graph recorder and set the chart speed.4.Control the cooling rate under 5℃ per minute.5.Turn off the bottoms when the temperatures of the specimens fall down to 100℃.0 1000 20003000 400050 100 150 200 250300350400 4500 1 2 3 4 5Amplified Cooling Curves of Pb-Sn AlloysTime(s)5. Results and DiscussionsFigure 1Figure 2Temperature(℃)Table1. The composition of Pb-Sn AlloysSample 0 1 2 3 4 5Content (wt%) Sn 100 80 62 40 10 0 Pb 0 20 38 60 90 100Table2. Arrest points of Pb-Sn AlloysSample 0 1 2 3 4 5Temperature ℃237 204 186 243 303 326 186 186Figure 3 The experimental and standard Pb-Sn phase graphAs can be seen from the experimental and standard diagram of Pb-Sn alloys, there are some diversities between them. This experiment studys the binary Pb-Sn system dominated of eutectic alloy system. It is clearly finds the two different elements are absolutely soluble in each other under the liquid condition, while only partially soluble in the solid phase. Alloys in which solid-to-solid convention occurred are easily analyzed for phase graph through the cooling curve method of thermal analysis. This is because the solid condition transformation is often sluggish and the thermal exchange is too small that we can hardly discover by cooling curves.6.The answer to the questions1.What is the expected difference in cooling curves for Pb-10 percent Sn and Pb-40 percent Snalloys? Explian.The cooling curve of 10 percent Sn in Pb has a constant melting piont at 303℃, while the curve for Pb-40 percent Sn ranging from 186℃ to 243℃. This is mainly due to the composition of the alloy.2.Discuss the arrest point in Pb-62 percent Sn alloy.The point is the Eutectic point and the transformation through this point is called Eutectic reaction: L→α+β. It is clearly see the arrest temperature of Pb-Sn alloys is about 186℃, which is a bit different from the data shown in the standard Pb-Sn phase graph (183℃). The reasons may be the follow three. First, a member of our group touched the heat-sensitive line during the experiment, which leads to inaccuracy of measurement. Second, the specimens of Pb-Sn alloys have been used for many times so that they may be partly oxidation by the air, that is to say, the samples isimpurity. Third, there are only 6 channels of samples through the whole experiment. It is a little less to describe a complete phase diagram. To accurately identify the phase boundaries requires many samples.3.What types of binary system are represented by the Pb-Sn diagrams?The Pb-Sn system is characteristic of a valley in the middle. Such system is known as the Eutectic system.4.Would you expect a different in the arrest points obtained by heating curves and coolingcurves?Actually, the difference is that the liquid may cool to a temperature below its freezing point before crystallization occurs, this is called supercooling. Once solidification begins, the temperature will rise to the freezing piont and remain there until solidification is complete. Most alloys will solidify from the molten state over a range of temperature. The cooling curves will thus have liquid-solid transition pionts at two different temperatures representing the beginning and end of solidification.7.ReferencePhase Diagram Tutorial: /~pasr1/Non-ferrous metal online: 。