NX Nastran非线性屈曲实例分析
非线性屈曲分析
ansys workbench非线性屈曲分析(2013-08-26 21:26:29)转载▼标签:ansys很多旋转受压结构必须进行屈曲分析,常规结构屈曲分析软件有nastran、abaqus和ansys,nastran对线性大型模型分析效率较高;abaqus屈曲分析使用较少;ansys使用比较频繁,其快速建模,与CAD软件的良好借口及有限元模型前处理的便捷性(WB界面)很有吸引力,屈曲分析功能较为完善,可以进行线性、非线性和后屈曲分析。
ansys学习资料中介绍较多的是线性屈曲分析。
线性屈曲分析在工业实际中预测的值偏高,有的甚至超过实际实验测试值的几十倍,线性分析唯一优势是其分析速度较快。
但在实际中其预测值参考价值不大,仅给定结构屈曲失效的上限值。
非线性屈曲分析考虑其他因素,包括结构加工缺陷(几何),材料非线性等,因此较为接近实际情况,但计算耗时较长。
针对最艰难学习情况归纳总结非线性屈曲分析时技术要点及应注意事项。
对于规则旋转壳,承受外压载荷作用,进行非线性屈曲分析时,必须加上几何缺陷,关键步是添加APDL语句/prep7upgeom,0.1,1,1,file,rstcdwrite,db,file,cdb/solu该步引入屈曲模态情况下的几何缺陷,缺陷为屈曲模态变形相对值的0.1倍,该值可以根据实际加工水平等其他条件确定,上述语句保存在txt文档中,在workbench流程APDL模块调用。
分析详细流程为,static structure模块导入几何,施加载荷和边界条件,分析求解,将linear buckling拖入流程中,共享static structure模块数据,进行线性屈曲模块分析,Mechanial APDL模块调用屈曲分析结果,并调入(addinput)上面内含几何缺陷命令语句命令的txt文件,更新,将Mechanical结果导入Finite Element modeler模块,更新,此时在缺陷附近的单元节点位置发生改变。
ANSYS作业四圆柱壳地非线性屈曲分析报告

有限元原理与工程应用题目圆柱壳的非线性屈曲分析年级与专业机械电子工程所在学院(系)机械工程学系梁结构的瞬态完全法分析1要求用弧长法进行一个圆柱壳的非线性屈曲分析。
一个对边简支的圆柱壳,在其中心作用一个垂直的集中载荷。
目的是分析当载荷大小为1000N时,A、B两点的垂直位移(UY)。
材料特性:EX=3.1x10⁹Pa (杨氏模量)NUXY=0.3 (泊松比)几何特性:R=2540 mm L=254 mmH=6.35 mm θ=5.7°载荷:p=1000 N采用2D的shell单元定义了厚度,由于该圆柱壳结构为对称结构,故实际操作时选取1/4结构对其进行分析即可。
2操作步骤求解步骤(GUI方法)2.1定义工作文件名及工作标题(1)定义工作文件名:执行Utility Menu/File/Change Jobname命令,在弹出的Change Jobname对话框中输入文件名为“buckle2.”,同时勾上【New log and error files】,单击按钮。
(2)定义工作标题:执行Utility Menu/File/Change Title 命令,弹出Change Title对话框中输入“Analysis of the buckle”,然后单击按钮。
(3)重新显示:执行Utility Menu/Plot/Replot命令。
2.2显示工作平面(1)显示工作平面,执行Utility Menu/WorkPlane/Display Working Plane命令。
(2)关闭三角坐标符号的显示:执行Utility Menu/PlotCtrls/Window Controls/Window Options命令,弹出Window Options对话框。
在Location of triad 下拉列表框中选择Not shown选项,单击按钮。
2.3建立圆柱壳结构模型2.3.1定义单元类型(1)选择单元类型:执行Preprocessor>Element Type>Add/Edit/Delete命令,弹出复选框【Element Type】,单击“Add”,弹出【Library of Element Types】对话框中选择“Structural Shell”和“Elastic 4node63”,单击Apply按钮。
ansys 屈曲分析详细过程
题目:跨径L=89m ,矢跨比f/L =1/5的圆弧拱,梁高h/L =1/30,梁宽b/L =1/15 求:1.弹性屈曲荷载;2.非线性极限承载能力。
1、 线性屈曲荷载理论计算在理论计算时,先根据圆弧拱的矢跨比查出稳定系数2K :表1 圆弧拱理论计算的稳定系数根据表1查得:290.4K =故其理论弹性屈曲荷载为:43723313.25105933.332966.671290.4 5.381089000xcr EI N q K m l ⨯⨯⨯⨯==⨯=⨯2、拱的弹性屈曲与非线性屈曲对于一般的特征值屈曲分析,主要是在平衡状态,考虑到轴向力或者中面内力对弯曲变形的影响,由最小势能原理,结构弹性屈曲分析归结为求解特征值问题:通过特征值分析求得的解有特征值和特征向量,特征值就是临界荷载系数,特征向量是临界荷载系数对应的屈曲模态。
特征值屈曲分析的流程图如下:[][]0D G KK λ+=图1 弹性屈曲分析流程图非线性屈曲分析是考虑结构平衡受扰动(初始缺陷、荷载扰动)的非线性静力分析,该分析是一直加载到结构极限承载状态的全过程分析,分析中可以综合考虑材料塑性和几何非线性。
结构非线性屈曲分析归结为求解矩阵方程:非线性屈曲分析的流程图如下:图2 非线性屈曲分析流程图[][](){}{}DGK K F δ+=3、非线性方程组求解方法(1)增量法增量法的实质是用分段线性的折线去代替非线性曲线。
增量法求解时将荷载分成许多级荷载增量,每次施加一个荷载增量。
在一个荷载增量中假定刚度矩阵保持不变,在不同的荷载增量中,刚度矩阵可以有不同的数值,并与应力应变关系相对应。
(2)迭代法迭代法是通过调整直线斜率对非线性曲线的逐渐逼近。
迭代法求解时每次迭代都将总荷载全部施加到结构上,取结构变形前的刚度矩阵,求得结构位移并对结构的几何形态进行修正,再用此时的刚度矩阵及位移增量求得内力增量,并进一步得到总的内力。
(3)混合法混合法是增量法和迭代法的混合使用。
屈曲分析实例解析

屈曲分析屈曲分析- 分析内容屈曲分析主要用于研究结构在特定载荷下的稳定性以及确定结构失稳的临界载荷,屈曲分析包括:线性屈曲和非线性屈曲分析。
线弹性失稳分析又称特征值屈曲分析;线性屈曲分析可以考虑固定的预载荷,也可使用惯性释放;非线性屈曲分析包括几何非线性失稳分析,弹塑性失稳分析,非线性后屈曲(Snap-through)分析。
欧拉屈曲buckling结构丧失稳定性称作(结构)屈曲或欧拉屈曲。
L.Euler从一端固支另一端自由的受压理想柱出发.给出了压杆的临界载荷。
所谓理想柱,是指起初完全平直而且承受中心压力的受压杆。
设此柱是完全弹性的,且应力不超过比例极限,若轴向外载荷P小于它的临界值,此杆将保持直的状态而只承受轴向压缩。
如果一个扰动(如—横向力)作用于杆,使其有一小的挠曲,在这一扰动除去后。
挠度就消失,杆又恢复到平衡状态,此时杆的直的形式的弹性平衡是稳定的。
若轴向外载荷P大于它的临界值,柱的直的平衡状态变为不稳定,即任意扰动产生的挠曲在扰动除去后不仅不消失,而且还将继续扩大,直至达到远离直立状态的新的平衡位置为止,或者弯折。
此时,称此压杆失稳或屈曲(欧拉屈曲)。
屈曲分析- 分析分类线性屈曲:是以小位移小应变的线弹性理论为基础的,分析中不考虑结构在受载变形过程中结构构形的变化,也就是在外力施加的各个阶段,总是在结构初始构形上建立平衡方程。
当载荷达到某一临界值时,结构构形将突然跳到另一个随遇的平衡状态,称之为屈曲。
临界点之前称为前屈曲,临界点之后称为后屈曲。
侧扭屈曲:梁的截面一般都作成窄而高的形式,对截面两主轴惯性矩相差很大。
如梁跨度中部无侧向支承或侧向支承距离较大,在最大刚度主平面内承受横向荷载或弯矩作用时,荷裁达一定数值,梁截面可能产生侧向位移和扭转,导致丧失承载能力,这种现象叫做梁的侧向弯扭屈曲,简称侧扭屈曲。
理想轴向受压直杆的弹性弯曲屈曲:即假定压杆屈曲时不发生扭转,只是沿主轴弯曲。
但是对开口薄壁截面构件,在压力作用下有可能在扭转变形或弯扭变形的情况下丧失稳定,这种现象称为扭转屈曲或弯扭屈曲。
最新NX-nastran-中的解算方案类型总结资料

NX nastran中的分析种类(解算方案类型总结)(1)静力分析静力分析是工程结构设计人员使用最为频繁的分析手段,主要用来求解结构在与时间无关或时间作用效果可忽略的静力载荷(如集中载荷、分布载荷、温度载荷、强制位移、惯性载荷等)作用下的响应、得出所需的节点位移、节点力、约束反力、单元内力、单元应力、应变能等。
该分析同时还提供结构的重量和重心数据。
(2)屈曲分析屈曲分析主要用于研究结构在特定载荷下的稳定性以及确定结构失稳的临界载荷,NX Nastran中的屈曲分析包括两类:线性屈曲分析和非线性屈曲分析。
(3)动力学分析NX Nastran在结构动力学分析中有非常多的技术特点,具有其他有限元分析软件所无法比拟的强大分析功能。
结构动力分析不同于静力分析,常用来确定时变载荷对整个结构或部件的影响,同时还要考虑阻尼及惯性效应的作用。
NX Nastran的主要动力学分析功能:如特征模态分析、直接复特征值分析、直接瞬态响应分析、模态瞬态响应分析、响应谱分析、模态复特征值分析、直接频率响应分析、模态频率响应分析、非线性瞬态分析、模态综合、动力灵敏度分析等可简述如下:❑正则模态分析正则模态分析用于求解结构的固有频率和相应的振动模态,计算广义质量,正则化模态节点位移,约束力和正则化的单元力及应力,并可同时考虑刚体模态。
❑复特征值分析复特征值分析主要用于求解具有阻尼效应的结构特征值和振型,分析过程与实特征值分析类似。
此外Nastran的复特征值计算还可考虑阻尼、质量及刚度矩阵的非对称性。
❑瞬态响应分析(时间-历程分析)瞬态响应分析在时域内计算结构在随时间变化的载荷作用下的动力响应,分为直接瞬态响应分析和模态瞬态响应分析。
两种方法均可考虑刚体位移作用。
直接瞬态响应分析该分析给出一个结构随时间变化的载荷的响应。
结构可以同时具有粘性阻尼和结构阻尼。
该分析在节点自由度上直接形成耦合的微分方程并对这些方程进行数值积分,直接瞬态响应分析求出随时间变化的位移、速度、加速度和约束力以及单元应力。
NX_Nastran非线性接触分析例题
UG NX 6.0 NX NASTRAN 6.0
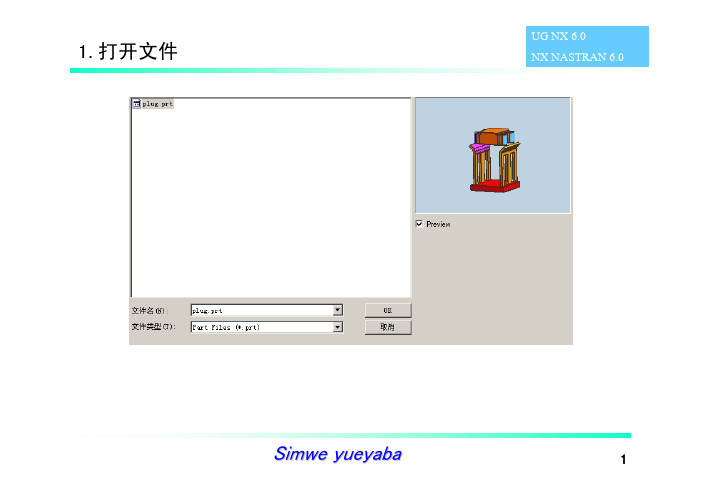
高级静态非线性解析, 需要安装完全模块的NX。 ADVNL601、701实际上是 集成的Adina的解算器
Simwe yueyaba
3
4.定义约束条件
UG NX 6.0 NX NASTRAN 6.0
Constraint--〉New Constraint--〉Fixed Translation Constraint
强迫上面沿Z轴负方 向移动22mm
选择上一步定 义的Table
Field
Simwe yueyaba
6
7.定义接触
Simulation objects--〉Advanced Nonlinear Contact
UG NX 6.0 NX NASTRAN 6.0
定义接触关系,手动选择可 能会相互接触的面,一般情 况下,刚度大的面作为目标 面(Target)
1.打开文件
UG NX 6.0 NX NASTRAN 6.0
Simwe yueyaba
1
2.建立Fem,划分网格
材料:Steel 单元类型:2次四面体 单元大小:2
UG NX 6.0 NX NASTRAN 6.0
材料:ABS 单元类型:2次四面体 单元大小:2
Simwe yueyaba
2
3.建立Sim
底面移动自由度固定
Simwe yueyaba
4
5.定义加载函数
Fields--〉New--〉Table
UG NX 6.0 NX NASTRAN 6.0
注意单位
注意输入 格式
Simwe yueyaba
6.定义强制位移条件
UG NX 6.0 NX NASTRAN 6.0
nastran非线性与线性分析
非线性和线性分析
NAS400, Section 2, April 2011 Copyright 2011 MSC.Software Corporation
S2-1
NAS400, Section 2, August 2011 Copyright 2011 MSC.Software Corporation
S2-8
• 面-面 • 边-面 • 边-边 • 梁-梁 • 刚-柔性体 • SPC / MPC
接触和约束改变
NAS400, Section 2, August 2011 Copyright 2011 MSC.Software Corporation
S2-9
几何非线性
• 大位移,大转动,小应变
P
membrane stiffening
S2-3
• 平衡方程 • 约束条件
线性有限元分析方程(续)
P=
External Load Vector
S
T
T eg
.
Force Transformation
Matrix
ug =
a
Fe
Element Forces
• 转换方程没有改变 • 力等于位移转换 • 约束(SPC, MPC)没有改变
NAS400, Section 2, August 2011 Copyright 2011 MSC.Software Corporation
S2-11
• 屈曲
几何非线性(续)
Panel failure
• “快速滑过”
Skin buckling
NAS400, Section 2, August 2011 Copyright 2011 MSC.Software Corporation
Ansys-第21例非线性屈曲分析实例
第21例非线性屈曲分析实例—悬臂梁本例通过计算悬臂梁的临界载荷,介绍了利用ANSYS进行非线性屈曲分析的方法、步骤和过程。
21.1非线性屈曲分析过程1.建立模型非线性屈曲分析的建模过程与其他分析相似,包括选择单元类型、定义单元实常数、定义材料特性、定义横截面、建立几何模型和划分网格等。
2.求解(1)进入求解器。
(2)指定分析类型。
非线性屈曲分析属于非线性静力学分析。
(3)定义分析选项。
激活大变形效应。
(4)施加初始几何缺陷或初始扰动。
可以先进行线性屈曲分析,将分析所得到的屈曲模态形状乘以一个较小的系数后作为初始扰动施加到结构上,本例即采用该方法。
(5)施加载荷。
所施加的载荷应比预测值高10%一21%。
(6)定义载荷步选项。
(7)设置弧长法。
(8)求解。
3.查看结果在POST26时间历程后处理器中,建立载荷和位移关系曲线,从而确定结构的临界载荷。
21.2问题描述及解析解图21-1 (a)所示为一悬臂梁,图21-1 (b)为梁的横横截面形状,分析其在集中力P作用下的临界载荷。
已知截面各尺寸分别为H=50mm、h=43mm、B=35mm、b=32mm,梁的长度L=1m。
钢的弹性模量E=2xl011N/m2,泊松比p=0.3。
图21-1工子悬臂梁21.3分析步骤21.3.1改变任务名拾取菜单Utility Menu→Jobname,弹出如图21-2所示的对话框,在“[/FJLNAM]”文本框中输入EXAMPLE21,单击“OK”按钮。
21.3.2选择单元类型拾取菜单Main Menu→Preprocessor→Element Type→Add/Edit/Delete,弹出如图21-3所示的对话框,单击“Add.”按钮,弹出如图21-4所示的对话框,在左侧列表中选“Structural Beam”,在右侧列表中选“3 node 189”,单击“OK”按钮,返回到如图21-3所示的对话框,单击“Close”按钮。
ansys 屈曲分析详细过程

非线性屈曲分析的流程图如下:
图 2 非线性屈曲分析流程图
2
3、非线性方程组求解方法 (1)增量法 增量法的实质是用分段线性的折线去代替非线性曲线。增量法求解时将荷载
分成许多级荷载增量,每次施加一个荷载增量。在一个荷载增量中假定刚度矩阵 保持不变,在不同的荷载增量中,刚度矩阵可以有不同的数值,并与应力应变关 系相对应。
图 4 荷载及拱的几何尺寸示意
几何尺寸: f/L=1/5, H/L=1/30,B/图L=图1图/15
L=89m,f=17.8m,H=2.97m,B=5.93m,R=64.5m
材料性能:拱圈采用 C40 混凝土,弹性模量为 32500MPa,泊松比为 0.3。
在 ANSYS 中进行建模分析,初始荷载为 q=100000kN/m 其过程如下:
0.5
K2
58.9
90.4
93.4
86.7
64.0
根据表 1 查得:
K2 90.4
故其理论弹性屈曲荷载为:
qcr
K2
EI x l3
3.25104 1 5933.33 2966.673
90.4
12 890003
5.38107
N
m
2、拱的弹性屈曲与非线性屈曲 对于一般的特征值屈曲分析,主要是在平衡状态,考虑到轴向力或者中面内
力对弯曲变形的影响,由最小势能原理,结构弹性屈曲分析归结为求解特征值问 题:
KD KG 0
通过特征值分析求得的解有特征值和特征向量,特征值就是临界荷载系数, 特征向量是临界荷载系数对应的屈曲模态。
特征值屈曲分析的流程图如下:
1
图 1 弹性屈曲分析流程图
非线性屈曲分析是考虑结构平衡受扰动(初始缺陷、荷载扰动)的非线性静 力分析,该分析是一直加载到结构极限承载状态的全过程分析,分析中可以综合 考虑材料塑性和几何非线性。结构非线性屈曲分析归结为求解矩阵方程:
线性和非线性有限元分析 6
Equations
• The first Equation is the Plastic strain equation: • Where the super script “pl” represents the plastic strain, and “el” represents the linear strain, and Ԑn is the original strain. To calculate the linear strain the following equation is used:
slenderness ratio 细长比 c =design slenderness ratio 设计细长比
A cross-sectional area 截面积
屈曲模式
Engesser’s Tangent Modulus Load 用斜率模数修改后的欧拉公式
P
T cr
ET I
2
L
2
d ( ) ET d y
Elasto-Plastic S-S Curve
Engesser 的减少杨氏模量的修改公式Reduced Modulus Load
P
T cr
ER I
2 2
L I1 E I 2 ET ER I
另一简单形式
P
T cr
ER I
Conclussion小结
• ANSYS produces Favorable results for buckling Analysis. The non-linear Buckling analysis tends to give more conservative results as seen in the figures 非线性分析所得的屈曲临 界力比线性分析的结果也要保守 • Care must be taken, as sometimes non-linear problems may not converge 非线性屈曲问题 可能不收敛
NASTRAN稳态非线性分析
Nastran隐式非线性分析实例MSC.Nastran隐式非线性分析模块是与MSC.Marc求解器所有特征相对应的应用模块,通过该模块,可以分析一系列关于几何,材料以及接触非线性的问题。
同时该模块与MSC.Nastran进行了高度集成,其所有的分析功能,结果处理等,都可以在MSC.Patran中处理。
下面对一个应用实例来详细说明这一求解过程,了解MSC.Nastran隐式非线性分析模块(SOL600)。
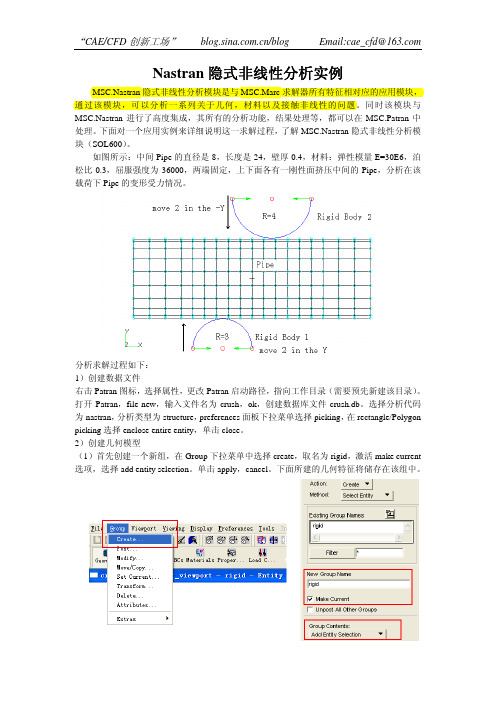
如图所示:中间Pipe的直径是8,长度是24,壁厚0.4,材料:弹性模量E=30E6,泊松比0.3,屈服强度为36000,两端固定,上下面各有一刚性面挤压中间的Pipe,分析在该载荷下Pipe的变形受力情况。
分析求解过程如下:1)创建数据文件右击Patran图标,选择属性,更改Patran启动路径,指向工作目录(需要预先新建该目录)。
打开Patran,file-new,输入文件名为crush,ok,创建数据库文件crush.db。
选择分析代码为nastran,分析类型为structure,preferences面板下拉菜单选择picking,在rectangle/Polygon picking选择enclose entire entity,单击close。
2)创建几何模型(1)首先创建一个新组,在Group下拉菜单中选择create,取名为rigid,激活make current 选项,选择add entity selection。
单击apply,cancel。
下面所建的几何特征将储存在该组中。
(2)创建点1<-3 -7.1 4.5>,点2<0 -7.1 4.5>,通过旋转创建下刚体面上的曲线。
单击geometry 应用工具,create>curve>revolve,在axis中输入{point1[X1 Y 1 5.0]},在total angel输入180,在point list输入point2,单击apply创建curve1。
nastran模态分析理论及实例

模态计算结果
● .f06文件显示的频率结果
特征值
圆频率 (弧度/秒)
周期频率 (Hz)
26
Patran模态分析设置
设置正则模态分析
27
Patran模态分析设置(2)
点击求解类型并 选择正则模态分 析 点击求解参数 Wt.Generator的 节点ID。这里将 计算这个节点的 质量属性。输入0 选择基础坐标系 的原点
– 默认情况下,WTMASS=1.0
● 例子
– MAT1卡片上使用重量密度N/m3,则需要 设置PARAM,WTMASS,0.102
– 转换因子WTMASS=1/g (= 1/9.8=0.102 m/sec2)
21
WTMASS 参数示例
● 例如, 在美国常用inch-pound-second单位体系中建立一个钢结 构模型。 从手册中得到的密度为:
1 23 4 5
6
7
8
9 10
EIGRL SID V1 V2 ND MSGLVL MAXSET SHFSCL NORM
EIGRL 1 0.1 3.2 10
字域 SID V1, V2
ND
内容 兰索斯标识号(唯一 整数> 0) 设定模态分析时的频率范围 或屈曲分析时的特征值范围实数或空白,V1<V2)。 所需特征值数量 (整数 > 0 或者空白)
4
5
质量矩阵(续)
● 耦合质量与集中质量对比
– 耦合质量通常情况比集中质量更加准确。 – 集中质量在动力学计算更加迅速。
● 对模型单元,用户选择耦合质量方法:
– PARAM,COUPMASS,1 选择耦合质量,针对所有的 BAR, ROD, 和 PLATE 单 元,这些包含弯曲刚度。
NX Nastran材料非线性实例分析

NX Nastran材料非线性实例分析
本课目的:1.了解材料非线性的基础理论 2.掌握如何使用NX Nastran解决材料非线性分析 3.探讨材料非线性在非线性分析所占的影响
1.了解材料非线性的基础理论 在之前的课程中,我们讲解了线性与非线性的区别,今天主要来讲一下非线 性影响之一的材料非线性。我们知道大多数的金属材料在小应变时都具有良 好的线性应力-应变关系。这时我们对材料参数只用输入弹性模量和泊松比就 够了,但当材料发生屈曲后,此时材料的S-E关系已不是呈线性的增长,即材 料进入了塑性阶段也就是我们所要讲的材料非线性。
从上图我们可以看到材料完整的S-E曲线,非线性的则为从a点到最后的g点。 关于材料的非线性分析时,对材料参数的定义我们可以分为两种方式: 双重线性塑性材料模型(屈服应力和切线模量) 多重线性塑性材料模型(完整的塑性段S-E曲线) 建议在材料的非线性分析中尽可能使用第二种方法,第一种ห้องสมุดไป่ตู้化的比较大也 是一种很理想的状态,对结果可能会产生较大的误差。
实例的情景假设 此例取材料力学实验中的单轴拉伸试验进行有限元的分析。材料为DQSK36,杨氏模量 207000MPa,泊松比0.28,塑性的应力—应变曲线为图1-1
图1-1
接下来我们进行具体操作:见视频
3.探讨材料非线性在非线性分析所占的影响
从结果我们可以看出,模型发生了大的位移和大的应变,但我们并没有打 开几何大变形开关,有限元的结果是接近遵循材料的应力-应变曲线的。所 以我们可以认为材料的非线性并不关联几何的非线性,但几何的非线性往 往是要关联着材料的非线性(排除大位移小应变),通常几何非线性的发生 即意味着局部的模型进入了塑性状态,所以建议在做几何非线性分析的时 候也要完整的附加材料非线性的参数。
Inventor Nastran非线性分析实战示例:实际应用与操作指南说明书

MFG501490Up and Running with Inventor Nastran Nonlinear Analysis – Real World ExamplesWasim YounisSymetriDescriptionThis session will start with real-life examples demonstrating how engineers and designers like you have greatly benefited from the advanced use of Inventor Nastran simulation technology within their companies. The software has helped them to make informed design decisions early on and enabled them to make cost-effective optimized designs with less impact on the environment, ultimately providing more time to explore “what if” scenarios. Real-life examples will include blast loads, drop tests, elastic/plastic analysis, and permanent deformation. We will then continue by explaining the process of applying nonlinear analysis using a straightforward, step-by-step approach, supported by industry best practices with explanations and tips. Our hope is to help make your Inventor Nastran adoption journey within your workplace successful. We want ultimately to help you simulate complex real-world scenarios early on, enabling the creation of sustainable designs faster and more cost-effectively.Speaker(s)A passionate simulation solutions expert been involved with Autodesk simulation software from when it was first introduced, and is well-known throughout the Autodesk simulation community, worldwide. Also authored the Up and Running with Autodesk Inventor Professional books. He also manages a dedicated forum for simulation users on LinkedIn – Up and Running with Autodesk Simulation. Wasim has a bachelor’s degree in mechanical engineering from the University of Bradford and a master’s degree in computer- aided-engineering from StaffordshireUniversity.Different types of nonlinear behaviourStress, σNonlinear analysis generically falls into the following three categories.Geometric nonlinearity - Where a component experiences large deformations and as a result can cause the component to experience nonlinear behavior. A typical example is a fishing rod.Material nonlinearity - When the component goes beyond the yield limit, the stress/strain relationship becomes nonlinear as the material starts to deform permanently.Contact - Includes the effect of two components coming into contact; that is, they can experience an abrupt change in stiffness resulting in localised material deformation at region of contact.While many practical problems can be solved using linear analysis, some or all its inherent assumptions may not be valid:•Displacements and rotations may become large enough that equilibrium equations must be written for the deformed rather than the original configuration. Large rotations cancause pressure loads to change in direction, and to change in magnitude if there is achange in area to which they are applied.•Elastic materials may become plastic, or the material may not have a linear stress-strain relation at any stress level.•Part of the structure may lose stiffness because of buckling or material failure. •Adjacent parts may make or break contact with the contact area changing as the loads change.Geometric NonlinearityThe geometric nonlinearity becomes a concern when the part(s) deform such that the small displacement assumptions are no longer valid. The large displacement effects area collection of different nonlinear properties, such as:1. Large deflections.2. Stress stiffening/softening.3. Snap-thru.4. Buckling.5. Large strain.Large DeflectionsWhen your components or assemblies start to experience rotations of more than about 10 degrees you should start to consider nonlinear analysis. This is because linear analysis assumes small displacement theory in which sin(θ) ≈ (θ).Stress StiffeningStress stiffening (also known as geometric stiffening) only effects thin structures where the bending stiffness is very small compared to the axial stiffness. For instance, consider the following plate subjected to a load. The structure is fixed around the perimeter. This thin-walled structure will undergo significant stress stiffening as the part transitions from reacting the load in bending, to reacting the load in-plane.The images below show two results of the plate. The first image is results from a nonlinear analysis (peak deflection 3.321mm). The second image is the results from a linear analysis (peak deflection is 26.03mm).Stress stiffening effects are caused by tensile stresses which result from larger displacements, not by the displacements themselves. The actual displacement in the model is not a clear indication of the degree of nonlinearity, nor is the tensile stress magnitude. A similar tension in one geometry or load orientation may result in significantly less stress stiffening than in another.Snap-thru and BucklingOther common geometric nonlinear situations involve snap-thru and buckling problems, often referred to as bi-stable or multi-stable systems. Many snap-thru problems behave nearly linearly until the point where a small amount of additional load causes a large amount of deflection where a secondary stable position is reached. Capturing this snap-thru is a very difficult numerical problem.Large StrainLarge strains are typically associated with large displacements causing permanent deformation as stresses above yield have been exceeded. Cold heading, rubber seal compression, and metal forming are good examples of large strain examples.Material NonlinearityWhen components experience stress above yield then the results obtained from linear analysis are not valid. In these cases, we need to define stress and strain behavior of materials above yield to get an accurate behavior. However, most materials and even metals have some amount of ductility. This ductility allows hot spots to locally yield thus reducing the stresses compared to what a linear analysis would predict.The metal bracket from the image below shows very different stress distributions between linear and nonlinear materials. The right image contains linear analysis results and shows peak stresses well above yield. The nonlinear material analysis on the left shows a different contour due to the stress redistribution. Peak plastic strain was 5.7% in the nonlinear material analysis.Boundary Condition NonlinearityThe most common boundary nonlinearities are:1. Contact.2. Follower forces.ContactContact conditions model the interaction of two separate parts. Boundary conditions such as separation contacts are generally regarded as nonlinear, as the contact allows separation and sliding between components. This type of contact is typically used in bolted connections where two plates are held by the bolts and the plates allowed to slide and separate depending on the extent of the loading conditions. Another example is in impact type analyses as illustrated below.Follower ForcesThis nonlinear effect simply means that the direction of the force moves with deformation or movement of the part. This can be best demonstrated with the cantilevered strip shown below which is loaded with a force of 100N and three analyses are performed with different large displacement settings.The first image shows the unrealistic "growth" that occurs when large displacementeffects are turned off (LGDISP=OFF). The second image shows the results of largedisplacements turned on, but follower forces turned off (LGDISP=2). The final imageuses large displacement effects with follower forces and is the most accurate(LGDISP=ON).Top Inventor Nastran nonlinear tips.Always run a linear analysis first to check if the yield limit has exceeded.Keep model simple and consider symmetry.Perform distortion checks to make sure there are no severely distorted elements.Only apply nonlinear materials in the areas of the model where you expect nonlinear or plastic behavior. This will help to speed up the analysis and can improve the convergence rate.Split faces at contact regions to reduce the number of generated contacts.Use Linear elements instead of Parabolic elements to help with achieving fasterconvergence in results.Use Continuous Meshing for Surface models to connect surfaces eliminating the need to create contacts. Contacts increase solution times.Leave the Number of Increments field blank in the Nonlinear Setup dialogue box. The software will calculate the optimum number of increments.Equivalent Stress Results follow the stress and strain curve data. Use this to analyse your stress and strain results.Use the NPROCESSORS parameter to increase number of cores to help speed up analysis times.Use explicit solvers if you are expecting high strains.Run modal analysis to determine Dominant Frequency W3 required for Nonlinear Transient Response Analysis.Use multiple subcases to determine permanent deformations in Nonlinear Static Analysis.With the first being loaded and second being unloaded.Use multiple subcases to allow different time steps in Nonlinear Transient ResponseAnalysis.Performing analysis using both implicit and explicit solvers.The 1st Simatek example is based on the implicit solver and the following content is directly taken from my new Up and Running with Autodesk Inventor Nastran 2023 – Nonlinear Analysis book.Available from Amazon worldwide.(Image hyperlink takes you to )DP4 – Inlet(Design problem courtesy of Simatek A/S)Key features and workflows introduced in this design problemIntroductionSimatek is a leading manufacturer of industrial emission and air pollution control solutions. Their high-value products and systems, optimise footprint, performance, powder recovery and maintenance for industrial plants worldwide. All at a low cost of ownership.In this design problem we are going to analyse an inlet using the following design informationand goal.Key Features/Workflows 1 Material Nonlinearity2 Nonlinear Static Analysis – Plastic Stress and Strain curve3 Shell Elements - Continuous Mesh Connections 4Multiple subcases – (Actual Permanent Deformation)Design InformationMain StructureMaterial - AISI Carbon Steel 304Youngs Modulus - 193GPaYield Limit- 184MPaPoisson’s Ratio - 0.27Blast Load – 0.082MPaDesign GoalStrain to be less than 10%.Workflow of Design Problem 4IDEALIZATION1 - Simplify assembly as a single surface model.BOUNDARY CONDITIONS1 - Apply materials, loads and constraints to simulate reality.RUN SIMULATION AND ANALYSE1 - Analyse and interpret results.REDESIGN1 - None.IdealizationThe assembly is remodeled as a single surface component to simplify the analysis and to speed up solution times. This includes removing small features like holes and non-structural components.1. Open Inlet.iptBoundary conditions2. Select Environments tab > Select Autodesk Inventor Nastran.3. Double click Generic under Materials from the Model tree.4. Select Material > Select Load Database > Open ADSK_materials.nasmat > Select AISICarbon Steel 304 > Click OK > Specify 184 for Sy > Click OK.The default path to access library is C:\Program Files\Autodesk\Inventor Nastran 2023\In-CAD\Materials.5. Select Idealizations tab > Select Shell Elements for Type of Idealizations > Specify Bodyfor Name of Idealizations > Specify 3mm for t >Select Associated Geometry > Right click in selection entities box > Select Face Chain > Select all faces making up body of the inlet.6. Click New > Select Shell Elements for Type of Idealizations > Specify Support for Name ofIdealizations > Specify 10mm for t > Select Associated Geometry > Select the 4highlighted faces as shown below.7. Click New > Select Shell Elements for Type of Idealizations > Specify Flange for Name ofIdealizations > Specify 6mm for t >Select Associated Geometry > Select the 3 highlighted flange faces as shown below.8. Click OK > Select Constraints > Specify Fixed Constraints for Name > Select bottomflange as shown below > Select Preview so you can see constraint symbol. Adjust display options as desired.9. Click OK > Select Loads > Specify Blast for Name > Select Pressure for Load Type >Specify -0.082 for Magnitude (MPa) > Select Face Chain option from Selected Entities box > Select all faces making up body of the inlet (No Support Plates and Flanges)> Select Preview so you can see load symbol. Adjust display options as desired.10. Click OK > Select Mesh Settings > Specify 50 for Element Size (mm) > Select Linear forElement Order > Select Continuous Meshing.11. Click OK. This will regenerate mesh.Selecting linear elements will help to achieve results convergence quicker.Selecting continuous meshing will connect nodes and elements at adjacent surfaceintersections avoiding the need to use contacts.Continuous meshing will only work if surfaces have no gaps between them.12. Double click Analysis 1 [Linear Static] > Select Nonlinear Static for Analysis Type >Click OK.13. Right click AISI Carbon Steel 304 material > Select Edit > Select Nonlinear > SelectPlastic option > Specify the following values to define the stress and strain curve. First two rows already specified.14. Select Show XY Plot.15. Click OK three times to exist all dialogue boxes.16. Double click Nonlinear Setup 1 > Select All option for Intermediate Output.17. Click OK.Selecting All will save all converged intermediate and bisected increments in the results file.Nastran will calculate the number of increments automatically, if left blank. Typically, a run will complete after 10 iterations.Run simulation and analyse18. Select Run > Click OK when run is complete.Depending on computer specification this can take up to 4mins.19. Right click Results > Select Edit > Select increment showing LOAD = 1.0 > Select SHELLEQUIVALENT STRESS > Select Centroidal for Data Type > Select Visibility Options > Switch visibility off for loads and constraints.Equivalent Stress results in Nastran follow the stress and strain curve specified in theearlier steps.20. Click OK > Select Strain from the results heads-up bar > Select Options from the Resultspanel > Select Contour Options from the Plot dialogue box > Select Specify Min/Max > Specify 0.001 for Data Max > Select Display to update results.The component experiences up to 0.5% strain.21. Click OK > Right click Subcases > Select New > Select Fixed constraint.In Nonlinear analysis subcases are linked, unlike linear analysis where they areindependent of one another.This subcase will start from the previous deformed shape as a result of the blast. In this subcase no blast load will be specified, and we will be able to determine the permanent deformation after the blast load.22. Click OK > Right click Loads in Subcases 15 (new subcase) > Select New > Selecthighlighted face > Specify 0.0001 for Magnitude (N) for Fz direction > Select Preview so you can see load symbol. Adjust display options as desired.For analysis to run we need to specify a negligible load. Location of the load is not important23. Click OK > Select Run.24. Click OK when run is complete.25. Select Shell Equivalent Stress from the results heads-up bar > Select Options from theResults panel > Select increment showing LOAD = 2.0 (No-load) > Select ContourOptions from the Plot dialogue box > Select Centroidal for Data Type > Select Specify Min/Max > > Specify 184 for Data Max > Specify 0 for Data Min > Select Display to update results.The contour plot is showing residual stresses in the component as a result of plastic deformation. So once the load is removed as in this subcase, the material tries to recover the elastic part of the deformation but is inhibited from full recovery due to the adjacent plastically deformed material. Residual stresses can affect fatigue life if the component is subjected to repetitive and cyclic loading. This is the not the case in this example.26. Click OK > Select Displacement from the results heads-up bar.This shows permanent deformation of 16.9mm of the inlet as a result of 5% strain.27. Close File.The step-by-step workflow for Dellner and EMC example is in my new Up and Running with Autodesk Inventor Nastran 2023 – Nonlinear Analysis.NB: Due to copyright issues could not include in this handout.Available from Amazon worldwide. (Image hyperlink takes you to )This book has been written using actual design problems, all of which have greatly benefited from the use of advance simulation technology. For each design problem, I have attempted to explain the process of applying nonlinear analysis using a straightforward, step by step approach, and have supported this approach with explanation and tips. At all times, I have tried to anticipate what questions a designer or development engineer would want to ask whilst he or she were performing the task using Inventor Nastran.The design problems have been carefully chosen to cover the most popular nonlinear analysis capabilities of Inventor Nastran and their solutions are universal, so you should be able to apply the knowledge quickly to your own design problems with more confidence.Chapter 1 provides an overview of Inventor Nastran Nonlinear and the user interface and features so that you are well-grounded in core concepts and the software’s strengths, limitations, and work arounds. Each design problem illustrates a different unique approach and demonstrates different key aspects of the software, making it easier for you to pick and choose which design problem you want to cover first; therefore, having read chapter 1 it is not necessary to follow the rest of the book sequentially.This book is primarily designed for self-paced learning by individuals but can also be used in an instructor-led classroom environment.Page 21 Further Resources and LearningThe following books have also been authored by the speaker and are available from Amazon worldwide. If you have any further questions, you can post them on my LinkedIn User group. Up and Running with Autodesk Simulation | Groups | LinkedIn My contact details if you have any further questions Work email: ************************ Personal email: ************************ Mobile: +44(0)7980 735244 LinkedIn: /in/wasimyounis/。
非线性屈曲问题
ANSYS屈曲笔记总结很多现有的ANSYS资料都对特征值屈曲分析进行了较为详细的解释,特征值屈曲分析属于线性分析,它对结构临界失稳力的预测往往要高于结构实际的临界失稳力,因此在实际的工程结构分析时一般不用特征值屈曲分析。
但特征值屈曲分析作为非线性屈曲分析的初步评估作用是非常有用的。
以下是我经过多次计算得出的一些分析经验,欢迎批评。
1. 非线性屈曲分析的第一步最好进行特征值屈曲分析,特征值屈曲分析能够预测临界失稳力的大致所在,因此在做非线性屈曲分析时所加力的大小便有了依据。
特征值屈曲分析想必大家都熟练的不行了,所以小弟不再罗嗦。
小弟只说明一点,特征值屈曲分析所预测的结果我们只取最小的第一阶,所以你所得出的特征值临界失稳力的大小应为F=实际施加力*第一价频率。
2. 由于非线性屈曲分析要求结构是不“完善”的,比如一个细长杆,一端固定,一端施加轴向压力。
若次细长杆在初始时没有发生轻微的侧向弯曲,或者侧向施加一微小力使其发生轻微的侧向挠动。
那么非线性屈曲分析是没有办法完成的,为了使结构变得不完善,你可以在侧向施加一微小力。
这里由于前面做了特征值屈曲分析,所以你可以取第一阶振型的变形结果,并作一下变形缩放,不使初始变形过于严重,这步可以在Main Menu> Preprocessor> Modeling> Update Geom中完成。
3. 上步完成后,加载计算所得的临界失稳力,打开大变形选项开关,采用弧长法计算,设置好子步数,计算。
4. 后处理,主要是看节点位移和节点反作用力(力矩)的变化关系,找出节点位移突变时反作用力的大小,然后进行必要的分析处理。
特载值分析得到的是第一类稳定问题的解,只能得到屈曲荷载和相应的失稳模态,它的优点就是分析简单,计算速度快。
事实上在实际工程中应用还是比较多的,比如分析大型结果的温度荷载,而且钢结构设计手册中的很多结果都是基于特征值分析的结果,例如钢梁稳定计算的稳定系数,框架柱的计算长度等。
NastranFX非线性分析实例

●3D Nonlinear Static Analysis-Unit : N, mm-Isotropic Material-Solid Element-Rigid Link●Load & Boundary Condition-Displacement-Constraint (Pinned)●Result Evaluation-Displacement Spring00OverviewOverviewModel Type : [3D / General]Click [ ] (Unit System) Button Length : [mm]Click [OK] ButtonClick [OK] ButtonClick Right Mouse Button in Work Window and Select [Hide Datum & Grid]Analysis > Analysis Case (341526)01123456Procedure“Spring.stp”Click [OK] ButtonFile > Import > Geometry (2)0212ProcedureClick [ ] (Displayed)Mesh Size -Element Size : “3”Property : “1”Mesh Set : “Spring”Click [OK] ButtonMesh > 3D Mesh > Auto Mesh Solid (234)510312345ProcedureClick [ ] (Left)Select [Center of Nodes]Selection Filter : [Edge (E)]Select 32Nodes (See Figure)Mesh Set : “Center Point”Click [OK] Button4523222123456ProcedureSelect [Rigid] tabSelect [Rigid Body(RBE2)]Independent Node: Center Point Dependent Node(s) : [Multiple Nodes]Selection Filter : [Face (F)] Select 156Nodes (See Figure) Mesh Set: “Rigid Link”Click [OK] Button 2413567812345678ProcedureCreate> [Isotropic] Select [General]tab ID : “1”, Name : “Alu”Elastic Modulus : “7e5” N/mm2 Poisson's Ratio: “0.346”Mass Density: “2.71e-9” kg/mm3 Factor of Safety Calculation: [No]451 23671234567ProcedureSelect [Nonlinear]tabModel Type : [Plastic]Initial Yield Stress : “95” N/mm2 Click [ ] (Nonlinear Function) Button 12431234ProcedureSelect [Non-spatial] tab Name : “Material”Strain : “0”, Value : “0” Strain : “0.0001357”, Value : “95”Strain : “0.0025”, Value : “100Strain : “0.01”, Value : “110”Strain : “0.1”, Value : “120”Strain : “1”, Value : 130”Click [OK] ButtonAnalysis > Function > General Function (234)You have to Click Next Row at theTable to Finish the Input.Plastic Type Stress-Strain FunctionStarts at Origin.Second Row of Strain Column“0.0001357” is End Point of Elastic Strain Range, and it can beCalculated With Initial Yield Stress Factor. 1081234ProcedureCreate > [Isotropic]Nonlinear Function : [Material]Click [OK] ButtonClick [Close] Button2311234ProcedureCreate > [3D…]Select [Solid] tab ID : “1”, Name : “Alu”Material : [1: Alu]Click [OK] Button Click [Close] Button235461123456ProcedureAnalysis > Boundary Condition >Constraint…Click [ ] (Left)BC Set : “BC”Selection Filter : [Face (F)]Select 344Nodes (See Figure)Click [Pinned] ButtonClick [OK] Button562 4111234563 ProcedureLoad Set : “Force”Select1 Node Marked by [ O ](See Figure)F3 : “-120”NClick [OK] Button41 231234ProcedureClick [Add...]ButtonTitle : “Nonlinear”Solution Type : [Nonlinear Static(106)]Drag & Drop [Force]to “All Sets”WindowClick [ ] (Analysis Control) Button41 32512345ProcedureSelect [Nonlinear] tabCheck on and Input [Displacement(U)]:“0.001”Check off [Load (P)]Check on : [Work (W)]:“0.0001”Click [OK] ButtonClick [Add/Modify Subcases…]Button2341 1234ProcedureClick [New]Button Label : “Loading”Drag & Drop “Force” to “Active Set”WindowClick [Update] Button Click [New] Button Label : “Unloading”Click [Update] ButtonClick [Close] ButtonClick [OK] Button on Add/Modify Analysis Case (Master Case) Dialogue BoxClick [Close] Button on Analysis Case Manager Dialogue Box7851234612345678910ProcedureAnalysis > Solve...File > [Save…] (Spring.fnb)Model Works Tree :[Geometry]Click Right Mouse Button and Select [Hide All]Analysis > [Solve...]Select [Use Sockets]Click [OK] Button 235616123456ProcedureDouble Click [TOTAL TRANSLATION]Select [Deformed+Undeformed]in Tool Bar Post DataProperty Window -Scale Factor : “10”Actual Deformation : [True]Click [Apply] ButtonResult Works Tree : Spring_Nonlinear > INCR 10, LOAD=1.0(1) >Displacement152341712345ProcedureDouble Click [SOLID VON MISES]Result Works Tree : Spring_Nonlinear > INCR 10, LOAD=1.0(1) >3D Element Stresses1181ProcedureDouble Click[TOTAL TRANSLATION]Result Works Tree : Spring_Nonlinear > INCR 10, LOAD=0.0 > Displacement1191ProcedureResult Works Tree : Spring_Nonlinear > INCR 10, LOAD=0.0 >3D Element StressesDouble Click [SOLID VON MISES]1201Procedure2341Data : [TOTAL TRANSLATION(V)]Click [Select All] Button Select 1NodeClick [Table] Button1234ProcedureDrag [Step Value], [Node : 22] Column on TableClick Right Mouse Buttonand Select [Graph…]Enter X Label, Y Label, Graph Title Click [OK]Buttonon Graph View DialogClick [ ](Initial Post Style)123412345ProcedureLeaf Spring●3D Nonlinear Static Analysis-Unit : N, mm -“Leaf Spring.stp”-Isotropic Material -Tetra Element,Quadrilateral Element●Load & Boundary Condition-Displacement -Constraint●Result Evaluation-Displacement-Extract Result00Overview OverviewModel Type : [3D/General]Click [ ] Button (Unit System)Length : [mm]Click [OK] Button Click [OK] ButtonClick Right Mouse Button in Work Window and Select [Hide Datum & Grid]341526Analysis > Analysis Setting…01123456Procedure“Leaf Spring.stp ”Click [OK] ButtonFile > Import > Geometry…20212ProcedureClick [ ] (Displayed) Mesh Size-Element Size: “2”Property : “1”Mesh Set : “Spring”Click [OK] Button2 34 5112345ProcedureSelect 1Face (See Figure)Mesh Size -Element Size : “5”Property : “2”Mesh Set : “Plate”Click [OK] Button2345112345ProcedureCreate > [Isotropic]Select [General]tab ID : “1”, Name : “Steel”Elastic Modulus : “2e5” N/mm 2Poisson's Ratio : “0.266”Factor of Safety Calculation : [No]Click [Apply] ButtonAnalysis > Material…1632457051234567ProcedureSelect [General]tab ID : “2”, Name : “Rigid”Elastic Modulus : “2e8” N/mm 2Poisson's Ratio : “0.266”Factor of Safety Calculation : [No]Click [OK] Button Click [Close] Button75123461234567ProcedureCreate > [3D...]Select [Solid] tab ID : “1”, Name : “Spring”Material : [1: Steel]Click [OK] Button5412312345ProcedureCreate > [2D…] Select [Plate] tabID : “2”, Name : “Rigid Plate”Material: [2: Rigid]T/T1 : “1”mmClick [OK] ButtonClick [Close] Button6417 51 2 3 4 5 6 7Procedure23Analysis > Contact > Manual Contact Pair…Select Elements by Mouse DraggingName :“Contact pair”Penetration Type :[General Contact]Scheme : [Two Way]Master -[2D Element] : 64Elements (See Figure)Slave -[Surface]: 2Faces (See Figure)Click [OK] Button544551234609123456ProcedureAnalysis > Boundary Condition > Constraint…Click [ ] (Top) BC Set : “BC”Selection Filter : [Face (F)]Select 316Nodes (See Figure)Check on [T1], [T2]Click [Apply] Button Select 18Nodes(See Figure) Click [Fixed] ButtonClick [OK] Button23474586910123456789ProcedureAnalysis > Static Load >Displacement…Load Set : “Displacement”Selection Filter : [Face (F)] Select 316NodesCheck on [T3]: “-7.5”Click [OK] Button13451112345ProcedureClick [Add…] Button Name : “Nonlinear”Solution Type : [Nonlinear Static(106)]Click [OK] ButtonClick [Close] Button on Analysis CaseManager DialogueAnalysis > Analysis Case…513241212345ProcedureAnalysis > Solve...File > [Save…] (Leaf Spring.fnb)Model Works Tree : [Geometry]Click Right Mouse Button and Select [Hide All]Analysis > [Solve...]Select [Use Sockets]Click [OK] Button 235613123456ProcedureDouble Click[TOTAL TRANSLATION]Select [Deformed+Undeformed]in Post Data Tool BarClick [ ] (Actual Deform) in PostData Tool BarResult Works Tree : Leaf Spring_Nonlinear > INCR 10, LOAD=1.0(1) >Displacement1214123ProcedureDouble Click [SOLID VON MISES]Edge Type : [No Edge] (See Figure)Result Works Tree : Leaf Spring_Nonlinear > INCR 10, LOAD=1.0(1) >3D Element Stresses121512ProcedureClick [ ] (Animation) in Post Style Tool BarClick [ ] (Multi-Step Animation Recording) in Post Style Tool Bar Click [ ] (Animation Step) in Post Style Tool BarClick [Select All] Button Click [OK] ButtonClick [ ](Record)ButtonClick [ ] (Initial Post Style)546Result Works Tree : Leaf Spring_Nonlinear > INCR 10, LOAD=1.0(1) >3D Element Stresses312161234567ProcedureProbe●3D Nonlinear Static Analysis-Unit : N, mm -“Probe.stp”●Load & Boundary Condition-Constraint -Displacement●Result Evaluation-Deformed Shape -von Mises Stress00Overview OverviewModel Type : [3D / General]Click [ ](Unit System)Button Length : [mm]Click [OK]Button Click [OK]ButtonAnalysis > Analysis Setting…125430112345ProcedureAnalysis Setting Dialogue box isautomatically activated at Startup.Select “Probe.stp”Check off [as Compound]Click [OK]ButtonClick Right Mouse Button in Work Window and Select [Hide Datum & Grid]File > Import > Geometry…342Display/non-display and position changeof the scale, which is found in the upper left side of work window, can be done by setting View > Scale item in the Tool > Display option dialogue box.Display/non-display of the globalcoordinate system, which is on the bottom right side of the screen, can be done by setting [Toggle GCS Triad]menuclicking on right mouse button.021234ProcedureClick 3Edges Marked by [O ]Click [OK]Button Click [Close]Button23Geometry > Curve >Make Wire…03123ProcedureSelect 1FaceNumber of Division : “10”Property : “1”Property : “Plate”Click [OK]Button32541Mesh > 2D Mesh > Map Mesh Face…0412345ProcedureSelect 1 Edge (See Figure)Number of Division: “12”Property : “1”Click [OK]Button3241Mesh > 2D Mesh > Auto Mesh Planar Area (05)1234ProcedureSelect 21Elements Division : “10”Scale Factor : “0.2”Selection Filter : [Wire (W)]Select 1WireCheck on [Orthogonal Sweep]Source Mesh : [Delete]Property : “2”Name : “Probe”Click [ ] (Preview) Button Click [OK]Button921161810435Mesh > Protrude Mesh > Sweep…7061234567891011ProcedureSelect [Spring/Mass] tab Select [Spring]Select [Ground]Select 11Nodes Check on [T1]Select [Direct Property Definition]Spring Constant : “1e -6”Mesh Set : “Dummy Spring”Click [OK]Button91478Mesh > Element > Create Element…236507123456789ProcedureCreate > [ 2D… ]Select [Plate]tabID : “1”, Name : “Plate”Click [ ] (Material) Button Create > [Isotropic]Select [General]tabID : “1”, Name : “Plate Mat”Elastic Modulus : “1.0e+6”Poisson’s Ratio : “0.2”Click [OK]ButtonClick [Close]ButtonMembrane Material : [1:Plate Mat] Click [OK]Button35467891011 132112Analysis > Property (08)12345678910111213Procedure。
- 1、下载文档前请自行甄别文档内容的完整性,平台不提供额外的编辑、内容补充、找答案等附加服务。
- 2、"仅部分预览"的文档,不可在线预览部分如存在完整性等问题,可反馈申请退款(可完整预览的文档不适用该条件!)。
- 3、如文档侵犯您的权益,请联系客服反馈,我们会尽快为您处理(人工客服工作时间:9:00-18:30)。
实例的情景假设 此例为一个L型梁,模型尺寸、截面见图1-1。材料参数:弹性模量为处施加载荷。先对其进行线性屈曲分析确 定非线性屈曲的初始载荷。
图1-1
接下来我们进行具体操作:见视频
有限元值:(L)Pcr=15600N (NL)Pcr=14200N 通过比值来看,我们发现其结果比较接近。原因在于我们 此例是非线性弹性屈曲,不考虑材料的非线性行为 谢谢!
大家好!
NX Nastran非线性屈曲实例分析
本课目的:1.了解非线性屈曲分析 2.掌握如何使用NX Nastran解决非线性屈曲问题 3.线性与非线性结果比较
1.非线性屈曲分析基础理论介绍 非线性屈曲行为就可充分的考虑到3大非线性问题,这里主要以几何非线性 为主导分析结构的不稳定倒塌和后屈曲状态。 在NX Nastran中求解非线性屈曲我们采用弧长法(载荷-位移控制法),通过对 某个可能会出现最大位移的节点进行控制,能够建立不稳定响应段的静力平 衡,此方法适用于载荷为比例加载。
建议大家在求解非线性问题上,都一致采用SOL 601,106 高级非线性静力学进 行解算,不建议采用SOL 106 非线性静力学解算。因为结构分析中最后三种解 算方案都采用的是Adina的解算核心。Adina在非线性领域有着极强的求解能 力,甚至可以说是要高出Abaqus的。我比较过Nastran本身的非线性解算方案 106,在求解轻微的非线性问题上,其结果还有一定可参考价值。。。
