房屋空置率的分析研究
中国房地产市场房屋空置率的问题

中国房地产市场房屋空置率的问题近年来,中国的房地产市场一直备受关注。
全国范围内出现的大量空置房屋给市场带来了一系列的问题。
本文将探讨中国房地产市场房屋空置率的问题,并分析其原因和可能的解决方案。
引言中国是世界上人口最多的国家之一,快速城市化进程使得对住房需求的增长迅猛。
然而,在不断扩大的住房需求下,空置房屋的数量也在持续增加,给经济和社会带来了一系列的负面影响。
问题分析1.1.住房空置率上升中国的房屋空置率逐年上升,尤其是一线和热门二线城市。
根据数据显示,超过20%的住房处于空置状态,这对房地产市场稳定和经济发展带来了不可忽视的风险。
1.2.房屋投资热潮房地产投资在中国一度被视为“金饭碗”,许多人将其视为快速获取财富的途径。
这导致许多投资者购买房屋仅仅为了投资和炒作,而非真正的居住需求。
1.3.地方政府经济发展压力为了促进经济发展,地方政府常常推出各种鼓励房地产开发和销售的政策。
然而,过度投资和建设导致了供应过剩,进一步加剧了空置房屋的问题。
原因分析2.1.投机炒作和投资需求由于中国股市的不稳定和限制性政策,许多投资者将目光转向了房地产市场。
他们购买多套房屋,希望通过炒卖获取暴利。
这种投机炒作导致了房屋空置现象的加剧。
2.2.户籍制度和社会保障限制中国的户籍制度使得农村人口在城市购房和享受公共服务方面存在较大的障碍。
这导致了城市居民与农民工之间的居住差距,一些房屋也因此空置。
2.3.缺乏有效的调控政策尽管中国政府出台了一系列调控政策,但很多政策执行效果有限。
一些地方政府过度倚赖房地产市场带来的经济收入,缺乏进一步的限制和监管。
解决方案3.1.健全土地供应机制政府应当更好地掌握土地供应和分配的权力,避免过度开发和投资。
合理的土地供应机制将有助于平衡房地产市场,降低房屋空置率。
3.2.加强住房租赁市场建设发展租赁市场,推动房屋租售平衡,为需要租房的人提供更多选择。
同时,建立公共租赁住房体系,满足低收入人群的基本住房需求。
房地产市场的房屋空置率问题与解决方案

房地产市场的房屋空置率问题与解决方案随着城市化进程的不断加快,房地产市场的发展也日益繁荣。
然而,与此同时,我国房屋空置率问题也逐渐凸显出来。
本文将重点探讨房地产市场的房屋空置率问题及相关解决方案。
一、房屋空置率问题的原因1.1需求与供应失衡在房地产市场中,需求与供应的失衡是导致房屋空置率问题的一个主要原因。
随着经济的发展和人口的增加,对住房的需求持续上升,而供应方面则存在一些不足。
一方面,一些房地产项目由于地理位置较偏远、基础设施不完善等原因,导致吸引力降低,无法满足购房者的需求;另一方面,一些投机性的投资者购买房产后未能及时出售或租赁,造成了大量的空置房屋。
1.2投资属性过强房地产投资的高回报性和较低风险性使得不少投资者将购房视为炒房的手段,这加剧了房屋空置率问题。
购房者在购置房产后,往往将其保持空置,期待房价上涨后再进行抛售。
这种投机行为使得大量房屋长期处于空置状态,影响房地产市场的健康发展。
二、房屋空置率问题的影响2.1资源浪费房屋空置率高意味着大量的资源浪费。
这些空置房屋未被充分利用,导致建筑物的磨损程度加剧,同时也浪费了土地资源和建筑材料等资源。
2.2缺乏住房供应房屋空置率的上升导致住房供应不足,使得一部分人无法找到适合的住房条件。
这加剧了城市中的住房紧张现象,限制了城市发展和居民的生活质量。
三、房屋空置率问题的解决方案3.1优化土地利用为了解决房地产市场的房屋空置率问题,应优化土地利用。
政府应加强对土地资源的规划和管理,鼓励开发商将地块资源用于建设更有市场需求的住房项目,避免开发过度和浪费。
3.2调控投资属性为了减少投机性购房,政府可以采取措施调控房地产市场,限制投资者购房的目的。
例如,提高购房门槛、加大房地产税率、建立长效机制等,以降低房地产投资的吸引力。
3.3加大住房租赁市场发展力度租赁市场是解决房屋空置率问题的有效途径之一。
政府应加大对住房租赁市场的发展力度,提供相应的扶持政策和利益保障,吸引投资者和租房者参与其中。
房地产市场的空置率与利用率问题

房地产市场的空置率与利用率问题随着城市化进程的加速和人口增长,房地产市场成为经济中的重要组成部分。
然而,近年来,人们越来越关注房地产市场的空置率与利用率问题。
本文将就此进行探讨,分析其原因、影响以及相应的解决方案。
一、空置率问题空置率是指处于未出租或未住人状态的房屋数量与总房屋数量的比值。
在房地产市场中,空置率既反映了供求关系,也关系到资源的有效利用程度。
目前,空置率问题呈现出以下几个主要特点。
首先,大城市的空置率居高不下。
这主要是因为在城市化过程中,大量人口涌入使得需求与供给之间的差距加大,导致大量房屋无人居住。
其次,一些地方政府盲目追求经济利益,过度投资房地产项目,导致房屋供应过剩和空置率上升。
最后,一些购房者出于投资目的而购买闲置房屋,这也为空置率的上升提供了条件。
空置率问题带来了诸多负面影响。
首先,空置房屋的存在浪费了大量的资源,包括土地、建筑材料和人力资源等。
其次,高空置率不利于房地产市场的健康发展,会造成市场价格下降,对整个经济产生不利影响。
同时,空置房屋还可能给市容环境和社会治安带来负面影响,影响城市形象和居民安全感。
为解决空置率问题,政府和相关部门应采取有效措施。
首先,应制定严格的土地政策,限制过度投资,避免房地产市场供应过剩。
其次,可以采取税收、贷款利率等手段激励购房者居住或出租空置房屋,从而提高利用率。
此外,应完善房地产市场调控机制,加强市场监管,减少投机行为,有效防止房屋闲置现象。
二、利用率问题利用率是指住宅或商业用地的实际使用面积与总面积的比值。
与空置率问题相对应,利用率问题主要表现为资源浪费和发展不平衡。
一方面,由于各种原因,包括不合理规划、建筑结构老化等,部分住宅和商业用地的利用率较低。
这既浪费了土地资源,也影响了房地产市场的有效供给。
另一方面,一些地区的利用率过高,导致部分地区发展不平衡,造成资源分配不均等问题。
提高利用率问题需要政府和相关部门采取一系列措施。
首先,应完善土地规划和建筑设计,加强对住宅和商业用地利用的监管和引导。
房地产市场的房屋空置率
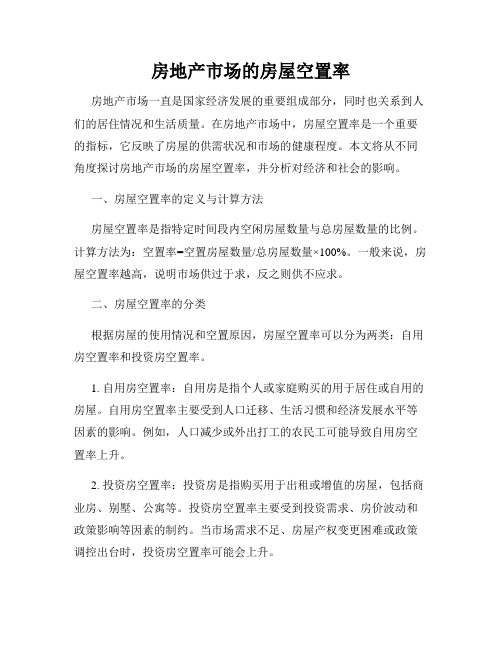
房地产市场的房屋空置率房地产市场一直是国家经济发展的重要组成部分,同时也关系到人们的居住情况和生活质量。
在房地产市场中,房屋空置率是一个重要的指标,它反映了房屋的供需状况和市场的健康程度。
本文将从不同角度探讨房地产市场的房屋空置率,并分析对经济和社会的影响。
一、房屋空置率的定义与计算方法房屋空置率是指特定时间段内空闲房屋数量与总房屋数量的比例。
计算方法为:空置率=空置房屋数量/总房屋数量×100%。
一般来说,房屋空置率越高,说明市场供过于求,反之则供不应求。
二、房屋空置率的分类根据房屋的使用情况和空置原因,房屋空置率可以分为两类:自用房空置率和投资房空置率。
1. 自用房空置率:自用房是指个人或家庭购买的用于居住或自用的房屋。
自用房空置率主要受到人口迁移、生活习惯和经济发展水平等因素的影响。
例如,人口减少或外出打工的农民工可能导致自用房空置率上升。
2. 投资房空置率:投资房是指购买用于出租或增值的房屋,包括商业房、别墅、公寓等。
投资房空置率主要受到投资需求、房价波动和政策影响等因素的制约。
当市场需求不足、房屋产权变更困难或政策调控出台时,投资房空置率可能会上升。
三、房屋空置率的影响因素1. 经济环境:经济繁荣与房屋需求正相关。
当经济增长迅速时,人们的购买力和购房意愿会增强,导致房屋需求上升,房屋空置率相应下降。
相反,经济衰退时,购房需求下降,空置率可能升高。
2. 城市化进程:人口流动和城市化进程对房屋空置率有重要影响。
随着城市化进程的推进,人口聚集于城市,特别是一线和二线城市,导致这些城市的房屋供不应求,房屋空置率相对较低。
而一些落后地区的房屋空置率可能较高,需要加强经济发展和吸引人口。
3. 政策调控:政府的房地产政策直接影响房屋空置率。
政府通过限购、限售、提高房屋购买成本等手段来调控房地产市场,降低投资房空置率,促进住房市场的健康发展。
四、房屋空置率的社会经济影响1. 经济影响:高房屋空置率可能意味着投资回报较低,对于房地产开发商和投资者来说是不利的。
城市房地产市场的空置率分析
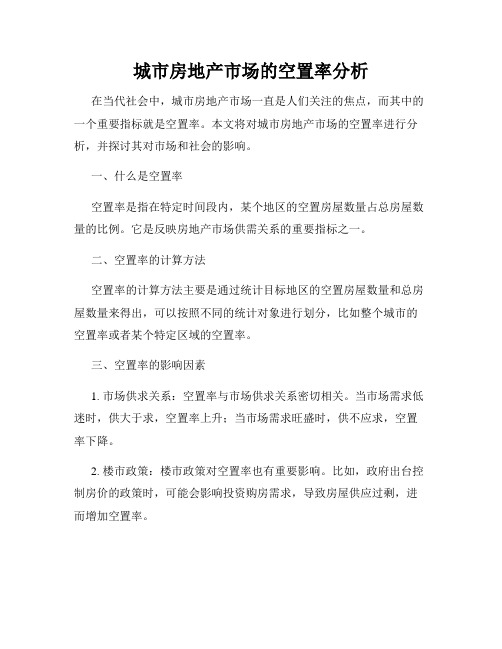
城市房地产市场的空置率分析在当代社会中,城市房地产市场一直是人们关注的焦点,而其中的一个重要指标就是空置率。
本文将对城市房地产市场的空置率进行分析,并探讨其对市场和社会的影响。
一、什么是空置率空置率是指在特定时间段内,某个地区的空置房屋数量占总房屋数量的比例。
它是反映房地产市场供需关系的重要指标之一。
二、空置率的计算方法空置率的计算方法主要是通过统计目标地区的空置房屋数量和总房屋数量来得出,可以按照不同的统计对象进行划分,比如整个城市的空置率或者某个特定区域的空置率。
三、空置率的影响因素1. 市场供求关系:空置率与市场供求关系密切相关。
当市场需求低迷时,供大于求,空置率上升;当市场需求旺盛时,供不应求,空置率下降。
2. 楼市政策:楼市政策对空置率也有重要影响。
比如,政府出台控制房价的政策时,可能会影响投资购房需求,导致房屋供应过剩,进而增加空置率。
3. 经济发展水平:经济发展水平也是影响空置率的重要因素。
经济繁荣时,人们购买房屋的需求增加,空置率相对下降;而经济不景气时,购房需求减少,空置率相对上升。
四、空置率带来的影响1. 对房地产市场的影响:空置率上升会导致房地产市场的供大于求,房价可能下跌。
而空置率下降则会推动房价上涨,促进市场活跃。
2. 对社会经济的影响:高空置率意味着低效利用资源,造成社会资源的浪费和社会资金的损失。
同时,高空置率也会影响居民消费和投资,进而影响整个经济的发展。
3. 社会问题的衍生:高空置率可能导致社会问题的产生,例如占用资源、环境损害、城市贫困等。
解决空置率问题对于社会稳定和可持续发展具有重要意义。
五、降低空置率的措施1. 调控政策:政府可以通过出台楼市调控政策,控制供应量,稳定市场需求,从而降低空置率。
2. 多元化利用:将空置房屋转变为商业用途或者其他社会服务设施,充分发挥其潜在价值。
3. 加强监管:加强对房地产市场的监管力度,防止投机炒房行为,避免产生过高的空置率。
未来房地产市场中的空置率分析
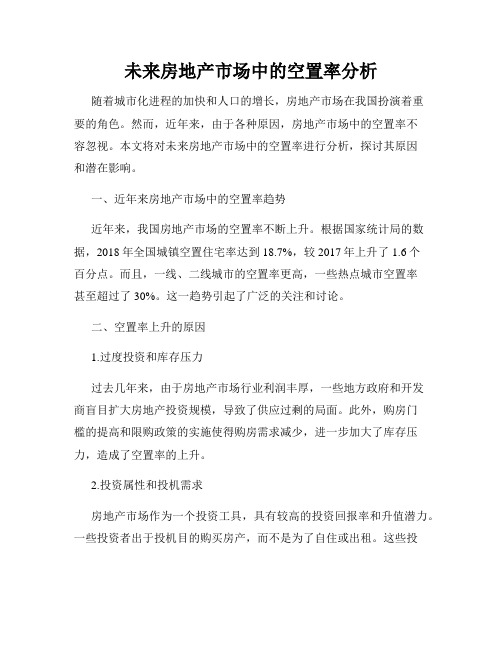
未来房地产市场中的空置率分析随着城市化进程的加快和人口的增长,房地产市场在我国扮演着重要的角色。
然而,近年来,由于各种原因,房地产市场中的空置率不容忽视。
本文将对未来房地产市场中的空置率进行分析,探讨其原因和潜在影响。
一、近年来房地产市场中的空置率趋势近年来,我国房地产市场的空置率不断上升。
根据国家统计局的数据,2018年全国城镇空置住宅率达到18.7%,较2017年上升了1.6个百分点。
而且,一线、二线城市的空置率更高,一些热点城市空置率甚至超过了30%。
这一趋势引起了广泛的关注和讨论。
二、空置率上升的原因1.过度投资和库存压力过去几年来,由于房地产市场行业利润丰厚,一些地方政府和开发商盲目扩大房地产投资规模,导致了供应过剩的局面。
此外,购房门槛的提高和限购政策的实施使得购房需求减少,进一步加大了库存压力,造成了空置率的上升。
2.投资属性和投机需求房地产市场作为一个投资工具,具有较高的投资回报率和升值潜力。
一些投资者出于投机目的购买房产,而不是为了自住或出租。
这些投资者看中的是短期内的利润,不愿意将房屋租出,从而导致了空置率的增加。
3.城镇化进程和人口流动长期以来,农民工等外来人口涌入城市,加剧了城市的人口流动。
这导致了一些区域人口的快速增长和城市的供需矛盾,使得人口流动性大,空置率上升。
三、空置率上升的潜在影响1.房地产市场的波动空置率上升会导致房地产市场的供需关系紊乱,降低楼市的稳定性,增加了市场风险。
空置率过高还将使得开发商和投资者面临租金收入减少和房价下跌的风险。
2.资源浪费和环境压力空置率的增加意味着房屋资源的浪费和利用效率的降低。
大量的空置房屋需要维护和管理,浪费了社会资源。
此外,空置房屋还给城市环境带来了一定的压力,增加了城市的维护和管理成本。
3.社会稳定问题空置房屋的增加可能导致一些社会稳定问题。
首先,空置率上升会影响房屋供应,使得一些人难以找到适合的住房。
其次,一些空置房屋可能成为不法分子的藏身之地,增加社会治安隐患。
住宅市场空置率与回报率分析

资源配置效率
过高的空置率意味着资源的浪费,降低了资源配置的效率。
03
住宅市场回报率分析
回报率定义与计算
回报率定义
回报率是指投资某项资产或项目所获 得的收益与投资成本的比率。在住宅 市场中,回报率通常指的是租金收入 与房屋购买价格的比值。
选择优质物业
投资者应选择地理位置优越、租金收益稳定的优质物业进行投资,以 提高回报率和降低风险。
THANKS
感谢观看
06
结论与建议
研究结论
空置率与回报率呈负相关
01
随着空置率的上升,回报率呈现下降趋势。
不同地区空置率差异较大
02 一线城市和二线城市的空置率较低,而三线和四线城
市空置率较高。
回报率受租金水平和市场需求影响
03
在租金水平较高、需求旺盛的市场中,回报率相对较
高。
对市场的建议
01
优化住宅供应结构
根据市场需求和空置率情况,合 理规划住宅供应,避免过度供大 于求。
住宅市场空置率分析
空置率定义与计算
空置率定义
住宅市场空置率是指某一时期内空置 待租的住宅面积占全部住宅面积的比 例。
计算方法
空置率的计算公式为空置面积 / 总住 宅面积 × 100%。
空置率影响因素
经济因素
01
经济发展状况、就业情况、居民收入水平等都会影响住宅市场
的需求,进而影响空置率。
政策因素
住宅市场空置率与回报率
分析
汇报人:可编辑
2024-01-06
• 引言 • 住宅市场空置率分析 • 住宅市场回报率分析 • 空置率与回报率的关联性分析 • 案例研究 • 结论与建议
商业地产数据分析报告办公楼空置率分析和市场趋势

商业地产数据分析报告办公楼空置率分析和市场趋势商业地产数据分析报告一、背景随着城市发展的不断推进,商业地产市场的竞争也越来越激烈。
办公楼作为商业地产市场中的重要一环,其空置率的高低对整个市场的走势和趋势产生着重要的影响。
因此,本文主要对商业地产市场的办公楼空置率进行了研究和分析,力求为相关企业和机构提供分析和决策支持。
二、数据来源本文所使用的数据来源于国家统计局、商业地产行业协会以及各大地产咨询公司的报告。
我们对这些数据进行了全面的筛选和梳理,保证其准确性和可靠性。
三、办公楼空置率分析1. 空置率概况根据数据统计,目前我国办公楼市场的平均空置率约为18%。
其中,一线城市的办公楼空置率普遍较低,而二三线城市的办公楼空置率相对较高。
2. 空置率原因分析(1)供过于求随着近几年城市化进程的不断推进,大量的国有土地被出让给房地产开发商。
这使得房地产市场的供应量逐渐增加,而需求量相对较少,导致供过于求的情况出现。
(2)租赁模式更新近几年,随着共享经济和互联网技术的迅速发展,越来越多的年轻人选择在共享办公空间中工作,而不是租用整栋办公楼。
这种新型的办公模式,也成为了办公楼空置率上升的重要原因之一。
(3)用途多元化在过去的几十年里,我国的大量商业用地被开发成了针对企业的办公楼。
而随着人们对于商业空间多元化的需求增加,传统型办公楼的市场份额逐渐缩小,这也意味着办公楼空置率不断上升。
四、市场趋势分析1. 未来办公楼市场发展趋势随着城市的不断发展和国家经济调整结构的深入推进,未来一段时间内,我国办公楼市场的供需关系将得到有效的缓解。
市场竞争的程度也将会逐步加强,而优秀的房地产项目将会得到更多的用户认可和关注。
2. 行业投资方向在办公楼空置率高企的背景下,部分机构开始寻找投资商业地产的新出路。
例如,未来共享空间、跨境电商中心、以及物流仓储等,将成为商业地产行业的新兴投资方向。
五、结论综合以上的所有分析,我们可以得出以下结论:(1)当前我国办公楼市场的空置率依然偏高,供需关系亟需得到进一步的优化和调整。
空置率时间变化趋势
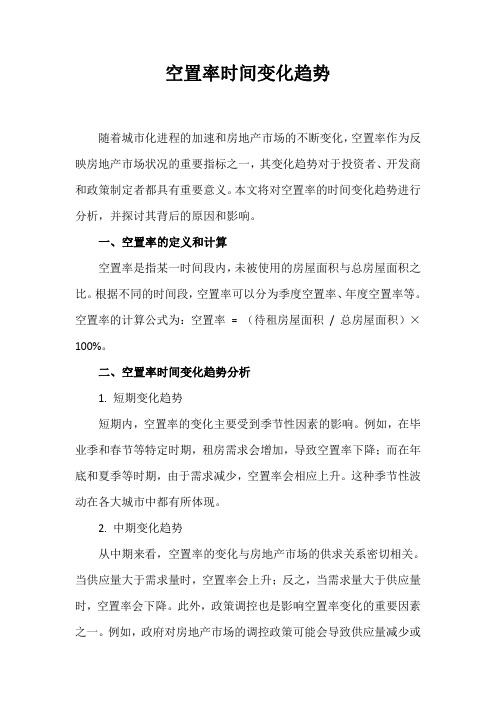
空置率时间变化趋势随着城市化进程的加速和房地产市场的不断变化,空置率作为反映房地产市场状况的重要指标之一,其变化趋势对于投资者、开发商和政策制定者都具有重要意义。
本文将对空置率的时间变化趋势进行分析,并探讨其背后的原因和影响。
一、空置率的定义和计算空置率是指某一时间段内,未被使用的房屋面积与总房屋面积之比。
根据不同的时间段,空置率可以分为季度空置率、年度空置率等。
空置率的计算公式为:空置率=(待租房屋面积/总房屋面积)×100%。
二、空置率时间变化趋势分析1.短期变化趋势短期内,空置率的变化主要受到季节性因素的影响。
例如,在毕业季和春节等特定时期,租房需求会增加,导致空置率下降;而在年底和夏季等时期,由于需求减少,空置率会相应上升。
这种季节性波动在各大城市中都有所体现。
2.中期变化趋势从中期来看,空置率的变化与房地产市场的供求关系密切相关。
当供应量大于需求量时,空置率会上升;反之,当需求量大于供应量时,空置率会下降。
此外,政策调控也是影响空置率变化的重要因素之一。
例如,政府对房地产市场的调控政策可能会导致供应量减少或需求量增加,从而影响空置率的变化。
3.长期变化趋势从长期来看,空置率的变化趋势与城市化进程、经济发展和人口流动等因素密切相关。
随着城市化进程的加速和人口流入城市的速度加快,住房需求不断增加,导致空置率下降。
相反,当经济发展放缓或人口流出城市时,住房需求减少,空置率会相应上升。
三、影响空置率的因素及应对措施1.供求关系供求关系是影响空置率的最基本因素。
在供应量大于需求量时,开发商可以通过降低价格、提高房屋品质等方式吸引租客;在需求量大于供应量时,则需要通过增加供应来降低空置率。
2.政策调控政府对房地产市场的调控政策也会对空置率产生影响。
例如,政府可以通过土地供应、税收政策等方式来调节市场供求关系,从而影响空置率的变化。
开发商和投资者需要根据政策变化及时调整策略,以降低空置率。
房地产市场的空置率分析

房地产市场的空置率分析在过去几年中,房地产市场一直是全球经济中的重要组成部分。
然而,随着城市化进程的加快和人口的增长,房地产市场正在面临一个关键问题,即空置率的增加。
本文将对房地产市场的空置率进行分析,以了解其原因和影响。
1. 空置率定义和计算方法空置率是指在特定时间段内未被租赁或出售的房产占总供应量的百分比。
其计算公式如下:空置率 = 未被租赁或出售的房产数量 / 总供应量 × 100%2. 空置率的原因(1)经济因素:当经济不景气时,企业倒闭、失业率上升,购房需求减少,导致房产空置率的增加。
(2)政策因素:政府的政策干预也可能影响房地产市场的供需关系。
例如,出台限购政策会削弱购房需求,从而导致空置率上升。
(3)房产投资需求变化:投资者对房产的投资需求也会影响空置率。
如果投资者预期收益较低,他们可能会选择暂时不出租或出售房产,从而导致空置率上升。
(4)地理位置和房价:地理位置和房价也是决定空置率的重要因素。
一些偏远地区的房产可能难以吸引租客或买家,从而导致空置率较高。
3. 空置率的影响(1)经济影响:房地产市场空置率的上升可能导致房地产业的下滑,进而影响相关产业链,对国家经济造成不利影响。
(2)社会影响:高空置率可能导致社会失衡。
例如,大量空置房屋可能导致城市资源的浪费和城市景观的破败,对城市形象和居民生活质量都会产生负面影响。
(3)财产保值问题:房地产的空置也会使得房屋财产价值下降。
空置房屋的维护费用和价值保值变得困难,导致投资者财产的贬值。
4. 应对房地产市场空置率的措施(1)改善市场供需关系:政府可以通过调整税收政策、出台促销政策和提供补贴等措施,刺激购房需求,减缓房地产市场的空置率增长趋势。
(2)房地产管理:市政府可以尽量避免大规模建设类似设施,而鼓励利用现有建筑改造或重建。
此外,加强对闲置房产的监督和管理,鼓励出租或出售空置房屋,以减少空置率。
(3)政府与房产开发商合作:政府可以与房产开发商合作,优化规划和土地利用,确保房地产项目的市场需求与供应之间的平衡。
中国房地产市场的空置率问题

中国房地产市场的空置率问题随着城市化进程的加快和经济发展的不断壮大,中国的房地产市场逐渐成为全球瞩目的焦点。
然而,伴随着繁荣的房地产市场,中国也面临着一个严峻的问题,那就是空置率的不断攀升。
本文将深入探讨中国房地产市场的空置率问题,并分析其原因与影响。
一、空置率的定义与测算首先,我们需要明确空置率的定义。
空置率是指房屋处于不被使用的状态下所占总房屋数量的比例。
一般来说,空置率的测算需要综合考虑房屋供求关系、人口流动、城市化进程等方面因素。
根据不同的指标和调查方法,空置率的计算方式也存在一定的差异。
二、中国房地产市场空置率问题的现状目前,中国房地产市场的空置率呈现出不容忽视的上升趋势。
根据统计数据显示,北京、上海等一线城市的空置率超过了10%,而一些三四线城市的空置率甚至更高。
这些空置的房屋大多集中在高档住宅、商业用房以及部分二手房市场。
同时,一些城市的新房开发速度过快,而供应与需求的不匹配也导致了空置率的上升。
三、中国房地产市场空置率问题的原因引发中国房地产市场空置率上升的原因是多方面的。
首先,一些房产投资者将房屋作为投资工具,而非自住或租赁用途,造成了大量房屋处于空置状态。
其次,土地供应不足、用地政策不合理等因素导致开发商在一些城市大规模建造房屋,但由于地理位置、交通等不理想,导致房屋无法顺利出售或出租,最终增加了空置率。
另外,城市间人口流动的不平衡也造成了部分房屋空置的问题。
四、中国房地产市场空置率问题的影响房地产市场的空置率问题不仅影响着市场的稳定与可持续发展,也给社会经济带来了一系列的负面影响。
首先,大量的空置房屋导致了资源的浪费,增加了城市建设和维护的成本。
其次,部分城市的空置房屋已经成为了犯罪活动的温床,给社会治安带来了一定的威胁。
此外,空置房屋对于居民购房需求的满足度下降,加大了部分市民的居住压力。
五、解决中国房地产市场空置率问题的对策为有效解决中国房地产市场的空置率问题,需要采取一系列务实可行的对策。
全国商品住宅空置率研究
全国商品住宅空置率研究房地产业作为我国经济的支柱产业,对拉动国内消费需求和提高国民经济增长速度具有重要作用。
从1999年开始,我国房地产业,特别是商品住宅产业,摆脱了前几年的低迷状态,尤其在国家推出住房制度改革、经济适用房建设和加快住宅产业产业化三大举措后,呈现了明显的发展势头。
然而在房地产业繁荣的背后,商品房空置面积也在加速上升。
众所周知,过高的商品房空置率不但会造成社会资源浪费,而且还会增加产生经济危机、金融危机的风险。
所以必须分析研究导致商品住宅高空置率现状的原因,并采取有效对策,控制商品住宅增量、消化存量,降低商品住宅空置率。
一、商品住宅空置现状及成因1.商品住宅空置现状我国目前城市土地和住房利用的现状是:一方面由于人口众多,用地和住房十分紧张;另一方面土地资源的浪费和住房的闲置又十分严重。
由于我国国民经济的持续发展、城市化水平不断提高、居民住宅不断得到改善,以及城市建设步伐加快等四大支柱支撑房地产的发展,在今后很长一段时间内,我国房地产市场应该不会发生长期饱和。
目前,全国城镇住房市场潜力巨大,虽然政府采取了多项措施拉动内需,如:发放住房补贴、降息、减免税费等,但总的来说收效不大,空置率仍旧逐年上升,房价仍然偏高,高空置率并没有制约高房价。
我国房地产市场是一个市场机制不健全,处于从不成熟向成熟方向过渡的市场。
近年来,房地产开发行业的暴利导致价格脱离市场基础持续上涨,逐年攀高供给的同时,抑制了人们的消费,空置率逐年升高,而空置率并没有反过来影响房价,高空置率和高房价并存。
2.高空置的原因造成目前商品住宅高空置的原因是多方面的,除了前几年因投资开发过热带来的后果,主要原因还有:2.1房地产投机活动膨胀房地产作为一个先导性产业,一定程度的超经济发展是很正常的,但目前我国房地产却出现了过热的势头,其主要原因就是投机活动的介入。
房地产本身的特点导致了房地产投机行为的产生。
土地作为一种自然资源是不可再生的,随着经济的发展和人口的增长,可供开发的土地资源越来越少。
商品住宅市场空置率计算模型分析与实证研究的开题报告

商品住宅市场空置率计算模型分析与实证研究的开题报告一、研究背景和意义城市化进程的加快和人口流动性的增强,不仅推动了中国商品住宅市场的快速发展,也带来了高空置率问题。
在住房政策持续加码的情况下,住房市场传统的供需关系已经逐渐发生变化,之前市场紧缺的城市逐渐消失,供大于求的局面已经逐渐形成。
随着城市化和经济转型的加速,住房市场面临的风险和挑战越来越多。
因此,如何准确预测商品住宅市场的空置率,成为了中国房地产市场近年来的一个热门话题。
本研究旨在通过分析现有的空置率计算模型,运用统计分析方法和机器学习算法,构建准确的商品住宅市场空置率计算模型,并通过实证研究验证其可行性和可靠性。
通过准确预测商品住宅市场空置率,既可以有效降低房地产市场的风险,也可以指导政府和企业制定更合理的住房政策和房地产市场策略。
二、研究内容和方法本研究将从以下三个方面展开:1.分析现有的空置率计算模型,包括回归分析、时间序列分析和机器学习算法等。
通过分析其优缺点,提出更加有效和准确的空置率计算模型。
2.构建商品住宅市场空置率计算模型。
本研究将运用统计分析方法和机器学习算法,从多个角度对商品住宅市场的空置率进行分析,结合宏观经济数据、购房者的消费行为、政策法规等相关因素,构建准确的计算模型。
3.实证研究。
通过数据采集、数据处理和数据分析,验证构建的商品住宅市场空置率计算模型的可行性和可靠性。
根据实证结果,提出一些政策性建议,包括改进住房政策和房地产市场策略等。
三、预期成果和意义本研究旨在构建基于统计分析和机器学习算法的商品住宅市场空置率计算模型,预期成果包括:1.提出更加准确和有效的空置率计算模型,可以更好地指导政府和企业制定住房政策和房地产市场策略。
2.通过实证研究,为中国商品住宅市场空置率的准确预测提供科学依据,为提高房地产市场的稳定性和保障购房者的权益提供支持。
3.本研究不仅具有科学研究价值,同时也具有实际应用价值,可以为政府和企业在实践中提供借鉴和启示。
农村空置房调查报告
农村空置房调查报告农村空置房是指农村地区中已经建成的房屋空闲、闲置的现象。
近年来随着城镇化的加速,城市人口日益增长,城市房价高涨,逐渐引发了越来越多的人关注到农村空置房。
本文将通过农村空置房调查报告,探究农村空置房的现状、原因和对策。
一、农村空置房现状据调查数据显示,全国农村空置房面积已超过3亿平方米,占到全国总空置房面积的60%,数量巨大。
根据统计,空闲房屋中有三分之一的房屋已经空置超过3年以上,有20%的房屋已经空置超过5年以上。
就地区而言,农村空置房主要集中在东北、西北、西南和华北地区,其中东北地区空置率最高,达到了33.7%。
同时,城市近郊以及县城周围的农村地区,空置房较多,超过了50%。
二、农村空置房原因1.人口外流随着城市化的进程,越来越多的人涌入城市,留在农村的人口不断减少,导致农村空置房数量激增。
特别是一些偏远的山区、荒凉的地区,人口更加集中流失,导致空置房数量异常突出。
2.传统习惯影响很多老年人将他们的房子视为后代所遗留下的家产,不愿意买卖或租赁出去,导致房屋一直空置。
许多房屋还未有正式的房屋所有权证,致使农民们会发现将空屋租赁或出售都需要一定的手续,加之农民缺乏房地产知识,影响了他们将房子作为货币的渠道。
3.政策限制目前我国对于农村土地使用规划和政策限制较多,使得农民不得不将房子建在自己名下的土地上,难以落实二手房交易和租赁。
可能添加的行政手续会导致一些业主不愿意办理,或者寻求一个解决方案太麻烦,而选择放弃出租或出售房屋。
4.房屋质量受限由于一些的房屋修建技术陈旧和地形状况不同,导致房屋质量较为堪忧。
房屋质量差,就会影响住房的使用价值,使空置情况长期得到维持,还有一定的安全隐患。
三、农村空置房的对策1.加强政策引导应从政策上发挥作用引导农民将自有空置房租售给有需求的人。
尤其对于用于居住的农村存量房,可以对空置一定年限后,强制执行,勉强拆除或改建,来逐步减少农村空置房的数量和激化问题。
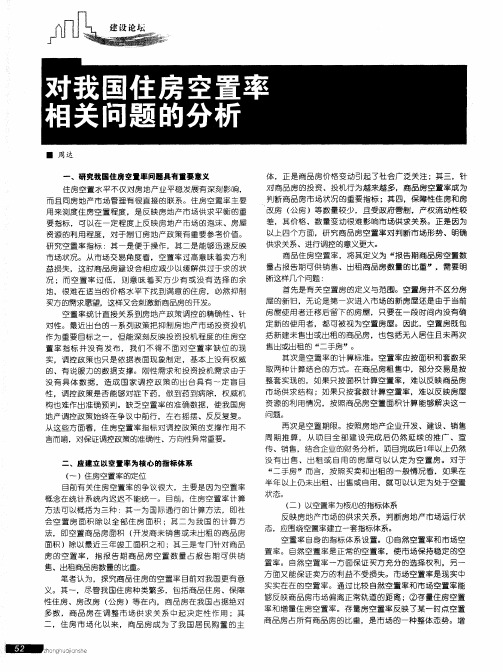
对我国住房空置率相关问题的分析
筹
● 周 达
一
、
研究我国住房空置率问题具有重要 意义
住房 空置水 平不仅对 房地产 业平稳 发展有 深刻影 响, 而且 同房地 产市场 管理有很 直接 的联 系。住房空 置率主 要 用来测 度住房 空置程 度,是 反映房 地产市 场供求 平衡 的重
体 ,正是 商品 房价格 变动 引起 了社 会广泛 关注 ;其三 ,针 对 商品房 的投 资、投机 行为越 来越 多,商 品房 空置 率成 为 判 断商品 房市场 状况 的重要指 标 ;其 四 ,保 障性住 房和 房
定 新 的使 用者 ,都 可被视 为空置房 屋。 因此 ,空置房 既包 括 新建未 售出或 出租 的商品房 ,也 包括无 人居住且 未再 次
售出或 出租 的 “ 二手房”。
置 率 指标 并 没有 发 布 ,我 们 不 得不 面 对 空置 率 缺位 的现 实 ,调控政策 也只是 依据 表面现 象制定 ,基本 上没有权 威
面积 )除 以最 近三年 竣工 面积 之和 ;其三 是专 门针对商 品 房 的空 置 率 ,指 报 告期 商 品房 空 置 数 量 占报 告期 可供 销 售、出租 商品房数量 的比重。 笔者认 为,探究 商品住 房的空 置率 目前对我 国更有 意 义。其 ~,尽 管我国住 房种 类繁多 ,包括商 品住房 、保 障
房 屋使用 者迁 移后 留下的房屋 ,只要在 一段时 间内没有 确
买方 的需求愿望,这样又会刺激新商品房的开 发。 空 置率统 计直接 关系到房地 产政 策调控 的精确性 、针 对性 。最近 出台 的一系 列政策把 抑制房 地产市 场投资 投机
作 为重要 目标之 一,但 能深刻反 映投 资投机程 度的住 房空
资源 的利 用情况 ,按照 商品房 空置 面积 计算 能够解 决这 一
全国商品住宅空置率研究

全国商品住宅空置率研究住房问题一直是中国社会关注的热点之一,近年来,随着城市化进程的加速推进,商品住宅的供应量大幅度增加,而同时也伴随着商品住宅的空置现象的出现。
因此,研究商品住宅的空置率,对于了解住房市场的运行情况以及优化和提升住房政策具有重要意义。
商品住宅空置率的概念指的是其中一时间段内已经完成的商品住宅中,未被居民正常居住的住房比例。
通过研究商品住宅空置率,可以了解到包括投资持有者怀有投资动机,购房者投资需求多于自住需求,以及投资者预期变动等多个方面的信息。
首先,商品住宅空置率的研究可以为政府部门提供住房政策制定的依据。
在住房政策制定过程中,需要考虑到市场供需状况以及稳定市场预期,而了解商品住宅空置率的变化情况,则可以对政府提供重要的参考。
研究商品住宅空置率可以帮助政府更好地了解房地产市场运行情况,及时采取措施调控市场,推动市场稳定发展。
其次,研究商品住宅空置率对于投资者来说也具有重要意义。
投资者在购房时,需要对市场供需情况进行预判,以充分利用市场机会,并为自己的投资决策提供可靠的依据。
了解商品住宅空置率的变化情况,可以让投资者更好地判断市场的供需状况,选择合适的投资时机,以及减少投资风险。
再次,研究商品住宅空置率对于普通购房者来说也具有重要价值。
购房者在购房过程中,需要了解商品住宅市场的供应情况,以及建立合理的购房预期。
通过研究商品住宅空置率,可以让购房者更好地了解市场供应的充裕程度,提前做好购房决策。
研究商品住宅空置率的方法多种多样,常用的方法包括逐户调查法、房屋市场交易数据分析法以及房地产开发企业数据法等。
逐户调查法是通过对居民进行问卷调查,了解住房状况,从而推算出商品住宅的空置率。
房屋市场交易数据分析法是通过分析市场上的住房交易数据,从中根据住房交易量和供应量的关系推算出商品住宅的空置率。
房地产开发企业数据法是通过收集房地产开发企业的数据,包括开发面积、销售面积等,从中推算出商品住宅的空置率。
珠海市住宅空置情况调查及空置率实证分析

空置率较高:珠海市住宅空置率较高,可能导致资源浪费和社会问题。
原因分析:空置率高的原因可能包括投资性购房、房屋质量问题、人口流动等。
效果评估:需要评估解决措施的效果,以确定哪些措施最有效,哪些需要改进。
解决措施和建议
加强政策引导,鼓励居民合理购房
提高房屋租赁市场的规范化程度,降低租赁成本
推进房地产税改革,增加房屋持有成本
汇报人:
珠海市住宅空置情况调查及空置率实证分析
目录
01
珠海市住宅空置情况概述
02
珠海市住宅空置情况调查方法
03
珠海市住宅空置率实证分析
04
珠海市住宅空置问题及解决措施
05
珠海市住宅空置情况的发展趋势
珠海市住宅空置情况概述
住宅空置的定义和分类
住宅空置的定义:指房屋处于无人居住、无人使用的状态,包括长期空置和短期空置。
数据处理:对收集到的数据进行清洗、整理和分析,确保数据的准确性和完整性
数据收集:通过实地调查、网络搜索等方式收集珠海市住宅空置率数据
实证分析结果
珠海市住宅空置率总体情况
空置率对房地产市场的影响
空置原因分析
各区域住宅空置率差异
珠海市住宅空置问题及解决措施
存在的问题
解决措施:政府可以采取一系列措施来解决空置问题,如征收空置税、鼓励租赁市场发展、加强房屋质量监管等。
调查范围和对象
调查区域:珠海市全市范围
调查时间:2020年1月至2020年12月
调查方式:实地考察、问卷调查、数据统计等
调查对象:住宅小区、公寓、别墅等各类住宅
调查方法和步骤
确定调查范围:选择珠海市作为调查区域
验证模型:对模型进行验证,确保其准确性和可靠性
- 1、下载文档前请自行甄别文档内容的完整性,平台不提供额外的编辑、内容补充、找答案等附加服务。
- 2、"仅部分预览"的文档,不可在线预览部分如存在完整性等问题,可反馈申请退款(可完整预览的文档不适用该条件!)。
- 3、如文档侵犯您的权益,请联系客服反馈,我们会尽快为您处理(人工客服工作时间:9:00-18:30)。
房屋空置率的分析研究西南交通大学宿美丽、黄文瀚、顾泰发目录摘要 (1)Abstract (2)一、相关知识解析 (3)二、研究房屋空置率的意义 (3)三、问题提出 (4)四、问题分析 (4)五、符号说明 (5)六、问题假设 (5)七、模型的建立与求解 (5)7.1 模型的准备 (5)7.1.1定性分析: (5)7.1.2 定量分析: (6)7.2 模型的建立 (16)7.3 模型检验 (17)八、参考文献 (17)九、附录 (18)摘要随着经济的发展,美国城市化水平不断上升,城市建筑不断在城市中屹立起来。
在美国,空置是指房屋没有投入使用,处在待出租或出售的状态。
空置率多以全部房屋存量为分母,以全部空置房屋为分子,计算出总空置率;国外有学者使用过空置率这一指标来描述房地产领域的资源配置状况,研究影响空置率的回归模型具有很大的现实意义。
所以我们决定建立空置率的线性回归模型。
本文我们先对各个因素进行定性分析;然后再利用相关软件对各因素进行了进一步的定量分析。
在定量分析中,我们利用spss 软件,用多元线性回归得到描述的有美国房屋空置率和美元指数, 房指数,CPI ,S&P500,美国GDP 的回归方程,建立了估计美国房屋空置率的模型。
首先,绘散点图分析从网上收集到的相关数据,将对房屋空置率影响不大的因素去除。
其次,结合散点图,用一元线性回归分析分别得到各个因素和房屋空置率的近似的关系,并从拟合优度及线性相关性是否显著两方面进行检验。
然后,我们建立了综合所有因素和房屋空置率的多元线性回归方程:12353.6773465882470.008206134855443*0.02814136185459*0.005905910596052*0.0001809350435868*y xxx x=++--;同时用该方程对04年到07年的空置率进行估计,参照网上查阅的对应实际空置率对回归效果进行检测。
最后,检验的结果为下表(单位:%): 单位:% 时间 估计价格 实际价格 偏差率2004 10.057331 10.2 0.01399 2005 10.913503 9.9 0.102374 2006 11.6397815 10.6 0.098093 200711.831133311.20.056351由表可知,回归方程对实际价空置率合总体效果还是好的,但由于收集数据有限,所以难免存在一定误差。
这说明:该模型具有一定的实际意义,但还有待于更进一步改进。
关键词: 散点图 一元线性回归 多元线性回归 拟合优度 线性相关性AbstractWith the economic development, the urbanization level of American cities is rising, urban structures have stood up in the city . In the United States, Housing vacancy is defined as that a house is not put into use for rent or sale in the state. To calculate the overall Housing V acancy rate, we use the stock of all houses as the molecular, and use the vacant houses as the denominator.Some foreign scholars value the vacancy rate as a indicator which is used to describe the allocation of resources in real estate conditions, the regression models of vacancy rate is of great practical significance. So we decided to create the the linear regression model of vacancy rate.This paper, we first do the qualitative analysis of the various factors; then use related software on various factors, what is related to further quantitative analysis.In quantitative analysis, we used SPSS to build the multiple linear regression, which is aimed to described the effect of the dollar index, house index, CPI, S & P500 and the U.S. GDP on the future Housing V acancy rate .At the first beginning, we draw scatters of the data collected from the Internet, then we eliminated the factors that has little effect on oil futures prices;Secondly, we, combining the plots, used linear regression analysis of various factors respectively and Housing V acancy rate to get the approximate relationship between Housing V acancy rate and each of the factors. To be more scientific, we also conduct Goodness-of-fit testing and the linear correlation inspectionLast but not least, we established a comprehensive multivariate linear regression equation involved all factors:12353.6773465882470.008206134855443*0.02814136185459*0.005905910596052*0.0001809350435868*y xxx x=++--.Naturally , the next thing we had done was to use the equation to estimate the Housing V acancy rate varied from 2004 to 2007. Then we referred to the corresponding Housing V acancy rate, which was published online, to test the effect of regression. Finally, the results of the inspection are in the next table (%):price fitting is good, but due to the limit of collecting enough data, it is not surprised to find there are some errors. To some degree, this model has practical significance, but on the other hand , it needs to be improved.Key W ords:The scatter plot chart, Linear regression, Multivariate linear regression, Goodness-of-fit testing, linear correlation inspection一、相关知识解析1.空置率:是指某一时刻空置房屋面积占房屋总面积的比率。
按照所依照的房地产市场类型的不同,空置率可以分为存量市场的空置率和增量市场的空置率。
2.房地产存量市场的空置率是指某一时刻空置房屋面积占全部房屋总面积的比率。
3.房地产增量市场的空置率是指某一时刻新建房屋的空置房屋面积占一段时期新建房屋总面积的比率。
4.房屋空置率:没有使用的房屋建筑面积除以所有房屋的建筑面积乘以100%得到的数字。
二、研究房屋空置率的意义毫无疑问,房屋空置率是反映房屋市场运行健康程度非常关键的一个指标,具体来说,可以概括为三大作用:1.引导房地产业健康发展和资金的合理投入。
房屋空置率可以帮助估测房屋市场的供求关系,也能够反映泡沫程度如何。
一些开发商或投机客通过大肆囤房,人为抬高房价,造成市场虚假的需求信号,误导消费者,也能够误导投机者,造成资金过度流入房地产业,整体经济结构也受到扭曲,单长期看供求关系终要恢复均衡,那时价格一旦逆转,房屋市场后果不堪设想甚至会危害到整体经济的安全。
为此,真实可靠、细分到区域的空置率数据,对房地产资金投入方向有风向标的作用,及时发布这方面的数据,可以避免房地产资金投入到不该有的领域和区域,防范造成房地产市场出现危局。
从这个角度来说,房屋空置率数据,是实现政府房地产精确调控的重要前提之一。
2.直接体现宝贵的房屋及相关资源有没有被有效利用。
房屋投资巨大,不合理闲置的房屋意味着巨额投资没有及时产生应有的经济效益,属于严重的低效率投资。
此外,空置的房屋还会加速折旧,造成双重损耗。
尤其房屋空置首先意味着土地闲置,而土地又是稀缺和不可再生的,特别在我国人多地少的国情下,这是应力图避免的浪费。
房屋空置还意味着,与房屋联系在一起的公共资源,从水电煤到公交教育消防警力等,也都没有达到规划的利用效率。
现在热衷“造城”者众,地方政府与开发商合作热情很高,但近期媒体爆出天津、鄂尔多斯等地有巨大的无人居住的空城、死城,浪费惊人,触目惊心。
3.从一个侧面反映社会财富分配的公平程度。
住宅资产已经成为我国居民家庭资产最主要的组成部分,尤其随着城市经济发展和房价快速上升,住宅资产增值速度加快,在居民总资产比重越来越大,且不均等程度迅速扩大, 导致财产分布差距扩已经大幅度超过了收入分布。