第3章财务报表分析s
StatementAnalysis(财务报表分析,加州大学MBA)
Disaggregate ATO
ATO = Sales/average total assets
Average total assets = (average account receivables + average inventory + average fixed assets + average other assets)
RNOA: Return on net operating assets Regression to the mean (回归到平均值)
Profit margin
Asset turnover
Revenue growth
Disaggregate PM
PM = (sales – COGS – SGA – depreciation ….)/Sales
ROCE: return to common
Shareholders only
Return on Assets (ROA)
ROA presents profitability independent of the source of financing – Does not consider leverage – Measure of how well the firm uses its assets to generate income – As if the firm is financed by equity alone
Then ROA = 71.2/585 = 12.2%
Why add back interest income net of income tax savings in the numerator?
财务报表分析与风险防范164页PPT
商业 战略分析 (shāngyè)
• 商业战略分析是财务报表分析的首要步骤,其主要目的就是,帮 助分析者提升对目标公司、竞争者及其所面临的经济环境状况的 理解,以及它们之间的相互关系,并保证具体的财务报表分析都 是以现实为基础(jīchǔ)的。也就是说,商业战略分析希望通过辩明 关键的利润动因和商业风险之间的关系,帮助分析者作出客观的 预测。
• 工会(labor unions) • 证券分析家(security analysts)
第十三页,共六十四页。
会计信息提供的基本假设(jiǎshè)和一般原则
• 会计主体假设 、持续经营假设 、会计分期假 设 、货币计量假设 。
• 客观性原则 、重要性原则 、有用性原则 、可 比性原则 、一贯性原则 、及时性原则 、清晰 性原则 、划分收益性支出与资本(zīběn)性支出原 则 、配比原则 、权责发生制原则 、历史成 本原则 、谨慎原则 、实质重于形式。(案例 2)
财务报表之间的关系(guān xì)
• 管理者最关注的是利润表; • 利润表是反映企业最终财务成果的财务报表;
• 资产负债表的资产方反映的是企业创造财务成果 的能力,而负债方反映的则是企业资产的来源结 构;
• 现金流量表:对利润(lìrùn)表而言,反映的是企业利 润(lìrùn)的质量;而对资产负债表而言,则是对其 货币资金项目的详细说明。(表1)
• 所有者权益收益率=(100-50)*(1-30%)/500=7%
•
=(100-20)*(1-30%)/800=7%
• 若其他条件不变,该企业的息税前利润上升为150万元(或下降为 50万元),自有资金的比例为50%,则:
• 总资产收益率=(150-50)*(1-30%)/1000=7%
财务报表分析 英文

Others
Treasury M&A Risk
•Strategy
•Budget •Forecast
Management
Insurance Auditing
Compliance
Hedging ….
11
11
Introduction and Basic Concepts
导言及基本概念 Introduction and Basic Concepts
•
14
Results are reported by location, by region, by business, by sector and then total company.
14
Operating Results – Income Statement
Actual Sales Standard Profit % of Sales Manufacturing Profit % of Sales Distribution Admin Selling R&D Total Support Costs % of Sales Other Inc/Exp Admin / Cap Charge Operating Profit ROS %
topics
9
9
Introduction and Basic Concepts
Accounting
Booking
(AP, AR, GL, FA)
Taxation
Statutory Group
Reporting
Reporting
Controlling
Costing
Reporting
Internal Policy
罗斯《公司理财》笔记整理

罗斯《公司理财》笔记整理第一章导论1. 公司目标:为所有者创造价值,公司价值在于其产生现金流能力。
2. 财务管理的目标:最大化现有股票的每股现值。
3. 公司理财可以看做对一下几个问题进行研究:1. 资本预算:公司应该投资什么样的长期资产。
2. 资本结构:公司如何筹集所需要的资金。
3. 净运营资本管理:如何管理短期经营活动产生的现金流。
4. 公司制度的优点:有限责任,易于转让所有权,永续经营。
缺点:公司税对股东的双重课税。
第二章会计报表与现金流量资产= 负债+ 所有者权益(非现金项目有折旧、递延税款)EBIT(经营性净利润)= 净销售额- 产品成本- 折旧EBITDA = EBIT + 折旧及摊销现金流量总额CF(A) = 经营性现金流量- 资本性支出- 净运营资本增加额= CF(B) + CF(S) 经营性现金流量OCF = 息税前利润+ 折旧- 税资本性输出= 固定资产增加额+ 折旧净运营资本= 流动资产- 流动负债第三章财务报表分析与财务模型1. 短期偿债能力指标(流动性指标)流动比率= 流动资产/流动负债(一般情况大于一)速动比率= (流动资产- 存货)/流动负债(酸性实验比率)现金比率= 现金/流动负债流动性比率是短期债权人关心的,越高越好;但对公司而言,高流动性比率意味着流动性好,或者现金等短期资产运用效率低下。
对于一家拥有强大借款能力的公司,看似较低的流动性比率可能并非坏的信号2. 长期偿债能力指标(财务杠杆指标)负债比率= (总资产- 总权益)/总资产or (长期负债+ 流动负债)/总资产权益乘数= 总资产/总权益= 1 + 负债权益比利息倍数= EBIT/利息现金对利息的保障倍数(Cash coverage radio) = EBITDA/利息3. 资产管理或资金周转指标存货周转率= 产品销售成本/存货存货周转天数= 365天/存货周转率应收账款周转率= (赊)销售额/应收账款总资产周转率= 销售额/总资产= 1/资本密集度4. 盈利性指标销售利润率= 净利润/销售额资产收益率ROA = 净利润/总资产权益收益率ROE = 净利润/总权益5. 市场价值度量指标市盈率= 每股价格/每股收益EPS 其中EPS = 净利润/发行股票数市值面值比= 每股市场价值/每股账面价值企业价值EV = 公司市值+ 有息负债市值- 现金EV乘数= EV/EBITDA6. 杜邦恒等式ROE = 销售利润率(经营效率)x总资产周转率(资产运用效率)x权益乘数(财杠)ROA = 销售利润率x总资产周转率7. 销售百分比法假设项目随销售额变动而成比例变动,目的在于提出一个生成预测财务报表的快速实用方法。
智慧树答案财务报表分析(全英文)知到课后答案章节测试2022年
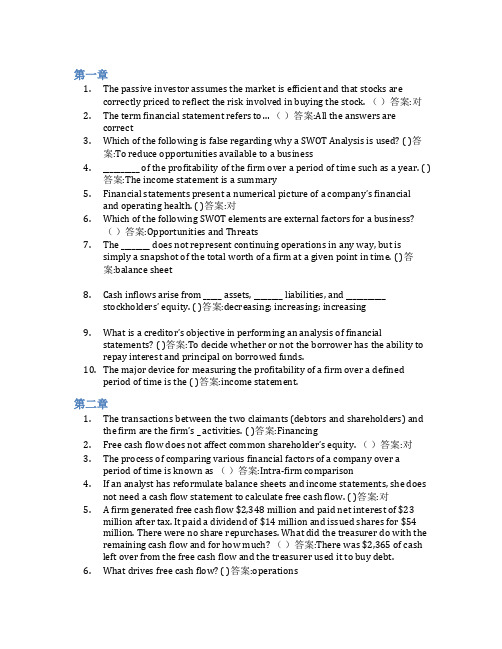
第一章1.The passive investor assumes the market is efficient and that stocks arecorrectly priced to reflect the risk involved in buying the stock. ()答案:对2.The term financial statement refers to… ()答案:All the answers arecorrect3.Which of the following is false regarding why a SWOT Analysis is used? ( )答案:To reduce opportunities available to a business4.__________ of the profitability of the firm over a period of time such as a year. ( )答案:The income statement is a summary5.Financial statements present a numerical picture of a company’s financialand operating health. ( )答案:对6.Which of the following SWOT elements are external factors for a business?()答案:Opportunities and Threats7.The ________ does not represent continuing operations in any way, but issimply a snapshot of the total worth of a firm at a given point in time. ( )答案:balance sheet8.Cash inflows arise from _____ assets, ________ liabilities, and ___________stockholders’ equity. ( )答案:decreasing; increasing; increasing9.What is a creditor’s objective in performing an analysis of financialstatements? ( )答案:To decide whether or not the borrower has the ability to repay interest and principal on borrowed funds.10.The major device for measuring the profitability of a firm over a definedperiod of time is the ( )答案:income statement.第二章1.The transactions between the two claimants (debtors and shareholders) andthe firm are the firm’s _ activities. ( )答案:Financing2.Free cash flow does not affect common shareholder’s equity. ()答案:对3.The process of comparing various financial factors of a company over aperiod of time is known as ()答案:Intra‐firm comparison4.If an analyst has reformulate balance sheets and income statements, she doesnot need a cash flow statement to calculate free cash flow. ( )答案:对5. A firm generated free cash flow $2,348 million and paid net interest of $23million after tax. It paid a dividend of $14 million and issued shares for $54million. There were no share repurchases. What did the treasurer do with the remaining cash flow and for how much? ()答案:There was $2,365 of cashleft over from the free cash flow and the treasurer used it to buy debt.6.What drives free cash flow? ( )答案:operations7.Reformulated balance sheets inform analysts about the firm’s strategy forrunning the business. ( )答案:对8.Which of the following activities is NOT an investing activity? ()答案:borrowing money9.An operating asset is ( )答案:used to produce goods or services to sell tocustomers in operations.parison of financial statements highlights the trend of the _________ of thebusiness. ( )答案:All the answers are correct第三章1.Low profit margins always imply low return on net operating assets. ()答案:错2.Which the following measure drive return on common equity (ROCE)positively? ()答案:Gross margin3.Under what condition would a firm’s return on common equity (ROCE) beequal to its return on net operating assets (RNOA)? ()答案:The SPREAD is zero, that is, return on net operating assets (RNO4. A reduction in the advertising expense ratio increase return on commonequity? ( )答案:对5. A firm should always purchase inventory and supplies on credit rather thanpaying cash. ()答案:错6. A firm has a return of 11.2 percent on net operating assets of $400 million, ashort term borrowing rate of 4.0 percent after tax and a return on operating assets of 8.5 percent. What is the firm’s operating liability leverage? ()答案:0.600 borrowing cost drive return on common equity (ROCE) negatively. ( )答案:对8.Which of the following would explain an observed decrease in return onequity, all else equal? ()答案:Increase in interest rate on debt9.The following information is from reformulated financial statements (inmillion) what is the firm’s ROCE and RNOA? ( )答案:15.0% and 13.0%10.Under what condition would a firm’s return on net operating assets (RNOA)be equal to its return on operating assets (ROOA)? ( )答案:The operatingliability leverage spread (OLSPREAD) is zero, that is, ROOA equals theimplicit borrowing rate for operating liabilities.第四章1.What measures tells you that a firm is a no-growth firm? ( )答案:A firm haszero or negative residual earnings growth2.Which the following item is part of unusual (transitory) income? ( )答案:Gainon the disposal of property3.Firms can grow earnings, but not create (share) value ()答案:对4.The following number were calculated from the financial statements for afirm for 2012 and 2011:How much of the change in ROCE from 2011 to 2012 is due to financing activities? ()答案:3.37%5.Transitory earnings are current earnings that are likely to be maintained inthe future. ( )答案:错6.Which of the following could cause return on net operating assets to increase,all other things equal? ()答案:Increase in inventory turnover7.Below is selected information from TricorpReturn on net operating assets forYear 1 is: ( )答案:15.4%.8.RE represents extra profit available to the company/shareholders this iswhat drives growth in a company’s (share) value. ()答案:对9.Return on operating assets is a measure of which of the following? ()答案:Efficiency10.Below is selected information from Tricorp company Which of the followingis correct concerning changes at Tricrop from Year 1 to Year 2? ( )答案:RNOA Decreased, ROCE Decreased第五章1. A firm can create future income by temporarily increasing its bad debtallowance. ()答案:对2.Which of the following item are managed to increase gross revenue? ()答案:Increase receivables3.Increasing profit margins by underestimating expenses creates net operatingassets. ( )答案:对4.Why do analysts compare cash flow from operations with earnings to assessthe quality of the earnings? ()答案:The difference between earnings andcash flow from operations is explained by the accruals, and the accruals aret he “soft” part of earnings that can be manipulated.5. A decrease in warranty liabilities increases net sales. ( )答案:错6.IBM reported a 3 percent increase in income for its first quarter of 2000,beating analysts’ estimates. But it also reported a decline in revenue. Its stock price dropped in response to the report. Which of the following statement isincorrect for the drop in stock price on an earnings increase? ()答案:Theasset turnover is expected to increase.7.Low depreciation charges forecast losses in future income statements. ( )答案:对8.Which of the following is least likely to be associated with low-qualityearnings? ()答案:Decrease in borrowings.9.Accounting quality analysis is not part of the wider analysis of sustainableearnings. ()答案:错10.Which of the following is not an indicator of accounting Manipulation? ()答案:Loss on sale of discontinued business segments第六章1.If the intrinsic value of a stock is greater than its market value, which of thefollowing is a reasonable conclusion? ( )答案:The market is undervaluing thestock.2.The _______ is defined as the present value of all cash proceeds to the investorin the stock. ( )答案:intrinsic value3.FCF and DDM valuations should be ____________ if the assumptions used areconsistent. ( )答案:similar for all firms4.Because the DDM requires multiple estimates, investors should ( )答案:carefully examine inputs to the model and perform sensitivity analysis onprice estimates.5. A preferred stock will pay a dividend of $2.75 in the upcoming year, andevery year thereafter, i.e., dividends are not expected to grow. You require areturn of 10% on this stock. Use the constant growth DDM to calculate theintrinsic value of this preferred stock. ( )答案:$27.506.At the end of 2012, you forecast that a firm’s free cash flow for 2013 will be$430 million. If you forecast that free cash flow will grow at 5% per yearthereafter, what is the enterprise value? Use a required return of 10 percent.( )答案:8,600millionpany X has negative free cash flow but strong earnings that yield areturn on equity of 27 percent. Which of the following statements is morelikely to be true? ( )答案:the company is investing heavily8.At the end of 2012, you forecast the following cash flows (in millions) for afirm with net debt of $759 million: You forecast that free cash flow will growat a rate of 4% per year after 2015. Use a required return of 10% to calculateboth the fir ms’ enterprise value and the value of the equity at the end of 2012?( )答案:7,900million, 7,141 million9.Value is based on expected dividends, but forecasting dividends is notrelevant to value as a practical matter. ()答案:对10. A firm that has higher free cash flow have a higher value? ()答案:错第七章1.The following are earnings and dividend forecasts made at the end of 2012for a firm with $20.00 book value per common share at that time. The firmhas a required equity return of 10% per year. Forecast return of commonequity and residual earnings for the year of 2015. ()答案:ROCE is 15.71%and RE is 1.492. A firm cannot maintain a ROCE less than required return and stay in businessindefinitely. ()答案:错rmation indicates that a firm will earn a return on common equity aboveits cost of equity capital in all years in all years in the future, but its sharetrade below book value. Those share must be mispriced. ()答案:对4.The following are ROCE forecasts made for a firm at the end of 2010. ROCE isexpected to continue at the same level after 2013. The firm reported bookvalue of common equity of $3.2 billion at the end of 2010, with 500 millionshared outstanding. If the required equity return is 12%, what is the pershare value of these shares? ()答案:$6.405.Residual earnings valuation does not work well for companies like Coca-cola,Cisco System, or Nike, which have substantial assets, like brands, R&D assets, and entrepreneurial know-how off the books. A low book value must giveyou a low valuation. ( )答案:错6. A firm with book value of $15.60 per share and 100 percent dividend payoutis expected to have a return on common equity of 15% per year indefinitelyin the future. Its cost of equity capital is 10%. Calculate the intrinsic price tobook ratio. ()答案:1.57.Which of the following items are the drivers of Residual earnings? ( )答案:Return on common equity and growth in book value8.In September 2008 the shares of Dell, Inc, the computer maker, traded at $20.50 each. In its last annual report, Dell had reported book value of $3, 735million with 2, 060 million shares outstanding. Analysts were forecastingearnings per share of $1.47 for fiscal year 2009 and $1.77 for 2010 Dell paysno dividends. Calculate the per-share value of Dell in 2008 based on theanalysts’ forecasts, with an additional forecast that residual earnings willgrow at the anticipated GDP growth rate of 4 percent per year after 2010.Use a required return of 10 percent. the BPS at the end of fiscal-year 2008will be ( )答案:$1.8139.Calculate the per-share value of Dell in 2008 based on the analysts’ forecasts,with an additional forecast that residual earnings will grow at the anticipated GDP growth rate of 4 percent per year after 2010. Use a required return of 10 percent. ( )答案:24.84第八章1.Abnormal earnings growth is always equal to growth of (change in) residualearnings. ()答案:对2. A firm’s earnings are expected to grow at a rate equal to the required rate ofreturn for its equity,12%.what is the trailing P/E ratio? ()答案:9.333.what is the forward P/E ratio?( )答案:8.334. A P/E ratio for a bond is always less than that for a stock. ()答案:错5.which of the following statement is correct? ()答案:the normal forwardP/E and the normal trailing P/E always differ by 1.06.The following are earnings and dividend forecasts made at the end of 2010.The firm has a required equity return of 10% per year. Forecast abnormalearnings growth for 2012. ( )答案:0.3257.Forecast abnormal earnings growth for 2013. ( )答案:0.1658.Calculate the normal forward P/E for this firm. ( )答案:109.Firm can increase its earnings growth but not affect the value of its equity ()答案:对10.In early fiscal year 2009, analysts were forecasting $3.90 for Nike’s earningsper share for the fiscal year ending May 2009 and $4.45 for 2010, with adividend per share of 92 cents (0.92) expected for 2009. Forecast the cum-dividend earnings growth rate for 2010. ()答案:16.46%第九章1.Which of the following situation diversification dose not reduce risk?( )答案:returns on securities in the portfolio are perfectly correlated2. A statistical measure of the variability of a distribution around its mean isreferred to as __________. ( )答案:the standard deviation3.Normal distribution of returns can characterize the risk of investing in abusiness? ()答案:错4. A set of possible values that a random variable can assume and theirassociated probabilities of occurrence are referred to as __________. ()答案:probability distribution5.Below are the reformulate balance sheet for two firms with similar revenues.Amounts are in millions of dollars. Which firm look more risky forshareholders? Note that cash has been treated as operating cash. ( )答案:Firm Bing the CAPM, ß is a measure of: ( )答案:share price volatility7.Which of the following is not a measure of risk? ( )答案:correlationcoefficient8.Below are the reformulate income statement for two firms in the same line ofbusiness. Amounts are in millions of dollars. Which firm look more risky forshareholders? Reformulate the income statements: ( )答案:Firm A9.which of the following statement is not correct? ( )答案:variation in return onnet operating assets is only driven by profit margins10.Financing risk is driven by_____ ( )答案:All the answers are correct.第十章1.___________ is the extra required return that a lender demands to compensatefor the risk that the borrower will default. ( )答案:Default premium2.Which of the following statement is not the objective in reformulatingfinancial statement for credit analysis?( )答案:groups assets and liabilitiesin such a way as to evaluate the firm’s underlying profitability.3.______ is the error of forecasting that a firm will not default when in fact itdoes. ( )答案:A Type I error4.which of the following is the Off-balance sheet financing? ( )答案:All theanswers are correct5.which of the following statement is not correct? ( )答案:Pro forma analysisforecasts is not useful for credit analysis.6.The following numbers are extracted from the financial statements for a firmfor 2011 and 2012. Amounts are in millions of dollars. At the end of 2011, the firm’s 80 million shares traded at $25 each, but by the end of 2012 theytraded at $15.Calculate Z-score for 2011 ( )答案:2.687.Calculate Z-score for 2011 ( )答案:1.098.After analyzing the default risk for a five-year bond with a maturity value of$1,000 and an 8percent annual coupon, an analyst estimates the requiredreturn for the bond at 7percent per year. The bond has just been issued at aprice of $1,000. What is the value of the bond at a 7 percent required return?( )答案:1040.989.What is the yield-to-maturity with a market price of $1,000? ( )答案:8%10.What is the expected return of buying the bond at a price of $1,000? ( )答案:8%。
罗斯公司理财读书笔记

罗斯公司理财读书笔记【篇一:《公司理财》罗斯笔记(已矫正)】第一篇综述企业经营活动中三类不同的重要问题:1、资本预算问题(长期投资项目)2、融资:如何筹集资金?3、短期融资和净营运资本管理第一章公司理财导论1.1什么是公司理财?1.1.1资产负债表流动资产?固定资产?有形?无形??流动负债?长期负债+所有者权益流动资产-流动负债?净营运资本短期负债:那些必须在一年之内必须偿还的代款和债务;长期负债:不必再一年之内偿还的贷款和债务。
资本结构:公司短期债务、长期债务和股东权益的比例。
1.1.2资本结构债权人和股东v(公司的价值)=b(负债的价值)+s(所有者权益的价值)如何确定资本结构将影响公司的价值。
1.1.3财务经理财务经理的大部分工作在于通过资本预算、融资和资产流动性管理为公司创造价值。
两个问题:1. 现金流量的确认:财务分析的大量工作就是从会计报表中获得现金流量的信息(注意会计角度与财务角度的区别)2. 现金流量的时点3. 现金流量的风险1.2公司证券对公司价值的或有索取权负债的基本特征是借债的公司承诺在某一确定的时间支付给债权人一笔固定的金额。
债券和股票时伴随或依附于公司总价值的收益索取权。
1.3公司制企业1.3.1个体业主制1.3.2合伙制1.3.3公司制有限责任、产权易于转让和永续经营是其主要优点。
1.4公司制企业的目标公司制企业力图通过采取行动提高现有公司股票的价值以使股东财富最大化。
1.4.1代理成本和系列契约理论的观点代理成本:股东的监督成本和实施控制的成本1.4.2管理者的目标管理者的目标可能不同于股东的目标。
donaldson提出的管理者的两大动机:①②(组织的)生存;独立性和自我满足。
1.4.3所有权和控制权的分离——谁在经营企业?1.4.4股东应控制管理者行为吗?促使股东可以控制管理者的因素:①②③④股东通过股东大会选举董事;报酬计划和业绩激励计划;被接管的危险;经理市场的激烈竞争。
财务报表分析(英文版)
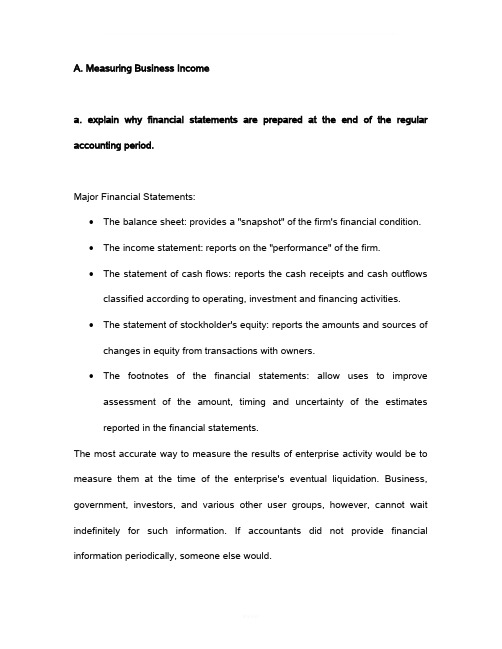
A. Measuring Business Incomea. explain why financial statements are prepared at the end of the regular accounting period.Major Financial Statements:∙The balance sheet: provides a "snapshot" of the firm's financial condition.∙The income statement: reports on the "performance" of the firm.∙The statement of cash flows: reports the cash receipts and cash outflows classified according to operating, investment and financing activities.∙The statement of stockholder's equity: reports the amounts and sources of changes in equity from transactions with owners.∙The footnotes of the financial statements: allow uses to improve assessment of the amount, timing and uncertainty of the estimates reported in the financial statements.The most accurate way to measure the results of enterprise activity would be to measure them at the time of the enterprise's eventual liquidation. Business, government, investors, and various other user groups, however, cannot wait indefinitely for such information. If accountants did not provide financial information periodically, someone else would.The periodicity or time period assumption simply implies that the economic activities of an enterprise can be divided into artificial time periods. These time periods vary, but the most common are monthly, quarterly, and yearly.The information must be reliable and relevant. This requires that information must be consistent and comparable over time and also be provided on a timely basis. The shorter the time period, the more difficult it becomes to determine the proper net income for the period. A month's results are usually less reliable than a quarter's results, and a quarter's results are likely to be less reliable than a year's results. Investors desire and demand that information be quickly processed and disseminated; yet the quicker the information is released, the more it is subject to error. This phenomenon provides an interesting example of the trade-off between relevance and reliability in preparing financial data.In practice, financial reporting is done at the end of the accounting period.Accounting periods can be any length in time. Firms typically use the year as the primary accounting period. The 12-month accounting period is referred to as the fiscal year. Firms also report for periods less than a year(e.g. quarterly) on an interim basis.∙Accounting period must be of equal length. Financial statements are prepared at the end of the regular accounting period to allow comparison across time.User CommentsPosted by Jeanette @ 2003-10-25 14:15:45.same period --- allow comparisionbasic assumption in preparing financial statements is ---- the firm will continue in operation,--- going concern,'assigning revenue - expenses ---- base on matching principlePosted by GiGi @ 2004-01-29 06:25:01.remember that there are 4 types of financial statementsb. explain why the accounts must be adjusted at the end of each period.Why?∙Most external transactions are recorded when they occur. The employment of an accrual system means that numerous adjustments are necessary before financial statements are prepared because certain accounts are not accurately stated.∙Some external transactions might not even seem like transactions and are recognized only at the end of the accounting period. Examples include unrecorded revenues and credit purchase.∙Some economic activities do not occur as the result of external transactions. Examples include depreciation and the expiration of prepaid expenses.∙Timing: Often a transaction affects the revenue or expenses of two or more accounting periods. The related cash inflow or outflow does not always coincide with the period in which these revenue or expense items are recorded. Thus, the need for adjusting entries results from timing differences between the receipt or disbursement of cash and the recording of revenue or expenses. For example, if we handle transactions on a cash basis, only cash transactions during the year are recorded. Consequently, if a company's employees are paid every two weeks and the end of an accounting period occurs in the middle of these two weeks, neither liability nor expense has been recorded for the last week. To bring the accounts up to date for the preparation of financial statements, both the wage expense and the wage liability accounts need to be increased.A necessary step in the accounting process, then, is the adjustment of all accounts to an accrual basis and their subsequent posting to the general ledger.Adjusting entries are therefore necessary to achieve a proper matching of revenues and expenses in the determination of net income for the current period and to achieve an accurate statement of the assets and equities existing at the end of the period.Adjustment principles∙The revenue recognition principle∙The matching principleWhat to adjust?Each adjusting entry affects both a real account (assets, liability, or owner's equity) and a nominal or income statement account (revenue or expense). The four basic types of adjusting entries are:1.deferred expenses that benefits more than one period: for example,prepaid expenses (e.g. prepaid insurance, rent) are expenses paid in advance and recorded as assets before they are used or consumed.When these assets are consumed, expenses should be recognized: a debit to an expense account and a credit to an asset account. Another example is depreciation. The cost of a long-term asset is allocated as anexpense over its useful life. At the end of each period depreciation expense is recorded through an adjusting entry: a debit to a depreciation expense account and a credit to an accumulated depreciation account (a contra account used to total the past depreciation expenses on specific long-term assets).2.accrued expenses that incurred but not yet paid or recorded: examplesare employee salaries and interest on borrowed money. At the end of the accounting period, the accrued expense is recorded through an adjusting entry: a debit to an expense account (i.e. Salaries Expense) and a credit to a liability account (i.e. Salaries Payable).3.accrued revenues that earned but not yet received or recorded: also calledunrecorded revenues. Examples include interest revenues, rent revenues, etc. Such revenues accumulate with the passing of time, but the firm may have not received the payment or billed the client. An adjusting entry should be: a debit to an asset account (i.e. Accounts Receivable) and a credit to a revenue account (i.e. Interest Revenue).4.unearned revenues that are revenues received in cash before delivery ofgoods/services: examples are magazine subscription fees, customer deposits for services. These "revenues" are not earned yet and thus should be recorded as liabilities. An adjusting entry should be: a debit to a liability account (i.e. Unearned Revenue) and a credit to a revenue account (i.e. Revenue).User CommentsPosted by GiGi @ 2004-01-29 06:26:22.accrual system!!! definitionPosted by Gina @ 2004-02-03 22:17:33.accrual based accounting recognizes the impact of a business event as it occurs, regardless of whether transaction affected cashPosted by Gina @ 2004-02-03 22:20:20.Revenue Principle: basis for recording revenues (ie tells when to record revenue and the amounts).Matching Principle: basis for recording expensis (ie direction to ID all expenses during the period, measure them, and match them against the revenues earned in that period).c. explain why the accrual basis of accounting produces more useful income statements and balance sheets than the cash basis.Revenue is something earned through the sale of goods or services. Not all cash receipts are revenues; for example, cash received through a loan is not revenue. Expenses are the cost of goods or services used to generate revenues. Not all cash payments are expenses; for example, cash dividends paid to stockholders are not expenses. Net income is the difference between revenues and expenses. It is reported on the income statement, and is the focus in evaluating a firm's profitability.Most companies use the accrual basis accounting, recognizing revenue when it is earned (the goods are sold or the services performed) and recognizing expenses in the period incurred, without regard to the time of receipt or payment of cash. Net income is revenue earned minus expenses incurred.Under the strict cash basis accounting, revenue is recorded only when the cash is received and expenses are recorded only when the cash is paid. Net income is cash revenue minus cash expenses. The matching principle is ignored here, resulting inconformity with generally accepted accounting principles.Today's economy is considerably more lubricated by credit than by cash. And the accrual basis, not the cash basis, recognizes all aspects of the credit phenomenon. Investors, creditors, and other decision makers seek timely information about an enterprise's future cash flows. Accrual basis accounting provides this information by reporting the cash inflows and outflows associated with earnings activities as soon as these cash flows can be estimated with an acceptable degree of certainty. Receivables and payables are forecasters of future cash inflows and outflows. In other words, accrual basis accounting aids in predicting future cash flows by reporting transactions and other events with cash consequences at the time the transactions and events occur, rather than when the cash is received and paid. Accrual accounting generally provides a better indication of performance than cash basis of accounting since it increases the comparability of income statements and balance sheets across periods.B. Financial Reporting and Analysisa. define each asset and liability category on the balance sheet and prepare a classified balance sheet.Think of the balance sheet as a photo of the business at a specific point in time. It presents the assets, liabilities, and the equity ownership of a business entity as of a specific date.∙Assets are the economic resources controlled by the firm.∙Liabilities are the financial obligations that the firm must fulfill in the future.Liabilities are typically fulfilled by payment of cash. They represent the source of financing provided to the firm by the creditors.∙Equity Ownership is the owner's investments and the total earnings retained from the commencement of the firm. Equity represents the source of financing provided to the firm by the owners.Balance sheet accounts are classified so that similar items are grouped together to arrive at significant subtotals. Furthermore, the material is arranged so that important relationships are shown.The table below indicates the general format of balance sheet presentation: Balance Sheet ClassificationsAssets Liabilities and Owner's EquityCurrent Assets Current liabilitiesLong-term investments Long-term debtProperty, plan and equipment Owner's equityIntangible assets Capital stockOther assets Additional paid-in capitalRetained earningsCurrent Assets:They are cash and other assets expected to be converted into cash, sold, or consumed either in one year or in the operating cycle, whichever is longer. The operating cycle is the average time between the acquisition of materials and supplies and the realization of cash through sales of the product for which the materials and supplies were acquired. The cycle operates from cash through inventory, production, and receivables back to cash. Where there are several operating cycles within one year, the one-year period is used. If the operating cycle is more than one year, the longer period is used.Current assets are presented in the balance sheet in order of liquidity. The five major items found in the current asset section are:∙Cash:valued at its stated value. Cash restricted for purpose other than payment of current obligations or for use in current operations should be excluded from the current asset section.∙Marketable securities: Also referred to as marketable securities. Valued at cost or lower of cost and market.∙Accounts receivables:amounts owed to the firm by its customers for goods and services delivered. Valued at the estimated amount collectible.∙Inventories: Products that will be sold in the normal course of business.∙Prepaid expenses: they are expenditures already made for benefits (usually services) to be received within one year or the operating cycle, whichever is longer. Typical examples are prepaid rent, advertising, taxes, insurance policy, and office or operating supplies. They are reported at the amount of un-expired or unconsumed cost.Long-Term Investments:Often referred to simply as investments, they are to be held for many years, and are not acquired with the intention of disposing of them in the near future.∙Investments in securities such as bonds, common stock, or long-term notes that management does not intend to sell within one year.∙Investments in tangible fixed assets not currently used in operations, such as land held for speculation.∙Investments set aside in special funds such as a sinking fund, pension fund, or plant expansion fund. The cash surrender value of life insurance is included here.∙Investments in non-consolidated subsidiaries or affiliated companies. Property, Plant, and Equipment:They are properties of a durable nature used in the regular operations of the business. With the exception of land, most assets are either depreciable (such as building) or consumable.Intangible Assets:They lack physical substance and usually have a high degree of uncertainty concerning their future benefits. They include patents, copyrights, franchises, goodwill, trademarks, trade names, secret processes, and organization costs. Generally, all of these intangibles are written off (amortized) to expense over 5 to 40 years.Other Assets:They vary widely in practice. Examples include deferred charges (long-term prepaid expenses), non-current receivables, intangible assets, assets in special funds, and advances to subsidiaries.Current Liabilities:They are obligations that are reasonably expected to be liquidated either through the use of current assets or the creation of other current liabilities within one year or within the operating cycle, whichever is longer. They are not reported in any consistent order. A typical order is: Notes payable, accounts payable, accrued items (e.g. accrued warranty costs, compensation and benefits) income taxes payable, current maturities of long-term debt, etc.The excess of total current assets over total current liabilities is referred to as working capital. It represents the net amount of a company's relatively liquid resources; that is, it is the liquid buffer, or margin of safety, available to meet the financial demands of the operating cycle.Long-Term LiabilitiesThey are obligations that are not reasonably expected to be liquidated within the normal operating cycle but, instead, at some date beyond that time. Bonds payable, notes payable, deferred income taxes, lease obligations, and pensionobligations are the most common long-term liabilities. Generally they are of three types:∙Obligations arising from specific financing situations, such as issuance of bonds, long-term lease obligations, and long-term notes payable.∙Obligations arising from the ordinary operations of the enterprise such as pension obligations and deferred income tax liabilities.∙Obligations that are dependent upon the occurrence or non-occurrence of one or more future events to confirm the amount payable, or the payee, or the date payable, such as service or product warranties and other contingencies.Owner's Equity:The complexity of capital stock agreements and the various restrictions on residual equity imposed by state corporation laws, liability agreements, and boards of directors make the owner's equity section one of the most difficult sections to prepare and understand. The section is usually divided into three parts:∙Capital stock: the par or stated value of the shares issued.∙Additional paid-in capital: the excess of amounts paid in over the par or stated value.∙Retained earnings: the corporation's undistributed earnings.b. define each component of a multi-step income statement and prepare a multi-step income statement.The income statement measures the success of business operations for a given period of time. A single-step income statement groups revenues together and expenses together, without further classifying each of the groups. A multi-step income statement makes further classifications to provide additional important revenue and expense data. These classifications make the income statement more informative and useful. It is recommended because:∙it recognizes a separation of operating transactions from non-operating transactions;∙it matches costs and expenses with related revenues;∙it highlights certain intermediate components of income that are used for the computation of ratios used to assess the performance of the enterprise.Components:∙Operating section: a report of the revenues and expenses of the company's principal operations.o Sales or revenue section: a subsection presenting sales, discounts, allowances, returns, and other related information, and to arrive atthe net amount of sales revenue.o Cost of goods sold section:a subsection that shows the cost of goods that were sold to product the sales.o Selling expense: a subsection that lists expenses resulting from the company's efforts to make sales.o Administrative or general expenses: a subsection reporting expenses of general administration.Non-operating section: a report of revenues and expenses resulting from secondary or auxiliary activities of the company. In addition, special gains and losses that are infrequent or unusual, but not both, are normally reported in this section. Generally these items break down into two main subsections:o Other revenues and gains: A list of the revenues earned or gains incurred, generally net of related expenses, from non-operatingtransactions.o Other expenses and losses: A list of the expenses or losses incurred, generally net of any related incomes, from non-operatingtransactions.∙Income taxes: A short section reporting federal and state taxes levied on income from continuing operations.∙Discontinued operations: material gains or losses resulting from the disposition of a segment of the business.∙Extraordinary items: Unusual AND infrequent material gains and losses.∙Cumulative effect of a change in accounting principle.∙Earnings per share.C. Short-Term Liquid Assetsa. describe how to choose the appropriate accounting method for investment securities and explain how fair (market) value gains and losses on such investments are reported.Short-term investments, also called marketable securities,ordinarily consist of short-term paper (certificates of deposit, treasury bills, and commercial paper), marketable debt securities (government and corporate bonds), and marketable equity securities (preferred and common stock) acquired with cash not immediately needed in operations.They must be:∙readily marketable: can be sold quite easily.∙intended to be converted into cash as needed within one year or the operating cycle, whichever is longer.Securities that are intended to be held for more than one year are called long-term investments.There are two types of gains and losses:∙Realized gains and losses: the difference between the fair market value and the cost of the securities when they are sold.∙Unrealized holding gains and losses:the difference between the fair market value and the cost of the securities when they are still held by the firm. The gains and losses are unrealized because securities have not been sold.In general:∙When securities are purchased, they are recorded at cost. The cost of the securities includes purchase price and any broker's fees or fees paid to acquire securities.∙Interest and dividends generally are recognized as revenue when they are received.∙When securities are sold, the cost is compared to the sales price, and the difference is recorded as a gain or a loss.∙At the end of each accounting period, the balance of the controlling account is adjusted to reflect the current market value of the securities owned.However, different categories of investment securities have different treatment on unrealized holding gains and losses.∙Held-to-maturity securities:Debt securities that management intends to hold to their maturity date. At year end, they are reported at cost adjusted for the effect of interest (debit the securities account and credit interest income account), and unrealized holding gains and losses are not recognized.Trading securities: Debt and equity securities bought and held mainly for sale in the near term to generate income on price changes. At year end, they are reported at their fair market value. Any unrealized holding gains or losses are recognized on the firm's income statement as part of the net income. When they are sold, the realized gains or losses will also appear on the income statement. Realized gains and losses are not affected by any unrealized gains or losses recognized before.Example:1.12/1/2002, 100 shares purchased at $80 per share for tradingpurposes:Entry: Trading Securities 8000(Debit) | Cash 8000 (Credit)2.12/31/2002, the price is $60 per share.Entry: Unrealized Loss on Investments 2000 (Debit) | Allowance to Adjust Short-Term Investments to Market 2000 (Credit).The allowance account is shown on the balance sheet as a contra-asset account:Trading Securities (at cost) 8000Allowance Account (2000)Trading Securities (at market) 6000The $2000 unrealized loss is reported in the income statement for 2002.3.06/12/2003, 100 shares sold at $120 per share.Entry: Cash 12000 (Debit) | Trading Securities 8000 (Credit) | Realized Gain on Investment 4000 (Credit)The $4000 realized gain is reported in the income statement of 2003.Available-for-sale securities:Debt and equity securities not classified as held-to-maturity or trading securities. The unrealized gains and losses are reported in the balance sheet as an adjustment to the shareholders' equity (in contrast, the unrealized gains or losses of trading securities are reported in the income statement as part of the net income). Other than that, they are accounted for in the same way as trading securities. Example:1.12/1/2002, 100 shares purchased at $80 per share for tradingpurposes:Entry: Available-for-Sale Securities 8000(Debit) | Cash 8000 (Credit)2.12/31/2002, the price is $60 per share.Entry: Unrealized Loss on Investments 2000 - Equity (Debit) | Allowance to Adjust Short-Term Investments to Market 2000 (Credit).The allowance account is shown on the balance sheet as a contra-asset account:Available-for-Sale Securities (at cost) 8000Allowance Account (2000)Available-for-Sale Securities (at market) 6000The $2000 unrealized loss is reported in the balance sheet for 2002 as a component of stockholder's equity.3.06/12/2003, 100 shares sold at $120 per share.Entry: Cash 12000 (Debit) | Trading Securities 8000 (Credit) | Realized Gain on Investment 4000 (Credit)The $4000 realized gain is reported in the income statement of 2003. User CommentsPosted by shasha @ 2003-11-15 04:02:09.AFS (available-for-sale) is kind of short-term investment, however, its market value change should be adjusted to the equity as well.Posted by Gina @ 2004-02-12 01:51:11.AFS can be short or long-term. Since they are reported on the balance sheet at market value, this reporting needs to be adjusted from their last carrying amount to current market value.The unrealized gain or loss is reported in 2 places:(1) Income statement - under 'Other comprehensive income' (net of tax) [but not as part of net income];(2) OE - prehensive income - unrealized gain on investments (net of tax).善待自己,学会放弃,得而不喜,失而不烦,弃而不悔,多一份执着和自信,添一份洒脱和从容,才是潇洒快乐的人生!善待自己,学会原谅。
财务报表分析理论基础

的重要表分析的信息基础
(一)财务报告概念框架
总而言之,财务会计概念框架所采用的“决策有用观”使财务报表具备了价值相关性,这便为财务报表 分析系统提供了有效的信息输入,并使利用财务报表分析帮助使用者提高决策能力成为可能。但是,在 现实会计环境下,财务报表的决策有用性并不在于直接预侧公司的未来收益,而是致力于提供相关和可 靠的信息,从而帮助投资者形成自己的预期。因此其相关性是“间接相关”,而且由于固有局限,现行 财务报表信息也非完全可靠,在这种情况下,如何利用存在一定误差的财务报表信息对未来进行合理预 测,需要财务报表分析来起到桥梁的作用,以使投资者能够在公司过去业绩和未来前景之间建立起恰当 的联系。可见,现行的财务报表信息“非完全可靠,非完全相关“的特点,决定了我们必须进行财务报 表分析,而且能够通过恰当的财务报表分析帮助使用者提高决策能力。
经典研究学派与财务报表分析
财务报表的制度框架—财务报表分析的信息基础
(二)会计准则
为了限制公司管理层对财务报表的操纵,各个国家都制定了相应的会计准则来对资产如何计量、负债何 时记录、收人何时确认、费用何时应计等重要会计问题进行约束。会计准则带来的“硬约束”,无疑增 加了财务报表的可靠性和可比性,但是,会计准则也无法确保会计信息完全真实可靠,主要原因在于:
由此可见,在信息不对称的市场中,我们不仅需要完整的信息生产、传递系统,还需要相配套的信息 解释系统。
经典研究学派与财务报表分析
应计制会计与财务报表分析的必要性
应计制财务报表的复杂性为报表分析提供了两方面契机: ➢ 首先,我们可以利用财务报表分析排除技术性错误。经济业务的复杂性使得应计会计需要大量的估计
财务报表分析英文课件

Examines the purchase and redemption of treasury stock and its impact on the financial statements
Income statement analysis
Revenue Recognition
Examining the methods and timelines of revenue recognition to ensure it complies with Generally Accepted Accounting Principles (GAAP)
Distinguishing between direct and indirect costs to better understand the impact of each on the capability of specific products or services
Direct vs. Indirect Costs
Investment in Property, Plant, and Equipment: This category includes cash outflows related to the purchase of fixed assets, such as property, plant, and equipment
财务报表分析英文课件70页PPT文档
Primary Types of Financial Statements
Balance Sheet
A summary of a firm’s financial position on a given date that shows total assets = total liabilities + owners’ equity.
Prepaid Exp d
5 c. Amounts owed by
Accum Tax Prepay
10 customers.
Current Assetse $1,195 d. Future expense items
Fixed Assets (Cost)f 1030
already paid.
Less: Acc. Depr. g
Shareholders -- Focus on the profitability and long-term health of the firm.
6-3
Examples of Internal Uses of Statement Analysis
Plan -- Focus on assessing the current financial position and evaluating potential firm opportunities. Control -- Focus on return on investment for various assets and asset efficiency. Understand -- Focus on understanding how suppliers of funds analyze the firm.
财务报告分析方案研讨共67张PPT

•(1) its liquidity流动性, •(2) its profitability盈利性, •(3 ) its solvency偿付能力.
• Every item reported in a financial statement has significance.
第四页,共六十七页。
•In order to obtain information as to whether the amount 1 represents an increase over prior years or 2 is adequate in relation to the company’s
(trend analysis) is a technique for evaluating a series of financial statement data over a period of time.
第六页,共六十七页。
TOOLS OF
FINANCIAL
STATEMENT ANALYSIS
第十六页,共六十七页。
CURRENT ASSETS OF QUALITY DEPARTMENT STORE
Current assets
Cash
Temporary invest. Receivables (net) Inventory
财务报表分析》(简明版)习题参考答案人大版
财务报表分析》(简明版)习题参考答案人大版1.财务杠杆经营杠杆组合杠杆2.财务风险经营风险市场风险3.风险溢价理论股息贴现模型4.股息率市盈率市净率5.市盈率市净率股息率二、单项选择题1.B2.C3.D4.D5.C6.E7.A8.D9.E10.C三、多项选择题1.A B C D E2.A B C D E3.A B C D4.A B C D E5.A B C D E四、判断题TFTFF该套设备在购置之初符合了引领行业未来发展的预期,因此资产质量较好。
但随后不到半年的时间内,该设备无法满足公司特定要求,很快就成为了不良资产,需要计提减值准备。
然而,在第二年公司对该项资产进行了改装,符合了公司的特定要求,因此重新成为了优质资产。
这一过程说明资产质量具有相对性属性。
关于公司信息披露和内幕交易问题,同一项资产在不同时间点上表现出不同的资产质量是正常的现象。
但如果上市公司与庄家勾结,利用资产质量变化对企业业绩带来影响的预期,在资本市场上进行股价操纵,从而获取超额收益,那么就属于应该受到监管部门查处的内幕交易问题。
___2019年年报的母公司资产负债表中,负债主要由押金、保证金和应付职工薪酬构成,没有产生任何经营性负债和金融性负债项目。
因此,负债对公司发展的贡献力较低,没有体现出任何战略色彩和行业竞争力因素。
公司的投入资本总额在当期没有变化,说明母公司没有进行再融资行为。
留存资本虽然增加了,但仍只占股东权益总额的12%,说明母公司资金的主要来源仍然是股东入资。
本案例涉及到从企业利润结构的角度评价企业的利润质量问题。
在企业利润表中,毛利、营业利润、利润总额和净利润等利润概念是重要的指标。
其中,核心利润是本书作者根据现有上市公司利润表结构缺陷提出的概念。
企业利润总额的实质性支撑点主要包括核心利润、投资收益和营业外收入。
本案例中,学区房出售所获得的利润属于营业外收入,而非核心利润或投资收益。
企业的经营性资产会产生核心利润,如果经营性资产不能产生核心利润,则靠营业外收入扭亏为盈只能改变当年的利润规模,不能改变企业的核心竞争力和经营性资产的盈利能力。
财务报表分析与运用杰拉尔德课后答案英文版第三章

财务报表分析与运用杰拉尔德课后答案英文版第三章Chapter 3 - Solutions Overview:Problem Length Problem #’s{S} 1, 3{M} 2, 7, 8, 12, 13{L} 4 - 6, 9 - 11, 14, 15 1.{S}a. Palomba Pizza StoresStatement of Cash FlowsCash Flows from OperatingActivities:Cash Collections from Customers Cash Payments to SuppliersCash Payments for SalariesCash Payments for InterestNet Cash from Operating Activities Cash Flows from Investing Activities:Sales of EquipmentPurchase of EquipmentPurchase of LandNet Cash for Investing Activities Cash Flows from Financing Activities:Retirement of Common StockPayment of DividendsNet Cash for Financing Activities Net Increase in CashCash at Beginning of YearCash at End of Year $ 250,000(85,000)(45,000)(10,000)38,000(30,000)(14,000)(25,000)(35,000)$ 110,000(6,000)(60,000)$ 44,00050,000$ 94,000b. Cash Flow from Operations (CFO) measures the cashgenerating ability of operations, in addition to profitability. If used as a measure of performance, CFO is less subject to distortion than net income. Analysts use the CFO as a check on the quality of reported earnings, although it is not a substitute for net income. Companies with high net income and low CFO may be using overly aggressive income recognition techniques. The ability ofa firm to generate cash from operations on a consistentbasis is one indication of the financial health of the firm. Analysts search for trends in CFO to indicate future3-1cash conditions and potential liquidity or solvency problems.Cash Flow from Investing Activities (CFI) reports how the firm is investing its excess cash. The analyst must consider the ability of the firm to continue to grow and CFI is a good indication of the attitude of management in this area. This component of total cash flow includes the capital expenditures made by management to maintain and expand productive capacity. Decreasing CFI may be a forecast of slower future growth.Cash Flow from Financing (CFF) indicates the sources of financing for the firm. For firms that require external sources of financing (either borrowing or equity financing) it communicates management's preferences regarding financial leverage. Debt financing indicates future cash requirements for principal and interest payments. Equity financing will cause future earnings per share dilution.For firms whose operating cash flow exceeds investment needs, CFF indicates whether that excess is used to repay debt, pay (or increase) cash dividends, or repurchase outstanding shares.c. Cash payments for interest should be classified as CFF forpurposes of analysis. This classification separates the effect of financial leverage decisions from operating results. It also facilitates the comparison of Palomba with other firms whose financial leverage differs.d. The change in cash has no analytic significance. The changein cash (and hence, the cash balance at the end of the year) is a product of management decisions regarding financing.For example, the firm can show a large cash balance by drawing on bank lines just prior to year end.e. andf.There are a number of definitions of free cash flows.In the text, free cash flow is defined as cash from operations less the amount of capital expenditures required to maintain the firm’s current productive capacity. This definition requires the exclusion of costs of growth and acquisitions. However, few firms provide separate disclosures of expenditures incurred to maintain productive capacity. Capital costs of acquisitions may be3-2obtained from proxy statements and other disclosures of acquisitions (See Chapter 14).In the finance literature, free cash flows available to equity holders are often measured as cash from operations less capital expenditures. Interest paid is a deduction when computing cash from operations as it is paid to creditors. Palomba’s free cash flow available to equity holders is calculated as follows:Net cash flow from operating activities less net cash for investing activities:$110,000 - $6,000 = $104,000The investment activities disclosed in the problem do not indicate any acquisitions.Another definition of free cash flows, which focuses on free cash flow available to all providers of capital, would exclude payments for interest ($10,000 in this case) and debt. Thus, Palomba’s free cash flow available to all providers of capital would be $114,000.1996 1997 1998 1999 2000 2001SalesBad debt expense Net receivables Cash collections1$ ------30$ ---$ 140740$ 123$150750$133$165860$147$1751075$150$1951095$1651 Sales - bad debt expense - increase in net receivables1997 1998 1999 2000 2001 Bad debt expense/sales 5.0% 4.7% 4.9% 5.7% 5.1% Net receivables/sales 28.6 33.3 36.4 42.8 48.7 Cash collections/sales 87.9 88.7 89.1 85.7 84.6 c. The bad debt provision does not seem to be adequate. From1997 - 2001 sales increased by approximately 40%, while net receivables more than doubled, indicating that collections have been lagging. The ratios calculated in part b also indicate the problem. While bad debt expense has remained fairly constant at 5% of sales over the 5 year period, net receivables as a percentage of sales have increased from 29% to 49%; cash collections relative to3-3sales have declined. Other possible explanations for these data are that stated payment terms have lengthened or that Stengel has allowed customers to delay payment for competitive reasons.3-43.{S}Niagara CompanyStatement of Cash Flows 2001Cash collectionsCash inputsCash expensesCash interest paidIncome taxes paidCash from Operations Purchase of fixed assets Cash Used for Investing Increase in LT debt Decrease in notes payable Dividends paidCash Used for Financing Net Change in CashCash Balance 12/31/00 Cash Balance 12/31/01 $ 980(670)(75)(40)(30)$ 165(150)(150)50(25)(30)(5)$ 1050$ 60[Sales - ∆ Accounts Receivable][COGS + ∆ Inventory[Selling & General Expense - ∆ Accounts Payable1][Interest Expense - ∆ Interest Payable][Income Tax Expense - ∆ Deferred Tax][Depreciation Expense + ∆ Fixed Assets (net)][Net Income - ∆ Retained earnings]1 Can also be used to calculate cash inputs, decreasing that outflow to $645 while increasing cash expenses to $100.3-53-64.{L}a. G CompanySalesCOGS + operating expenses 1 Depreciation Interest TaxesNet income$ 3,8413,65115 41 42 $ 92[receipts from customers + increase in accounts receivable][payments - increase in inventory + increase in accounts payable][increase in accumulated depreciation] [payments][payment + increase in tax payable][check = change in retained earnings as there are no dividends]1 Note that these two items cannot be calculated separately from the informationavailable.b. M CompanyCash receipts from: Customers Issue of stock Short-term debt Long-term debt Total Cash disbursements: COGS and operating expenses Taxes Interest Dividends PP&E purchase Total Change in cash $ 1,807 3 62 96 $ 1,968$ 1,8433 51 22 33 $ 1,952 $ 16[Sales - increase in receivables] [Increase in account] [Increase in liability] [Increase in liability][COGS + operating expense + increase in inventory + decrease in accounts payable][Expense - increase in tax payable] [Expense][Income + increase in retained earnings][Change in PP&E]Note : This is not a true receipts and disbursements schedule as it shows certain amounts (e.g., debt) on a net basis rather than gross. Such schedules (and cash flow statements) prepared from published data can only show some amounts net, unless supplementary data are available.c. The cash flow statements are presented with the incomestatement for comparison purposes in answering Part d.1996 1997 1998 1999 2000 CFO:From customers Less outlays for: COGS/oper. exp. InterestTaxesCFI:PP&E purchase CFF:Issue of stock Short-term debt Long-term debt DividendsStock repurchase LT debt repaidST debt repaid Change in cash $1,1651,1301523$ (3)(14)564--(20)(22)(2)--$ 258$1,2101,1871919$ (15)(17)565--(21)(14)(2)--$ 331$1,3271,326169$ (24)(37)8--100(21)--(3)(8)$ 7615$1,5871,672219$ (115)(30)3153--(21)(10)----$ 125(20)$1,8071,843513$ (90)(33)36296(22)------$ 139161996 1997 1998 1999 2000SalesCOGSOperating expense Depreciation InterestTaxesTotalNet Income $ 1,22081829891538$ 1,17842$ 1,265843320101933$ 1,22540$ 1,384931363111627$ 1,34836$ 1,6551,125434122126$ 1,85237$ 1,8611,27750414516$ 1,85293-71996 1997 1998 1999 2000 CFO:From customers Disbursements: COGS/Oper. exp. InterestTaxesCFI:PP&E purchase CFF:Issue of stock Short-term debt Long-term debt Change in cash $1,1101,2141113$ (128)---108040$ 130$ 2$1,6591,7021315$ (71)------5223$ 75$ 4$2,1631,7022316$ (93)(20)59120$ 116$ 3$2,8092,8952929$ (144)(10)453125$ 173$ 19$3,6793,7784135$ (175)---306050$ 140$ 35 1996 1997 1998 1999 2000SalesCOGSOperating expense Depreciation InterestTaxesTotalNet income $ 1,3391,039243101113$ 1,316$ 23$ 1,7311,334312101320$ 1,689$ 42$ 2,2611,743398122327$ 2,203$ 58$ 2,9392,267524142931$ 2,865$ 74$ 3,841} ---}3,651154142$ 3,749$ 92Note: 2000 COGS and operating expense are combined as there is insufficient information to separate them.3-8d. Both companies are credit risks. Although both areprofitable, their CFO is increasingly negative. If current trends continue they face possible insolvency. However, before rejecting both loans outright, it is important to know whether CFO and income differ because the companies are doing poorly or because they are growing too fast.Both companies increased sales over the 5 year period;Company M by 50%, Company G by more than 300%. Are these sales real (will cash collections materialize)? If they are "growing too fast," it may be advisable to make the loan but also to force the company to curtail its growth until CFO catches up. One way to verify whether the gap is the result of sales to poor credit risks is to check if the growth in receivables is "proportional" to the sales growth. Similar checks can be made for the growth in inventories and payables. In this case, the inventory of M company has doubled from 1996 to 2000 while COGS increased by only 56%. The inventory increase would be one area to investigate further.There is a significant difference in the investment pattern of the two companies. Company M has made purchases of PPE each year, while Company G has made little net investment in PPE over the period. Yet Company G has grown much faster. Does this reflect the nature of the business (Company G is much less capital intensive) or has CompanyG used off balance sheet financing techniques?The cash from financing patterns of the two companies also differ. Both tripled their total debt over the period and increased the ratio of total debt to equity. Given Company M's slower growth (in sales and equity), its debt burden has grown much more rapidly. Despite this, Company M has continued to pay dividends and repurchase stock. CompanyG has not paid dividends and has issued new equity. Thesetwo factors account for its larger increase in equity from 1996 to 2000.Based only on the financial data provided, G looks like the better credit risk. Its sales and income are growing rapidly, while M's income is stable to declining on modestly growing sales. Unless further investigation changes the insights discussed here, you should prefer to lend to Company G.3-95.{L}a. (i)Statement of Cash Flows - Indirect MethodCash from operations:Net income $1,080Add noncash expense: depreciation 600Add/Subtract changes in working capital:Accounts receivable (150)Inventory (200)Accruals 80Accounts payable 120 (150) Cash from investing:Capital expenditures 1,150Cash from financing:Short term borrowing 550Long-term repayment (398)Dividends (432)$(280) Net change in cash $ 100Income Balance Sheet CashStatement 12/31/00 12/31/01 Change Effect Net income $1,080 $1,080 Depreciation 600 600 Accounts receivable $1,500 $1,650 $150 (150) Inventory 2,000 2,200 200 (200) Accruals 800 880 80 80 Accounts payable 1,200 1,320 120 120 Depreciation (600) (600) Net fixed assets 6,500 7,050 550 (550) Capital expenditures $(1,150) Note payable 5,500 6,050 550 550 Short-term borrowing $ 550Long-term debt 2,000 1,602 (398) (398) Long-term debt repayment $ (398) Net income (1,080) (1,080) Retained earnings 500 1,148 648 648 Dividends paid $ (432)_________ ______0 $ 100The worksheet to create the cash flow statement is presented above. Each balance sheet change (other than cash) is accounted for and matched with its corresponding activity. As a last check, the net income and the add-backs of non-cash items are balanced and “closed” to their respective accounts (PP&E and retained earnings) providing the amounts of capital expenditures and dividends.a. (ii) Statement of Cash Flows - Direct MethodCash from Operations:Cash collections $9,850Cash payments for merchandise (6,080)Cash paid for SG&A (920)Cash paid for interest (600)Cash paid for taxes (720) Cash for Investing Activities:Capital expenditures (1,150) Cash for Financing Activities:Short-term borrowing 550Long-term debt repayment ( 398)Dividends ( 432)$( 280) Net Change in Cash $ 100The worksheet to create the cash flow statement is presented below. Each balance sheet change (other than cash) is accounted for and matched with its corresponding activity. Furthermore the operating account changes are matched to their corresponding income statement item. As a last check, the net income is balanced and “closed” to retained earnings providing the amount of dividends.Note that there is no difference between the indirect and direct methods in the cash flow statement and in the worksheet for cash for investing and financing activities,Income Balance Sheet CashStatement 12/31/00 12/31/01 Change Effect Sales $10,000 $10,000 Accounts receivable $ 1,500 $ 1,650 $ 150 (150) Cash Collections$ 9,850COGS (6,000) (6,000) Inventory 2,000 2,200 200 (200) Accounts payable 1,200 1,320 120 120 Cash Paid for Merchandise $(6,080)SG&A expense (1,000) (1,000) Accruals 800 880 80 80 Cash Paid for SG&A $ (920)Interest expense (600) (600) Cash Paid for Interest $ (600) Taxes (720) (720) Cash Paid for Taxes $ (720)Depreciation (600) (600) Net fixed assets 6,500 7,050 550 (550) Capital Expenditures $(1,150) Note payable 5,500 6,050 550 550 Short-term Borrowing $ 550Long-term debt 2,000 1,602 (398) (398) Long-term Debt Repaid $ (398) Net income (1,080) (1,080) Retained earnings 500 1,148 648 648 Dividends $ (432)___ ___ _______$ 0 $ 1006.{L}a. Exhibit 3P-3 does not provide the (changes in the)individual components that make up the changes in workingcapital. As such, to create the direct method cash flowstatement, we must obtain the information directly fromthe balance sheet. This procedure does not necessarilyyield the same cash flow components using the direct methodas those provided by the company in its indirect methodcalculations. Differences may arise when1.there are acquisitions/divestments2.there are foreign exchange adjustments3.the firm aggregates or classifies investing accrualstogether with operating ones.In this case, the differences are minimal as indicated below. (The calculations required for the direct method cash flow statement are presented in Exhibit 3S-1 along with the assumptions used to generate the statement)Direct Method Cash Flow Statement (Exhibit 3S-1) IndirectMethod(Exhibit3P-3)DifferenceCash collections $348,627Cash for suppliers (246,100)Cash expenses (94,791)Interest paid (5,303)Tax paid (2,127)C ASH F ROM O PERATIONS$4,560 $4,398 $162C ASH F ROM INVESTMENTS(4,251) (4,089) (162)C ASH F ROM F INANCING215 215 ---C HANGE IN CASH$524 $524 ---Income Balance BalanceStatement Sheet Sheet2001 12/31/00 6/30/2001 Change Cash Effect Sales $342,215 $ 342,215 Accounts receivable 91,636 85,224 (6,412) 6,412 Cash collections $ 348,627Cost of goods sold (238,799) (238,799) Inventories 163,206 158,451 (4,755) 4,755 Accounts payable 84,734 72,678 (12,056) (12,056) Cash inputs $(246,100)Operating expenses (91,795) (91,795) Other current assets 1,426 1,843 417 (417) Prepaid expenses &other assets 55,566 56,630 1,064 (1,064) Accrued expenses* 17,679 16,299 (1,380) (1,380) Postretirement benefitobligation 2,265 2,130 (135) (135) Cash expenses $ (94,791) Interest expense (5,128) (5,128) Interest payable* 175 0 (175) (175) Interest paid $ (5,303)Tax expense (831) (831) Income tax receivable 4,116 2,889 (1,227) 1,227 Income tax payable 1,130 2,383 1,253 1,253 Deferred income taxes 18,096 18,574 478 478 Tax paid $ 2,127C ASH FLOW FROM OPERATIONS4,560Depreciation expense (4,732) (4,732) Fixed assets 91,108 90,966 (142) 142 Investments in jointventures 9,714 9,591 (123) 123 Minority interest 971 1,187 216 216C ASH FLOW FROM INVESTMENTS$(4,251)Current portion oflong-term debt 3,425 3,425 - 0 Long-term debt 161,135 165,799 4,664 4,664 Dividends paid** (4,461) Other - change in stockholders' equity 12C ASH FLOW FROM FINANCING$215 Net Income (check) 930Net change in cash $ 524* Assumed change in interest payable to conform to interest paid.** From the indirect method1st 6Months1996 1997 1998 1999 2000 2001 Totals CFO $34,915 $ 5,165 $(23,528) $73,597 $(18,606) $4,560 $ 76,103 CFI (38,007) (42,977) (46,767) (13,500) (9,017) (4,251) (154,519) $(3,092) $(37,812) $(70,295) $60,097 $(27,623) $ 309 $(78,416) CFF 4,230 38,782 70,474 (60,473) 27,124 215 80,352As noted in Box 3-2, from 1996 to 2000, the companygenerated free cash flow (CFO less net capitalexpenditures) of $1.5 million, during the first six monthsthe A. M. Castle added another $309 thousand. However, Box3-2 also showed that over the five-year period, Castle paidnearly $50 million in dividends and borrowed nearly $130million to finance its investments and acquisitions. Thistrend continued in the first six months of 2001 duringwhich the firm borrowed an additional $4.664 million tohelp pay its dividends and meet capital expenditure needs.Cash generated from operations from 1996 through the endof the first 6 months of 2001 was $76 million but thecompany spent $154 million to replace productive capacityand for investments and acquisitions. When free cash flowsis calculated on this basis (i.e. CFO – CFI) there is ashortfall of $78 million. This shortfall as well asdividend payments were financed by borrowing over the sameperiod.The inability to meet its capital and dividend needs fromoperations clearly indicated that either the dividendwould have to be reduced or the company would not be ableto remain competitive and/or grow as needed.7.{M}a.•T he Swedish GAAP cash flow statements (CFS) begin with pretax and pre-financial items whereas the U.S. GAAP CFS showadjustments to net income.•T he net financial items aggregate interest costs and interest income from various sources (including dividends andinterest from associated companies and other interestincome) .•S wedish GAAP CFS aggregate all changes in working capital; U.S.GAAP CFS provide detailed disclosure of the operatingchanges in components of working capital; non-operatingchanges are reported as components of investingactivities.•S wedish GAAP combines cash and cash equivalents, financial receivables (primarily receivables from associatedcompanies) and financial liabilities (current andlong-term debt) in a measure called net financial assetsor liabilities. SFAS 95 shows the change in cash and cashequivalents with changes in financial receivablesreported as components of CFO and CFI. Changes in currentand long-term debt are reported in cash from financingactivities.b.The cash flow statement is shown on page 16.c. Disadvantages:(1)Aggregation of all changes in operating or workingcapital accounts combines cash consequences ofoperating and investing activities. As noted in thechapter, investing activities tend to distort cashflow from operations.(2)The use of net financial items tends to obscuresoperating, investing, and financing activities.Although disclosure is available to facilitate itscalculation, no separate disclosure of actual cashoutflow for interest (financing) costs is provided.(3)The inclusion of financial liabilities (borrowing andrepayment) and financial receivables in liquid fundsdistorts cash flows from both investing and financingactivities. This approach also hampers the analysisof free cash flows discussed in the chapter. It isalso unclear what basis was used by the company toallocate a portion of the financial receivables tooperating activities and the remainder to the netfinancial position category.[Part c is continued on page 17]b. Amounts in millions of Swedish KronorSwedish GAAP U.S. GAAPYears Ending December 31 1999 1998 1999 1998Operating profit 2,615 2,475 N et income 2,287 2,591Noncash items 1,551 1,388 1,551 1,388 Change in working capital (3) 169 (3) 169 Net financial items (206) (137) (137)Paid tax (122) 253 0 253 Cash flow before capital expenditure 3,835 4,148 Operating activities 3,835 4,148 Capital expenditure (1,988) (2,557) (1,988) (2,557) Change in financial receivables (3,395)Effects from divested activities 3,258 0 3,258 0 Cash flow before dividend 5,105 1,591 Investing activities (2,125) (2,557) Issue of warrants and convertible loan 0 46 0 46 Dividend paid: Ordinary (889) (800) (889) (800)Extra (3,110) 0 (3,110) 0 Change in financial liabilities 2,521 0F inancing activities (1,478) (754)Currency effects (17) (111) E xchange rate effects (17) (111) Change in net financial liability 1,089 726 C hange in cash andmarketable securities 215 726 Closing liquid funds 1,456 1,241Financial receivables 3,395 0Financial liabilities (6,905) (4,384)Cash and marketableNet financial liability (2,054) (3,143)securities:Opening liquid funds 1,241 1,636 B eginning of period 1,241 1,636 Change in liquid funds 235 (463)Currency effects (20) 683-18Closing liquid funds 1,456 1,241 E nd of period 1,456 1,2413-197. c. (continued from page 15)Advantages:(1)The separate display of pre-interest and pre-tax cashflows permits a comparison across companies withdifferent capital structures and tax regimes.(2)Detailed disclosure of investment cash flows(acquisition and other) may facilitate analysis offree cash flows.8.{M}a. Differences between U.S. and IAS GAAP (see text page 98):•IAS GAAP is permissive regarding the classification of interest and dividends received, interest paid, anddividends paid: these cash flows may be reportedeither as components of CFO or CFI (interest anddividends received) and CFF (interest and dividendspaid). Roche classifies interest and dividendsreceived as CFI and interest and dividends paid asCFF.•Bank overdrafts may be reported as components of cash and cash equivalents in IAS GAAP; the change in bankoverdrafts would not be reported as part of thestatement of cash flows. U.S. GAAP requires theirclassification as liabilities and therefore, ascomponents of financing cash flows. Roche footnote24 indicates that overdrafts are reported asshort-term debt but is unclear as to how changes arereported in the cash flow statement.•Companies using IAS GAAP and the direct method are not required to report the reconciliation from net incometo CFO.b.Cash flow statement on page 18.Note that conversion to SFAS 95 results in only a smalldifference in CFO as the classification differenceslargely balance. However both CFF and (especially) CFI arequite different (both level and trend). The majordifference is that the large 2000 investment in marketablesecurities is shown as a CFI outflow under IAS 7 but anincrease in cash and marketable securities under SFAS 95assuming that the marketable securities would beconsidered cash equivalents under US GAAP. Roche footnote19 contains general information about its marketablesecurities, but not enough detail to determine whichinvestments would be considered cash equivalents.b. Roche cash flow statement: IAS and US GAAP 1999 2000Amounts in CHF Millions IAS 7 SFAS 95 IAS 7 SFAS 95 Operating profit* 6,421 6,421 7,131 7,131 Depreciation and amortization 2,453 2,453 2,848 2,848 EBITDA 8,874 N.R. 9,979 N.R. Genentech transactions (1,550) (1,550) (3,791) (3,791) Other non-cash transactions 619 619 (90) (90) Other (3,598) (3,598) (2,549) (2,549)Interest paid (686) (902) Interest and dividends received 459 743 Increase in working capital (2,618) (2,618) 367 367 Cash from operations 1,727 1,500 3,916 3,757 Financing transactions 541 541 (801) (801) Interest and dividends paid (1,436) (1,737)Dividends paid - (750) - (835) Cash from financing activities (895) (209) (2,538) (1,636) Capital expenditures, investments and divestitures (906) (906) 1,921 1,921Interest and dividends received 459 - 743Change in marketable securities (420) - (3,496) - Cash from investing activities (867) (906) (832) 1,921 Net effect of currency translation on cash 103 103 (36) (36) Increase (decrease) in cash 68 510 Increase (decrease) in cash and mkt. secs. 488 4,006Note: Row headings that are right justified apply to SFAS 96 amounts.*Actually funds from operationsN.R. Not required by US GAAP, but sometimes disclosed3-21c. Advantage: IAS recommends separate disclosure of cashoutflows for maintenance expenditures and capital expenditures for growth; when available that can be a significant benefit.Disadvantages:(1)Available alternatives for the treatment of interestand dividends received, interest paid, and dividendspaid (see answer to part a) may distort CFO, CFI, andCFF and hamper comparisons with companies using USGAAP or (for companies using IAS GAAP) choosingdifferent alternatives.(2)For companies using the direct method, when thereconciliation from net income to CFO is not reportedit is impossible to determined whether changes inoperating assets and liabilities (e.g. inventory)are due to operating or other factors.。
财务报表分析 英文

Financial Statement AnalysisIntroductionFinancial statement analysis is a crucial tool for assessing the financial performance and stability of a company. By analyzing a company’s financial statements, investors and other stakeholders can gain insights into its profitability, liquidity, solvency, and overall financial health. This document provides an overview of financial statement analysis, including the different types of financial statements, key financial ratios used in analysis, and the importance of using a systematic approach for analyzing financial statements.Types of Financial StatementsFinancial statements are a collection of reports that provide a snapshot of a company’s financial position and performance over a specific period. The three main types of financial statements include:1. Balance SheetThe balance sheet is a statement that shows the financial position of a company at a given point in time. It provides information about a company’s assets, liabilities, and shareholders’ equity. The balance sheet is divided into two main se ctions: the left side shows the company’s assets, while the right side shows its liabilities and shareholders’ equity.2. Income StatementThe income statement, also known as the profit and loss statement, reports a company’s revenues, expenses, and net in come over a specific period. It provides insights into a company’s profitability and helps identify trends in its revenue and expenses. The income statement follows a simple equation: revenues minus expenses equal net income.3. Cash Flow StatementThe cash flow statement shows the inflows and outflows of cash in a company over a specified period. It provides information about a company’s operating, investing, and financing activities. The cash flow statement helps assess a company’s ability to generate cash and its liquidity.Key Financial RatiosFinancial ratios are used to analyze the relationships between different items in a company’s financial statements. They help evaluate a company’s financialperformance, efficiency, liquidity, and solvency. Some key financial ratios used in financial statement analysis include:1. Profitability RatiosProfitability ratios measure a company’s ability to generate profits. Common profitability ratios include gross profit margin, operating profit margin, and net profit margin.2. Liquidity RatiosLiquidity ratios assess a company’s ability to meet its short-term obligations. These ratios include the current ratio and quick ratio.3. Solvency RatiosSolvency ratios evaluate a company’s long-term financial stability and ability to meet its long-term obligations. Examples of solvency ratios include the debt-to-equity ratio and the interest coverage ratio.4. Efficiency RatiosEfficiency ratios measure a company’s ability to utilize its assets and resources effectively. Examples include the inventory turnover ratio and the accounts receivable turnover ratio.Systematic Approach for Financial Statement AnalysisTo conduct an effective financial statement analysis, it is important to follow a systematic approach. The key steps in this approach include:1. Gathering Financial StatementsCollect the company’s financial statements, including the balance sheet, income statement, and cash flow statement.2. Analyzing Financial RatiosCalculate the relevant financial ratios and analyze them to assess the company’s financial performance and condition.3. Comparing RatiosCompare the calculated financial ratios with industry averages or with the company’s historical performance to identify trends and benchmark the company’s performance.4. Conducting a Trend AnalysisAnalyze the company’s financial statements over multiple periods to identify any significant changes or trends in its financial performance.5. Making Informed DecisionsBased on the analysis of the financial statements and ratios, make informed decisions about the company’s financial health, investment potential, and future prospects.ConclusionFinancial statement analysis is an important tool for assessing a company’s financial performance and stability. By analyzing a comp any’s financial statements and calculating key financial ratios, investors and stakeholders can make informed decisions about the company’s financial health, stability, and investment potential. Following a systematic approach for financial statement analysis ensures a comprehensive evaluation and helps identify trends and benchmarks for comparison.。
上市公司财务报表名词(s)
10资本结构:指企业各种长期筹资来源的构成和比例关系,即长期资本和长期债务的比例关系
11经营周期:即营业周期。指从取得存货开始到销售存货并收回现金为止的时期。
12资产负债率:是全部负债总额除以全部资产总额的百分比,也就是负债总额与资产总额的比例关系,又称为债务比率。
13现金流量表:是反映企业在一定会计期内有关现金和现金等价物的流入和流出信息的报表。
67利息保障倍数:又称利息倍数,是企业息税前利润与所支付的利息费用的倍数关系。
8制造费用:是产品生产企业为生产产品或提供劳务而发生的各项间接性的生产耗费。
ቤተ መጻሕፍቲ ባይዱ
9杜邦财务分析体系:简称杜邦体系,又称杜邦分析法,是利用各主要财务比率指标间的内在联系,对企业财务状况及经济效益综合系统分析和评价的方法。该系统是以股东(所有者)权益报酬率为龙头,以总资产利润率为核心,重点揭示企业获利能力及其前因后果。
3营运资金:是指一定时期内企业的流动资产超过流动负债的部分。一般而言,营运资金为正数,表明企业的流动负债有足够的流动资产作为偿付的保证;反之,则意味偿债能力不足。
4资产的流动性:是指企业资产变换为现金的速度(或能力),是资产一个重要特性。资产的流动性与资产的风险性及其收益性均具有密切的联系。
1权益乘数:所有者权益比率的倒数,称作权益乘数,即企业的资产总额是所有者权益的多少倍。该乘数越大,说明投资者投入的一定量资本在生产经营中所运营的资产越多。
2总资产周转率:是指企业产品或商品销售收入净额与资产总额的比率,即企业的总资产在一定时期内周转的次数,总资产周转率是反映企业的总资产在一定时期内创造了多少销售收入或周转额的指标。
14经济增加值:可以定义为企业收入扣除所有成本(包括股东权益的成本)后的剩余收益,在数量上它等于息前税后营业收益再减去债务和股权的成本。
基于战略视角的S公司财务报表分析

基于战略视角的S公司财务报表分析一、本文概述随着全球经济的快速发展和市场竞争的日益激烈,财务报表分析已经成为企业战略管理不可或缺的一部分。
本文旨在通过深入分析S 公司的财务报表,从战略视角出发,探讨其财务状况、经营绩效以及未来发展潜力。
通过这一分析,我们将揭示S公司在市场竞争中的地位,以及其在财务战略和管理方面的优势与不足。
本文将首先概述S公司的基本情况,包括公司规模、业务范围、市场定位等。
然后,我们将重点分析S公司的财务报表,包括资产负债表、利润表和现金流量表等。
通过对这些报表的详细解读,我们将深入了解S公司的资产结构、盈利能力、偿债能力以及现金流状况。
在战略视角下,我们将进一步探讨S公司的财务战略选择及其对公司发展的影响。
我们将分析S公司如何通过财务战略优化资源配置、提升竞争力,以及应对市场变化和风险挑战。
我们还将关注S公司在财务管理方面的创新实践和潜在改进空间。
通过本文的分析,我们期望为S公司的管理层和投资者提供有价值的参考信息,帮助他们在制定财务战略和做出决策时更加明确方向、把握重点。
本文也旨在为其他企业提供财务报表分析的范例和启示,推动更多企业从战略视角审视自身的财务状况和发展潜力。
二、财务报表分析的理论基础财务报表分析是一种系统的方法,通过对企业的财务报表(如资产负债表、利润表、现金流量表等)进行深入研究,从而评估企业的财务状况、经营成果和现金流量情况。
这种分析不仅有助于投资者做出明智的投资决策,还有助于企业内部管理人员了解企业的运营效率和存在的问题。
财务报表分析的理论基础主要建立在财务比率分析、趋势分析、比较分析和结构分析等多个方面。
财务比率分析通过计算各种财务指标的比率,如流动比率、速动比率、负债比率等,来评估企业的偿债能力、营运能力和盈利能力。
趋势分析则通过对比企业连续多个会计期间的财务数据,揭示企业财务状况和经营成果的变化趋势。
比较分析则是将企业的财务数据与行业平均水平或同行业其他企业进行比较,以评估企业在行业中的竞争地位。
- 1、下载文档前请自行甄别文档内容的完整性,平台不提供额外的编辑、内容补充、找答案等附加服务。
- 2、"仅部分预览"的文档,不可在线预览部分如存在完整性等问题,可反馈申请退款(可完整预览的文档不适用该条件!)。
- 3、如文档侵犯您的权益,请联系客服反馈,我们会尽快为您处理(人工客服工作时间:9:00-18:30)。
影响变现能力的其他因素
增强变现能力的因素: 1.可动用的银行贷款指标 2.准备很快变现的长期资产 3.偿债能力的声誉
第3章财务报表分析s
一、企业偿债能力分析
(二)长期偿债能力分析
企业的资本结构和财务杠杆与其筹资方式 有关,合理的债务融资有助于提高企业的 税后利润,但过多的依靠债务资金,也会 增加企业的财务风险。因此,这类指标主 要反映企业的长期偿债能力及财务风险的 程度。
第3章财务报表分析s
三、财务分析的基础——基本财务报表
(一)资产负债表 资产负债表:以“资产=负债+所有者权益”为平衡关
系,反映企业在某一特定日期的财务状况 的报表。 (二)利润表 利润表:反映企业某一会计期间财务成果的报表。 (三)现金流量表 现金流量表:反映企业在一定会计期间现金流入与流 出情况的报表。 现金流量表中的现金指的是货币资金和现金等价物。
二、企业营运能力分析(资产管理水平 比率)
营运能力也称为资产管理能力(效率), 反映企业资金周转状况。
资产管理水平比率是用来衡量公司在资 反产映管营理运方能面力指效标率注的意财分务子与比分率母。的这可比一性类,
指标主要通过对企业资产周转情况的分 析,评价企业各项资产的利用水平和营 运效率。
第3章财务报表分析s
权益乘数 =资产总额/(资产总额-负债总额) =1÷(1-资产负债率)
资产负债率越高,权益乘数越大,产权比率越 高,企业的财务风险就越大; 在计算时分子分母可采用平均数:
(年初数+年末数)/2
第3章财务报表分析s
4.有形净值负债率 有形净值负债率是指负债总额与有形净值的比率。
反映债权人债务在破产清算时有多少有形资产保 障
产权比率=负债总额 / 股东权益总额
第3章财务报表分析s
3. 权益乘数(净值比率) ——股权比率的
倒数
反映了企业资产中有多少是所有者投入的 资产,资产总额是所有者权益的倍数。
权益乘数
1 股权比率
资产总额 股东权益总额
第3章财务报表分析s
权益乘数 =(股东权益+负债总额)/股东权益 =1+产权比率
=360/应收帐款周转次数 =应收帐款平均余额×360/赊 销收入净额
第3章财务报表分析s
(二)存货周转率 企业一定时期的销货成本与平均存货的比率,
也称为存货周转次数,反映的是存货周转速 度的快慢。 存货周转率(次数) =营业成本/平均存货余额 (存货周转率=营业收入/平均存货余额)
流动比率=流动资产/ 流动负债 一般认为,流动比率在2:1左右较合适。
第3章财务报表分析s
(净)营运资本(营运资金)
营运资本=流动资产-流动负债 =(总资产-非流动资产) -(总资产-股东权益-非流动负债) = (股东权益+非流动负债) - 非流动资产 =长期资本-长期资产
➢ 营运资本实际上是相当于长期资本来源大于 长期资产占用的差额,这部分差额等同于用 于了企业日常的短期的经营活动。
第3章 财务报表分析
• 第一节 财务报表分析概述 • 第二节 财务比率分析 • 第三节 财务报表分析的方法
第一节、财务报表分析概述
一、什么是财务报表分析: (见 P.42) 二、财务报表分析的目的:
了解过去 评价现在 预测未来 (一)评价企业的偿债能力 (二)评价企业的资产管理水平 (三)评价企业的获利能力 (四)评价企业的发展趋势
影响长期偿债能力因素:
(1)
资本结构;(2) 获利能力。
第3章财务报表分析s
一、企业偿债能力分析
(二)长期偿债能力分析
1.资产负债率(负债比率):企业负债总额与
资产总额的比率。反映了在总资产中有多大比例是
通过借债来筹资的,也可以衡量企业在清算时保护债
权人利益的程度。
资产负债率
负债总额 资产总额
100%
第3章财务报表分析s
第二节 财务比率分析
一、偿债能力分析 偿债能力:指企业偿还各种到期债务的能力。 (一)短期偿债能力分析 (变现能力分析) 企业偿还流动负债的能力,是企业的流动资
产对流动负债及时足额偿还的保证程度。企 业的短期偿债能力取决于流动资产的流动性. 1.流动比率:流动资产与流动负债的比值。
利息保障倍数
费用化利息
费用化利息+资本化利息
=(利润总额+利息费用)/利息费用
*息税前利润=利润总额+利息费用 净利润=利润总额-所得税
税后利润 税前利润
第3章财务报表分析s
(三)影响企业长期偿债能力的其他因素 1.或有负债 2.担保责任 3.租赁活动 4.可动用的银行贷款指标 5.偿债声誉
第3章财务报表分析s
➢ 营运资本越大,企业的短期偿债能力越强。 ➢ 营运资本是绝对数,不便于不同企业之间比较。
第3章财务报表分析s
பைடு நூலகம்
2.速动比率(酸性测试比例): 公司的速动资产与流动负债的比值。 速动比率=速动资产 / 流动负债 =(流动资产-存货)/流动负债
将存货从流动资产中剔除的原因: (1)存货变现速度慢; (2)存货已损失,但没处理; (3)部分存货抵押给债权人; (4)存货估价还存在着成本与合理市价 相差悬殊的问题。
资产负债率比率越小,说明企业偿还债务的能 力越强;反之,则越差。
第3章财务报表分析s
2.产权比率(负债股权比率、权益负债率) 产权比率:负债总额与股东权益总额的比值, 是衡量财务结构是否稳健的重要指标。 产权比率反映了债权人所提供的资金与股东所 提供的资金的对比关系,也是衡量公司破产清 算时对债权人利益的保护程度。
有形净值负债率=负债总额/有形净值 =负债总额/(所有者权益-无形资产)
此指标越低越好。 包括递延资产,商誉等
第3章财务报表分析s
5. 利息保障倍数(已获利息倍数) 企业息税前利润与利息费用的比值
反映公司盈利支付债务利息的能力,用以 衡量偿付借款利息的能力
利息保障倍数
息税前利润 利息费用
第3章财务报表分析s
(一)应收帐款周转率 是应收账款总额在一年内按平均额收回
的次数。它等于企业在一定时期(年) 的赊销收入净额与应收帐款平均余额的 比值,反映应收帐款的周转速度。 应收帐款周转率(次数)
=赊销收入净额 / 应收帐款平均余额
第3章财务报表分析s
用时间表示的应收帐款周转速度是 应收帐款周转天数(应收帐款平均回 收期),表示企业从取得应收帐款的 权利到收回款项转换为现金所需的时 间。 应收账款周转天数(平均收现期)