ArcIMS使用说明
IMS-A系列伺服控制器使用说明书(详细)

前言欢迎使用时光科技有限公司的产品IMS-A系列伺服控制器。
IMS-A系列伺服控制器能灵活地实现对交流异步电动机的高性能控制。
本使用说明书叙述了IMS-A系列伺服控制器(0.2kW~160kW)的安装、配线、运行、维护、保养及检查等内容。
使用前,请认真阅读本使用说明书,特别请熟知本产品的安全注意事项。
本使用说明书的示图,仅用于事例说明,与供货产品可能会有所不同。
因产品改进,规格、编写版本的变更等原因,本使用说明书会有适当的改动。
与安全有关的符号说明本说明书中与安全有关的内容,使用了下述符号。
标注了安全符号的语句,所叙述的都是重要的内容,请一定要遵守。
重要!!某些虽不属于「危险」「注意」的范围,但要求用户遵守的事项时,使用该标注。
表示禁止的事项时,使用该标注。
禁止所叙述的内容在使用中发生错误时会引起危险、可能会造成人员轻度或中度的伤害和设备损坏时,使用该标注。
虽是注意的事项,由于情况不同,也可能造成重大事故。
所叙述的内容在使用中发生错误时会引起危险、可能会造成人身伤亡时,使用该标注。
! 危险安全注意事项●开箱检查●安装●配线●配线●运行保养与检查目录第1章概要 (9)1.1产品的技术特点 (9)1.2产品型号 (9)1.3伺服控制器标准规格 (10)1.4制动电阻规格 (12)1.5伺服控制器各部分名称 (14)1.6关于数字操作器 (15)1.7关于键盘显示器 (15)第2章外形与安装 (16)2.1开箱检查 (16)2.1.1铭牌说明 (16)2.1.2铭牌举例 (16)2.2IMS-A系列控制器外形与安装尺寸 (17)2.3安装场所的要求 (21)2.3.1安装场所 (21)2.3.2环境温度 (21)2.3.3环境湿度 (21)2.3.4振动 (21)2.3.5安装时防止异物落入 (21)2.4安装方向与空间 (22)2.5数字操作器(DOPE-43型)的外形与安装尺寸 (25)第3章配线 (26)3.1与周边设备的连接 (27)3.2主回路端子 (28)3.2.1主回路端子台的构成 (28)3.2.2主回路端子的功能 (29)3.2.3电线线径与压线端子 (29)表3.2 圆形压线端子的尺寸 (29)3.3主回路接线 (31)3.3.1主回路构成 (31)3.3.2标准接线图 (35)3.3.3主回路的接线方法 (36)3.4控制回路端子 (42)3.4.1I/O接口端子及压线端子说明 (42)3.4.2双码盘控制板接口分布及端子定义 (43)3.4.3单码盘控制板接口分布及端子定义 (44)3.4.4接口定义 (46)3.4.4.1输入接口 (46)3.4.4.2输出接口 (47)3.4.4.3编码器信号 (48)3.4.4.4单向脉冲列信号 (48)3.4.4.5模拟量信号 (49)3.4.4.6通讯信号 (49)3.5控制板上的跳线,拨码开关和接口 (51)3.5.1各个跳线、拨码开关和接口在控制板上的分布 (51)3.5.2跳线说明 (52)3.5.2.1JP1、JP2跳线说明 (52)3.5.2.2SW1跳线说明 (52)3.5.2.3SW2跳线说明 (53)3.5.2.4SW3跳线说明 (53)3.6J232通讯接口说明 (53)3.6.1J232接口定义 (54)3.6.2操作器延长线制作方法 (54)3.6.3PC通讯线制作方法 (54)第4章数字操作器(DOPE-43型)的使用 (55)4.1面板说明 (55)4.2操作键说明 (56)4.3显示模式的种类 (57)4.4显示模式的切换 (57)4.5运行状态监视模式下监视项的切换 (58)4.5.1监视项Fr说明 (59)4.5.2监视项U1说明 (60)4.5.3监视项U2说明 (60)4.5.4监视项C1说明 (60)4.6指示灯说明 (61)4.6.1SEVCC(电机通断电指示灯) (61)4.6.2CCW(输出频率为正方向指示灯) (61)4.6.3CW(输出频率为反方向指示灯) (61)4.6.4ALM(报警指示灯) (61)4.6.5USER(用户参数编辑指示灯) (61)4.6.6SYS(系统参数编辑指示灯) (61)4.6.7RUN、STOP、CMD、Hz、F1、JOG、CCW/CW指示灯 (62)4.7参数编辑模式下的参数修改与设定 (62)4.7.1系统参数No.0~No.3(4字节)的显示说明 (64)4.7.2故障历史信息的查询 (64)4.8操作器故障报警信息与复位 (65)第5章运行 (66)5.1IMS-A系列伺服控制器的程序 (67)5.1.1QMCL程序的编制 (67)5.1.1.1IMS-A系列伺服控制器通用标准程序 (67)5.1.1.2IMS-A系列伺服控制器非通用标准程序 (68)5.1.2QMCL程序的写入 (68)5.1.3QMCL程序与参数的调出与固化 (69)5.1.3.1ROM中QMCL程序或参数调出到RAM中的方法 (69)5.1.3.2RAM中QMCL程序或参数固化到ROM中的方法 (72)5.1.4QMCL程序的运行选择 (72)5.1.5QMCL程序运行的起动 (73)5.2IMS-A系列伺服控制器的运行 (74)5.2.1电机运行前的注意事项 (74)5.2.1.1编码器(PG)的输入脉冲确认 (74)5.2.1.2确认控制器输出与电机的接线相序 (75)5.2.2试运行 (75)5.2.3控制器程序运行时的注意事项 (76)第6章故障分析 (77)6.1控制器故障时的显示 (77)6.2常见故障内容、原因和对策 (77)6.3故障复位 (79)6.4故障分析 (79)6.5故障的防止及安全 (83)6.5.1故障的防止 (83)6.5.2关于安全 (84)第7章故障与检查 (86)7.1RAM的掉电保护电池 (87)7.2保养与检查 (87)7.2.1日常检查 (87)7.2.2定期检查 (88)7.2.3部件的定期保养 (89)第1章概要IMS-A系列伺服控制器是时光科技有限公司最新推出的全数字化交流异步电动机伺服控制器,具有结构紧凑、使用方便、可靠性高的优点,适用于各种高精度控制的场合。
第六讲 ArcIMS的学习

第四步 为软件授权。在此步的对话中,向导为用户 提供了两种软件授权方法: <!--[if !supportLists]-->A. <!--[endif]-->如果 你有授权文件存在于磁盘,请选择第一项; <!--[if !supportLists]-->B. <!--[endif]-->如果 你只有授权码,需要手工输入,请选择第二项。 在此我们选择第二项手工输入授权码,并点击 “下一步(N)”继续安装。
第三步 ArcIMS安装要求说明对话。在此对话框中,主 要说明了安装所必须的主要程序,像Web Server和 Servlet引擎等。单击Next进行下一步。
第四步 选择ArcIMS组件。根据需要在下面的对话框中选择所需要 的组件,这里保留默认选择。在此对话框中,你可以修改通过 点击Browser按钮选择ArcIMS9.2的安装目录。单击Next进行下 一步。
第五步 授权完成对话
此对话列出了此授 权文件所授权的 组件,在此只有 一个,即 arcimsserver。如 果你的授权文件 中包含多个ESRI 组件的授权码, 则在授权功能列 表中会出现多项。 点击“完成”按 钮继续安装。
第六步 设置Website和Output目录。Website 目录用来存贮ArcIMS地图服务的Web页面, Output是ArcIMS服务的软件目录。如果你想为 ArcIMS配置多个空间服务器,则需要复选 “Create an network share to support multiple…”项,在此我们不选择此项,并将 Website目录和Output目录定位在 E:\Temps\testims。并点击“下一步(N)”继续 安装,此时开始创建目录和所需文件。
第五步 安装目录选择对话框,点击Browse按钮 更改安装目录,并点击下一步继续安装。
IMS三坐标测量机操作手册

图1
图2
图3
3.进入Virtual DMIS软件
(1) : 在Virtual DMIS软件主画面上点选 图示, 将CMM归到机械原点。
(2) :校正测针:点击图示 从对应的网络盘打 开自动校正测针程序,打开后,请选中程序最 前列。然后在点击图示 按扭,当前界面提 示, 在校正标准球球心正中央打点(如下图 4)直接按OK(如下图5),然后出现对话框(图 6)按照所提示的角度转针,直到测针程序运 行完后。
IMS操作说明
1.设备规格 (1)仪器名称:IMS 。 (2)仪器型号:Impact600 。 (3) 测量范围 : X=500mm Y=600mm
Z=400mm。 (4)空间精度 : 4.0+L/300μm。 (5)最大载重量 : 2000Kg。 (6)电源 : 220V ±10%,接地电阻小于4Ω 。 (7)气源 : 空气压力0.45Mpa~0.60Mpa。
图11 图12
图13 图14
B:选择 图示用两个圆元素拟合一条线(图15).
C:在选择 图示,点击 弹出对话框(图16), 选择基准建立的元素,移入对话框,然后点击 APPLY.
图15
图16
D:测量附图上29号尺寸,在Virtual DMIS软件 主画面选择点元素测量工具,出现对话框(图17), 使用操纵盒控制测头进行测量点PT1(图18), 在测量点PT2(图19)。点击 ,选择 出现对话框
标准球 图5
图4 图6
4.测量步骤
(1)新建测量界面
选择Project,点击New,出现对话框(图 7)。输入测量名称,取消清空测头数据选项, 选择当前坐标系为MCS,选择测头角度 DEFAULT,根据测量图面规定选择测量数据单 位与角度单位,点击Apply。
ArcIMS4[1].0.1安装文档
![ArcIMS4[1].0.1安装文档](https://img.taocdn.com/s3/m/ae4b80b2fd0a79563c1e7294.png)
ArcIMS4.0.1安装文档一. 验证安装ArcIMS站点的系统需求1.硬件配置(1)内存需求·Web Server/Manager:256MB·ArcIMS Spatial Server:256MB/CPU·ArcIMS Application Server:256MB·HTML Viewers:64MB·Java Viewers 和 ArcExplorer—Java Edition:128MB·所有组件:256MB/CPU(2)磁盘空间·典型安装:478MB(NTFS)或505MB(FAT)·完全安装:827MB(NTFS)或864MB(FAT)2.系统软件(1)操作系统:Windows NT(SP 6a) Windows 2000 Windows XP(2)Web服务器:Microsoft IIS服务(3)Servlet engine:J2SE JRE 或J2SE SDK 1.3.1或更高版本二. 设计ArcIMS站点的结构ArcIMS软件具有创建地图、开发用来和地图交流的WEB页、管理ArcIMS站点等功能。
一个ArcIMS站点由一台或多台计算机组成,包括ArcIMS主机(ArcIMS Manager、Application Server Connectors和ArcIMS Application Server)、ArcIMS Spatial Server、data reside、Web服务器、J2SE JRE以及Servlet Engine。
基于同时访问站点的用户数量和每天产生的地图数量,决定了ArcIMS站点结构具有以下几种形式:1.ArcIMS站点在一台计算机上在安装ArcIMS之前,ArcIMS站点必须有一个Web服务器,并且能和Servlet Engine 通信。
将整个ArcIMS站点安装在一台计算机上是一种典型安装,这种典型安装将安装Manager、ArcIMS Application Server、默认的ArcIMS Application Server Connector (Servlet Connector)和ArcIMS Spatial Server,此外还将安装Metadata浏览器、一些选择的实例和文档。
ARCGIS常用操作

1. 要素的剪切与延伸实用工具TASK 任务栏Extend/Trim feature 剪切所得内容与你画线的方向有关。
2. 自动捕捉跟踪工具点击Editor工具栏中Snapping来打开Snapping Environment对话框捕捉设置中有3个选项, vertex edge end 分别是节点、终点、和边,选择end应该会捕捉端点3. 图斑面积计算及长度计算应用工具CALCULATE AREA 或者使用VBA代码实现新建字段并开启Advanced 写入代码,面积计算:Dim Output as doubleDim pArea as IareaSet pArea = [shape]在最后的一个空格里面写入代码(即:字段名)pArea.area长度计算:Dim Output as doubleDim pCurve as ICurveSet pCurve = [shape]Output = pCurve.Length4. 剪切图斑T ask任务栏cut polygon feature工具,需要sketch工具画线辅助完成5. 配准工具Spatial Adjustment 工具需要注意先要set adjustment data 然后配准6. 影像校正Georeferncing工具7. 要素变形T ask 工具条中的reshape feature 配合sketch工具8. 添加节点Modify feature 在需要加点的地方右键单击insert vertex也可单击右键选择properties 打开edit sketch properties对话框,在坐标点位置右键插入节点9. 共享多边形生成Auto-complete polygon 工具生成共享边的多边形,配合snapping environment更好。
10. 画岛图1).使用任务栏中的sketch工具,当画完外面的一圈时,右键选择finish part 然后画中间的部分再右键finish sketch2).分别画连个图斑然后应用Editor 工具栏中的工具先intersect(图斑重叠的地方创建一个新的图斑)然后Clip(剪切)即可。
Arcgis操作手册

1 ArcGIS 简介1.1 安装说明1.1.1ArcView(单用户使用许可)的安装ArcView(单用户使用许可)即 ArcView-Single Use。
试用版(Evaluation Edition)也属于这种。
这两种软件的安装过程基本相同,只是在注册的时候略有差别。
ArcView 的安装对话框说明了如果在如何您的机器上安装 Arcview,您可以选择安装到本地机器或者安装到网络机器,本向导讨论如何安装到本地机器,如果需要安装到网络机器,请查看相应的文档。
如果需要进行单用户安装,请选择第一个安装选项。
ArcView 的安装包含了可选择的ArcGIS 的扩展和其他模块。
如果需要安装可选模块,在安装的时候请选择 complete 选项或者 custome 选项,complete 选项将安装所有的可选择的模块,custom 允许你选择相应的模块。
有的可选模块需要额外的注册,注册向导将告诉您如何进行注册。
注意:要安装的目标目录不能包含空格。
当 ArcView 安装结束的时候,安装向导会提示您安装可选的模块。
安装向导也会提示您安装例子数据 ArcGISTutorial Data 和 Crystal Reports 9.0。
当所有的模块都安装完成之后,安装向导会提示你进行注册。
在进行注册前,ArcView 将无法使用。
选择一种注册模式,然后注册向导会提示您如何进行注册。
注:1. ArcView 试用版 (EvaluationEdition) 注册时,需输入注册号码(RegistrationNumber),如:EVA881681009;2. ArcView 正式软件注册时,需输入软件锁号 (KeyNumber) ,如KEY3700541(见软件锁上印刷的数字);同时还需要输入序列号,请留意产品的交货单。
1.1.2ArcGIS(浮动使用许可)的安装ArcGIS (浮动使用许可)即 ArcGIS-Concurrent,使用浮动的license。
ArcIMS开发指南精品PPT课件
ArcIMS Spatial Server (空间服务器)
数据存储层 (服务器Server)
图5.1 ArcIMS的多层体系结构
ArcIMS体系结构是可调整的,允许并发 访问和同时处理并发请求。
应用ArcIMS,能够随着时间的推移扩展 服务器,以满足访问用户日益增长的请求。
正是因为ArcIMS结构上的高度可调整性, 因此它对提供小型地图服务的企业和提供大 型地图服务的企业都是很好的选择。
第四章 ArcIMS开发指南
ArcIMS(Internet Map Server)是 ESRI公司最新推出的因特网地理信息系 统平台,用于创作、设计、发布和管理 Internet地图制图的Web GIS应用系统。
ArcIMS提供了多方位的Web GIS解 决策略,应用了Java Applet、Java Servlet、XML等技术,允许网络客户端、 地图服务器、数据服务器和Web 服务器
②.事务逻辑层(Business Logic Tier),即 中间件,由Web服务器、ArcIMS应用服务器 连接器和ArcIMS应用服务器组成。
③.数据存储层(Data Storage Tier),即服 务器端,是指ArcIMS空间服务器和数据源。 ArcIMS的多层体系结构如图5.1所示。
ArcMap 、ArcExplorer、ArcPad ArcIMS浏览器
下面分别从客户端、中间件和服务器3个 方面介绍ArcIMS各层的组成构件。此外,还 将介绍ActiveX和ColdFusion连接器,以及它 们是如何被整合到ArcIMS中的。
1. 客户端
广域网或局域网内的客户端(Client)或 用户终端,是直接或简接与服务器相连的计 算机或应用程序,通过HTTP或TCP/IP协议 与服务器通讯。
ArcIMS

Author2
Part 2
美化工具
General 标签 1.标签中改变图层在用户最终能看到的图层列 表和图例中的名字 2.还可以设置图层显示的比例尺范围. 通过Set Maximum Scale Factor 设置 3.列出了活动图层的基本信息,如源数据的名 称,类型,位置和文件大小等等.
Author2
Author
Part 1 数据管理和显示
启动Author 方法一:直接在程序中打开 方法二:通过Manager打开 区别: Manager中启动的Author可以创建地图服 务,而直接在程序中打开的Author却不行.
Author
Part 1 数据管理和显示——图层管理 图层管理 数据管理和显示
Designer
9.Toolbar Functions面板 10.MapTips面板 11.Stored Query面板
Designer
12.Identify Results面板 13.MapNotes Tool面板 14.EditNotes Tool面板 15.Web Site Location面板
Author
Part 1 数据管理和显示——图层管理 图层管理 数据管理和显示
图层属性管理:
渐变符号法 这种方法使用一系列渐变色或渐变符号 来显示不同的要素类别,适用于显示诸如温 度,人口,年销售量等有一定的变化的数值 或值范围的数据.
Author
Part 1 数据管理和显示——AXl文件 文件 数据管理和显示
Page 7
ArcIMS概述 概述
ArcIMS组成 组成
1.Author
确定使用哪些数据及如何显示 创建和启动地图服务
2.Administrator 3.Designer
ArcIMS 9.2 安装和配置

ArcIMS9.2的安装与配置一、ArcIMS9.2的安装1、双击ArcIMS安装盘的Setup.exe进入安装。
连续点击Next。
2、选中I accept the License Agreement,点击Next。
图 13、选择组件,记住一定要选择Application Server Connector中的Java Connector组件(IMS 9.2没有,直接使用默认选择);选择安装路径后连续点击Next,开始安装。
图 2二、ArcIMS9.2 Post Installation的安装1、安装完成后,进入下图界面,选择默认的Typical方式,连续点击下一步。
图 32、弹出注册对话框,选择“I have received an authorization file from ESRI and am now ready tofinish the registration process.”点击Next。
图 43、选择注册程序IMS9.2 MAY.28,2007 ECP534201827_v92.ecp的路径,点击Next。
图 5 4、注册完成。
图 65、配置ArcIMS的输出工作文件夹路径,这里按默认方式,点击下一步,进入安装状态;图7 6、默认方式,点击下一步;图8 7、默认方式,点击下一步;图98、输入本机管理员(Administrator)的用户名和密码,点击下一步;图109、弹出如下图对话框,选择“I will manually configure my Web server/servlet engi”点击Next后,弹出提示框,点击确定。
图11图12三、ArcIMS9.2 Post Installation的配置1、打开C:\ProgramFiles\ArcGIS\ArcIMS\Documentation\WebHelp\Installing_ArcIMS.htm ,在左边目录选择step4,然后在右边选择weblogic8.1,进行选择后界面如下。
arcgis简单介绍
一、ArcIMSArcIMS作为互联网地图服务器为部门内和部门外众多用户提供动态Web地图和元数据服务。
ArcIMS以在Web上提供高度可伸缩和高效的地图服务而著称。
它是被最广泛应用的GIS服务器。
据估算,已建立的ArcIMS站点使用超过50000个ArcIMS服务,每天提供超过10亿幅地图图片。
通常,ArcIMS的用户通过自己的Web浏览器访问GIS Web服务——例如通过ArcIMS 附带的Web地图应用或通过ArcIMS以前版本中的HTML Viewer和Java Viewer应用。
此外,ArcIMS服务也支持一系列其他客户端的访问,包括ArcGIS桌面,ArcGIS Engine,ArcReader,ArcPad,ArcGIS Server Web地图应用以及许多以XML和OGC WMS进行网络通讯的开放客户端和设备。
ArcIMS还提供元数据浏览应用用来在Web上进行元数据目录查找。
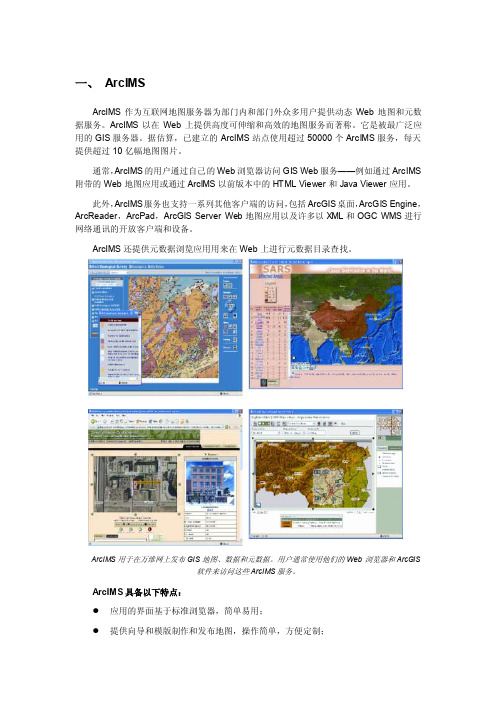
ArcIMS用于在万维网上发布GIS地图、数据和元数据。
用户通常使用他们的Web浏览器和ArcGIS软件来访问这些ArcIMS服务。
ArcIMS具备以下特点:●应用的界面基于标准浏览器,简单易用;●提供向导和模版制作和发布地图,操作简单,方便定制;● 支持高效的大用户量并发访问;● 支持以图像/矢量两种模式,发布高质量的交互式地图; ● 可集成、发布多源数据(网络或本地的不同数据格式); ● 支持元数据发布;●支持多平台运行,如:Windows 、SUN-Solaris (SPARC )、HP-UX (PA RISC )、IBM-AIX 、Linux-RedHat 、Linux-SUSE 。
● 支持多种方式进行二次开发; ● 支持标准的Web Services ; ● 支持负载均衡;● 具备多种保证系统稳定、高效的机制;●支持多种客户端,如:移动设备、桌面软件、标准浏览器、免费客户端软件;● 具有很好的扩展性:使用具有很强升级能力的服务器结构来适应不断增长的服务要求,而无须修改应用软件;1. ArcIMS 的应用ArcIMS 主要用于发布GIS 地图和元数据。
ArcIMS4.0 安装与配置手册

ArcIMS4.0安装与配置手册(整理:冉有华)一、了解ArcIMS架构ArcIMS 运行在一个分布式的环境中由客户端和服务器端的部件组成,服务器部件允许你扩展一个站点使之有提供GIS服务的能力,你的ArcIMS 站点可以提供GIS数据地图以及应用。
用ArcIMS可以设计并制作一个GIS站点,许多客户端的应用能够通过Internet连接到并应用你的站点,这些客户端应用从随ArcIMS带的HTML和Java浏览工具到更高级的ArcGIS Desktop应用。
ArcIMS结构是高度可调整的。
许多用户能够并发进入你的站点,许多请求能够被同时处理。
应用ArcIMS你能够随着时间的推移扩展你的服务器以满足日益增长的请求。
正是因为ArcIMS 的高度可调整性,ArcIMS对那些每天只提供几十个地图的小企业和每天提供成千上万个地图的大企业都是很好的选择。
ArcIMS是一个由客户端部件和服务器端部件组成的分布式系统(如上图)。
客户经过Internet或Intranet服务器向ArcIMS发出请求信息,ArcIMS服务器处理该请求,并将结果返回到客户浏览器。
服务器端部件ArcIMS服务器端部件包括:y ArcIMS空间服务器(ArcIMS Spatial Server)y ArcIMS应用服务器(ArcIMS Application Server)y ArcIMS应用服务器的连接器(ArcIMS Application Server Connectors)y ArcIMS管理器(ArcIMS Manager)ArcIMS空间服务器ArcIMS空间服务器处理对地图及相关信息的请求。
当接收到一个请求后,ArcIMS空间服务器主要执行以下功能:y产生地图影像文件y将地图要素生成矢量流y查询数据库y使用地理编码,执行地址匹配操作y抽取或裁剪数据,返回一个Shape文件格式的数据子集。
ArcIMS监控器(Monitor)和ArcIMS任务分配器(Tasker),作为两个中间进程在后台运行,支持ArcIMS空间服务器。
ArcIMS二次开发(HTML Viewer)
遥感信息工程学院
ArcIMS应用服务器 1.2 ArcIMS应用服务器
ArcIMS应用服务器处理请求的负载平衡,并 且追踪地图服务(MapService)运行在哪 一个ArcIMS空间服务器上。 ArcIMS应用服务器可以将请求传递到一个适 当的ArcIMS空间服务器。 ArcIMS应用服务器是一个基于JAVA的应用, 作为Windows NT的服务或者UNIX的后台 进程存在。 遥感信息工程学院
ArcIMS HTML Viewers: Viewers:
遥感信息工程学院
ArcIMS管理器 3 ArcIMS管理器
ArcIMS管理器是一组非常容易使用的Web页面,提供ArcIMS服 ArcIMS管理器是一组非常容易使用的Web页面,提供ArcIMS服 管理器是一组非常容易使用的Web页面 ArcIMS 务器端所有功能和工具的使用。通过ArcIMS管理器, ArcIMS管理器 务器端所有功能和工具的使用。通过ArcIMS管理器,用户能够快 速设置和管理Internet服务。用户只需学习简单的指导手册,即 速设置和管理Internet服务。用户只需学习简单的指导手册, Internet服务 可制作、设计和发布地图服务。包括三个独立的功能部件: 可制作、设计和发布地图服务。包括三个独立的功能部件:
• 管理你的地图服务
Designer
• 设计你的网站
创建过程如: 创建过程如:单击链接到示例视频 遥感信息工程学院
5 基础技术需求
HTML XML或 XML或ArcXML Javascript Java或 Java或.NET
遥感信息工程学院
内容
ArcIMS 概述 ArcXML基础 使用配置文件(.AXL) Using Render Elements HTML viewer 基本开发过程 ArcIMS应用实例 遥感信息工程学院
ArcIMS

创造和组织一个ArcIMS站点
ArcIMS基于标准的Internet技术,用户可 以用这些技术创建和管理GIS站点。 ArcIMS站点是用标准的HTML和Java工 具创建的,创建的过程和建立一个其他 的网站一样。ArcIMS处理的独特之处在 于给你的网站提供了创作地图的工具。
ArcIMS站点的创作要用到一系列的应用棗 Author,Administrator,和Designer棗或使用 manager,这是一个单独的引导你创作站点的 以向导驱动的应用。 用Author创建你的地图,Designer设计你的网 站,Administrator管理你的地图服务。如果你 想要以一种快速简洁的方式创建站点,你可以 用Manger在向导的指引下完成上面的三个工作。
HTML viewer
HTML viewer用来获取基于图象的地图和表格 数据。这是一个轻量级的浏览工具棗最简单最 快的ArcIMS viewer。你可以通过一套简单但功 能强大的工具来和地图和属性交互。HTML viewer可以嵌入到任何HTML站点来给你的用 户提供动态的,集中的,互动的地图服务。这 种Viewer给了站点管理员更多的控制。 HTML viewer不支持一些GIS工具,也不支持 和本地数据的集成。尽管HTML viewer是一个 轻量级的客户端,它支持最广泛的浏览器并有 着高度的可定制性。
网站创建的过程
选择服务器 确定客户端应用需求 数据来源:生成axl文件 启动GIS服务器 根据用户需求对客户端和服务器端开发 发布
WebGIS网站创建演示
ArcIMS的优势
扩展你的GIS。ArcIMS包括了一套能免 费分发给你的用户的HTML和Java浏览 工具,这些浏览工具提供了非常好的GIS 功能。通过在Internet上散布GIS数据和 服务可以使你同时满足多个用户的GIS请 求。
阿迈克·爱森森自动化解决方案产品介绍说明书

REAL TIME ELECTRONIC GAS MEASUREMENTAl MajekEmerson Automation SolutionsIntroductionThe measurement of oil & gas production has progressed considerably since the days of paper charts and manual integration. Technology has moved increasingly to microprocessor based flow computers allowing for greater measurement accuracy, increased control functionality, and ready integration into a company’s enterprise computer networks.Figure 1: Typical Flow Computer ConfigurationsBackgroundPrior to using computerized electronics, measurement was (and still in use today) based upon ink pen mechanical chart recorders. Unless in a plant, operators drove to facilities on a frequent basis to change charts and transport them to an office for integration.Figure 2: Charts and IntegrationAs shown in Figure 2, a common chart system would use a sixteen day chart, picked up on a regular basis, turned over to a person for integration, and ending with monthly reports issued to the customer.In the early stages of Electronic Flow Measurement (EFM), a flow computer simply interfaced with the three primary inputs (Pressure, Delta Pressure, and Temperature) required for gas measurement and duplicated the chart recorder's measurements.Figure 3: Orifice Primary Meter and P, DP, and T TransmittersDifferential pressure, static line pressure, and the meter temperature were typically acquired from an analog 4-20 ma or 1-5 volt transmitter, digitalized via an A/D convertor, and read into the flow equation. These transmitters had to typically be bench-calibrated and spanned using test equipment, electronic meters, and power supplies. The device was usually spanned to a range required for the particular application and matched to an appropriate electronic signal such as 4 ma for zero, and 20 ma for full span. Once the devices were bench-calibrated, they were taken to the field and installed on the meter. Calibration was then performed with the electronics of the meter so that 0 read 0 and full span read 100% in the meter. This calibration was recorded in the Meter History for archive purposes. As technology improved, the sensors advanced to converting the actual pressure or temperature measurements to a digital signal that could be read directly by a microprocessor-based flow computer.Data was periodically stored in a database for retrieval and recalculation should the need arise; flow computers typically hold up to 35 days of data. Drive-by data acquisition (reference figure 4) was commonly done.Figure 4: Collection of measurement data via a PC or hand held deviceAccuracyThe most driving factor behind EFM from the inception of the technology has been applications involving Custody Transfer. Custody Transfer locations are the cash registers of the industry. Accurate measurements are required to meet contractual requirements between companies or common carriers such as pipelines. These measurements are often required to be implemented by local government entities for tax purposes. Therefore, for Custody Transfer it’s all about accuracy. Charts at their best could achieve +/- 0.5% accuracy for measurement of the primary variables. Then chart integration accuracy would have to be factored in. Since this was usually a manual operation, results differed depending upon the person involved. By comparison, measurement of variables by a flow computer is typically +/- 0.1% and better. Once digitized, all calculations are performed based upon published industry standards resulting in highly accurate and repeatable results.StandardsIn the gas industry virtually all calculations meet standards set by the American Gas Association (AGA) and the American Petroleum Institute (API). For the US market, these standards include:AGA Report No. 3, Orifice Metering of Natural Gas Part 3: Natural Gas ApplicationsAGA Report No. 7, Measurement of Natural Gas by Turbine MeterAGA Report No. 8, Compressibility Factor of Natural Gas and Related Hydrocarbon GasesAGA Report No. 9, Measurement of Gas by Multipath Ultrasonic MetersAGA Report No. 10, Speed of Sound in Natural Gas and Other Related Hydrocarbon GasesAGA Report No. 11, Measurement of Natural Gas by Coriolis MeterAPI MPMS Chapter 21.1: Flow Measurement Using Electronic Metering Systems - Section 1: Electronic Gas MeasurementStandards serve three purposes:Define the best practices of industry.Allow buyers and sellers to refer to standards and not include all details in procurement documents.Enable two separate measurement equipment operating at separate locations and receiving the same inputs to yield virtually identical results.EvolutionWith increasing awareness of the additional horsepower of a flow computer and its ability to perform complex tasks, usefulness of these devices gained speed.Measurement inputs proved only the beginning of handling a vast array of input/output signals used at measurement locations.The desire for more functionality quickly led to greater diversity in field I/O requirements. Metering moved from “simple to understand” analog inputs towards digital RS485 multi-drop communications with digital multivariable sensors. These are typical of most modern flow computers. Such communications involve the reading and writing of data to the transmitters. No longer would just measuring a voltage be enough. Digital communications require a bit more sophistication to diagnose and troubleshoot,therefore, new methods of verifying and troubleshooting had to be acquired. Computer software programs, for example, greatly aid in reading diagnostics of the device.More devices such as turbine meters, ultrasonic meters, and coriolis meters came into play. These produced frequency pulses to pulse counters. The flow computer would perform the appropriate AGA7/AGA 9/AGA11 calculations and archival of the pulse input data along with the pressure and temperature readings.Other advanced applications make use of discrete inputs for other device status inputs, analog outputs for remote set point signals, outputs proportional to flow signals for external devices, and specialized digital communications to many kinds of devices and locations. Systems are increasing showing up with Ethernet ports for local or wide area communications for purposes of local configuration, short haul local device communications, and SCADA (Supervisory Control and Data Acquisition) telemetry.In short, the I/O has expanded to encompass discrete inputs, discrete outputs, analog inputs, analog outputs, pulse input counters, RTD inputs, thermocouple inputs, RS485/RS232 serial communications, HART protocols, and general purpose Ethernet ports.Power ConcernsAs these new features are added to the flow computer, one must consider the total power load in sizing the power system. Oftentimes, flow computers in a gas field will be solar powered making power consumption a critical issue. Communications can be the single greatest power load on the system. The power draw from the communication device must be considered along with the polling load. Systems all too often have been initially designed underpowered because they were only planned to be polled once per day when in reality the intervals increased to hourly, and even further down to less than a minute. Other devices and their duty cycle loads on the system must also be taken into consideration when poweringthese advanced systems. One big culprit to pull down the power system is any type of solenoid or relay that has a coil to be energized.Wireless Devices and Power ConsumptionBeginning in early 2000, wireless instrumentation began to appear in industrial applications on an increasing scale. As the name implies, these transmitters eliminate the cost of wiring and the physical limitations associated with flow computer I/O. However, battery lifetimes of the devices can be a very critical consideration.Figure 5: Wireless TransmitterOne consideration is ambient temperature. Using a pressure transmitter as an example, temperature effects are shown below: Device: Pressure Transmitter, Sample Rate 16 secondsAMBIENT TEMPERATURE ESTIMATED BATTERY LIFE86o F 7.0 years0o F 6.3 years-40o F 5.6 yearsOf much greater impact is the sampling frequency. In slow changing applications like tank level measurement, or non-critical applications such as temperature in non-custody transfer location, the requirement for data may be on a once every 16second basis. However, for gas custody transfer the API 21.1 standard requires a sample every second. Battery lifetimes for these two sets of sample rates are exemplified below:Device: Pressure Transmitter, Ambient Temperature 86o FSAMPLE RATE ESTIMATED BATTERY LIFE16 seconds 7.0 years1 second 0.8 (less than 1 year)To overcome such challenges a user may supply supplemental solar power. But, this usually requires cabling to an enclosure outside of Class 1 Division 1 areas. While there are energy harvesting techniques available to reduce the battery load, they entail adding cost and complexity.For these reasons, current technology requires considerable deliberation be performed prior to the deployment of wireless transmitters in gas custody transfer applications.Advanced Applications: PID ControllerThe first functionality to consider beyond just measurement is control. This requires either a pre-designed control application such as Proportional Integral Derivative (PID) control or some sort of logic application. These applications should be readily accessible in a familiar format to allow for configuration, tuning, and input/output assignment. PID Control requires an input process variable, an output to some sort of control device, a means of entering a set point, and the ability to tune the application to maximize the ability to control without being unstable.Upstream Example – Closed Loop Control of a Free Flowing Gas WellSizable drilling programs in the shale plays of North America have bought about a large number of free flowing wells. Maintaining optimal performance for so many sites can prove to be a formidable challenge.To fulfill this need, producers have flow from each well manipulated via a single automated choke valve. The primary focus of the system is to maintain a steady flow from the well to the Sales Line based upon an operator entered set point. Multiple overrides come into play based upon operating conditions. Measurements include Delta Pressure and Flow Rate from an orifice run feeding a Sales pipeline, and Static Pressure and Temperature of the flow line feeding a separator.Figure 6: Control SchemeIssues tackled via a Flow Computer include:Figure 7: Slug FlowLiquid Loading: Whenever slug flow (depicted by Figure 7) is present, gas flow through the Sales Line will drop as liquid is produced. The primary flow control logic reacts to this change and will open the choke to compensate. When the well unloads (water decreases) the gas flow increases quickly. Once again the primary flow control logic will compensate and commence to close the choke. Reaction time, though, may be too slow to avoid tripping the well off-line due to a high Sales Line pressure. To prevent this type of occurrence, the Delta Pressure (DP) of the orifice run is monitored. A DP override function in the flow computer logic is more aggressively tuned and therefore can bring the well back under normal flow control much sooner.Maintaining Critical Velocity: Critical Velocity, determined by industry known Turner & Coleman equations, indicates the minimum rate of flow required from the well to lift liquids. Flow below this value will cause water to collect in the welleventually curtailing production. It is necessary to assure the well flow exceeds Critical Velocity. Logic within the flow computer will select between the greater of the primary flow control set point and the Critical Velocity set point. In this fashion, flow will be maintained at the operator set point so long as the Critical Velocity is reached. The control scheme then works to keep the flow rate sufficient to assure that liquids continue to be extracted.Transient Flow Conditions: To avert the well from being tripped off-line due to a wave of high temperature production, a high temperature override PID loop responds rapidly to lower the flow set point. Reducing the flow through a heat exchanger (reference Figure 8) helps hold the average temperature to an acceptable level. Similarly, any upsets causing a spike in line pressure will trigger a high pressure override response and reduce flow.Figure 8: Heat Exchanger Keeps Average Temperature Within Operational LimitsESD: As is always the case for a safe operation, switches located on-site and a remote SCADA command can initiate an Emergency Shutdown (ESD) mode overriding all other logic and causing immediate closure of the choke.Host Applications: Remote Data AcquisitionFigure 9: Typical SCADA Host SystemsThe ability to communicate remotely to the electronic flow computer is what really brings operations to the world of real-time measurement and control. It allows results to be seen and acted upon virtually instantaneously (reference Figure 10). Many possibilities beyond just data gathering can be considered. Depending upon the type of communications and frequency of polling the remote device, options for remote control can be implemented. From simple set point changes, to advance logic and emergency shutdown processes, the communication systems link the flow computer and controller to the measurement and/or control office.Figure 10: Remotely Controlled Flow Set PointData is viewed within seconds of acquisition Real-TimeSummaryFigure 11: Fully Implemented System for Real-Time Measurement and ControlAs one can come to understand, the widespread use of microprocessor based flow computers has expanded the field capabilities in the areas of data acquisition, remote interface, and control. The units found at today's measurement sites many times are underutilized as a complete solution to remote field measurement and control. By taking the time to understand the capabilities of various manufacturers' units, learning how to use these features, and implementing them in aplanned way, the modern gas company can easily improve operations and ultimately their bottom line performance.。
第二章 GIS服务器ArcIMS

第二章GIS服务器ArcIMSArcIMS是ArcGIS中的一种服务器端产品,在ArcGIS Server出现之前,它是ESRI唯一的GIS服务器,其架构是非常优秀的。
ArcIMS提供了一个用于在Web上发布GIS数据和服务的分层框架,通过ArcIMS提供的地理服务(Service),可以在网络上发布GIS地图、数据和元数据等信息。
ArcIMS不仅是一个网络地图发布解决方案,作为一种发布技术,它拥有支持多种ESRI 客户端环境的能力;而作为一种服务器产品,ArcIMS包括了多种ESRI的服务端组件,对数据之间潜在的互操作性提供了一个机遇。
无论是在局域网内浏览地理数据,还是在Internet 上供成千上万人进行地理信息查询和访问,ArcIMS都可以通过构造不同的软硬件配置来满足这些要求。
ArcIMS满足了目前WebGIS面临的一系列挑战,它们包括:l 开放、可伸缩的架构;l 不同层次的良好操作性;l 提供高度的可定制性;l 完备的管理工具集,既有本地服务管理器,也可以基于网络进行地图服务管理;l 高安全性,不会将矢量数据泄漏给非授权用户;虽然ArcIMS作为ESRI一种软件产品的前途已定,但这只是ESRI产品策略的结果,对于WebGIS学习者而言,了解ArcIMS的体系架构和基于ArcXML的交互通讯方式,足以领略WebGIS的基本原理和开发之道,能为我们学习诸如ArcGIS Server这类复杂的GIS服务器软件打下良好的理论和实践基础[1]。
在本章内容中,我们将介绍ArcIMS[2]的产品架构、组件、管理和开发方式等内容,以方便读者深入了解这一典型的GIS服务器。
但本书不会在ArcIMS提供的Web应用开发框架(Application Developer Framework,ADF)上停留过多的时间,我们的目标不是讨论一个已知的开发框架,ESRI已经提供了足够详细的开发帮助。
我们想做的,是开发一个完全属于自己的ArcIMS客户端原型,而本章则是在开发之前必须了解到GIS服务器知识,大家准备好了吗?--------------------------------------------------------------------------------[1] 需要强调的是,ArcIMS与ArcGIS Server的整个架构没有相通的地方,这种基础只是WebGIS的一种理论和实践过程[2] ArcIMS安装访问/index.cfm?fa=knowledgebase.techarticles.gateway&p=16&pf =2152.1 ArcIMS体系架构ArcIMS整个体系由多个组件(Component)聚合而成,包括Web服务器、ArcIMS应用服务器、连接器、Web应用开发框架(ADF)和ArcIMS空间服务器等。
Arcgis操作手册
1 ArcGIS 简介1。
1 安装说明1。
1。
1ArcView(单用户使用许可)的安装ArcView(单用户使用许可)即ArcView—Single Use。
试用版(Evaluation Edition)也属于这种。
这两种软件的安装过程基本相同,只是在注册的时候略有差别。
ArcView 的安装对话框说明了如果在如何您的机器上安装Arcview,您可以选择安装到本地机器或者安装到网络机器,本向导讨论如何安装到本地机器,如果需要安装到网络机器,请查看相应的文档。
如果需要进行单用户安装,请选择第一个安装选项。
ArcView 的安装包含了可选择的ArcGIS 的扩展和其他模块。
如果需要安装可选模块,在安装的时候请选择complete 选项或者custome 选项,complete 选项将安装所有的可选择的模块,custom 允许你选择相应的模块。
有的可选模块需要额外的注册,注册向导将告诉您如何进行注册。
注意:要安装的目标目录不能包含空格。
当ArcView 安装结束的时候,安装向导会提示您安装可选的模块。
安装向导也会提示您安装例子数据ArcGIS Tutorial Data 和Crystal Reports 9.0.当所有的模块都安装完成之后,安装向导会提示你进行注册。
在进行注册前,ArcView 将无法使用。
选择一种注册模式,然后注册向导会提示您如何进行注册。
注:1. ArcView 试用版(EvaluationEdition) 注册时, 需输入注册号码(RegistrationNumber),如:EVA881681009;2。
ArcView 正式软件注册时,需输入软件锁号(KeyNumber),如KEY3700541(见软件锁上印刷的数字);同时还需要输入序列号,请留意产品的交货单.1。
1。
2ArcGIS(浮动使用许可)的安装ArcGIS (浮动使用许可)即ArcGIS-Concurrent,使用浮动的license。
ARCIMS安装步骤(IIS+Tomcat)--nicole的GIS收藏

ARCIMS安装步骤(IIS+Tomcat)--nicole的GIS收藏参考:平台:Windows XP软件:J2SE Development Kit (JDK) 5.0 Update 6Microsoft IIS (Available on the Windows 2003 CD)Apache Tomcat 5.5.17Tomcat Connector ISAPI Redirector 1.2.15 or higher (isapi_redirect.msi)ArcIMS 9.2 Installation CD此外,用户账户要具备管理员权限。
步骤:1. 卸载所有不受支持的相关软件版本JAVA、Web Server和Servlet Engine补充:最好是全新机器,比较不容易出现问题。
2. 安装J2SE(JDK)5.0 (Update 6)2.1. 点击J2SE Development Kit (JDK) 5.0 Update 62.2. 点击 'Download JDK'.2.3. 接受协议2.4. 点击链接“the Windows Offline Installation Multi-Language”(软件名为jdk-1_5_0_06-windows-i586-p.exe)2.5. 下载成功后运行安装程序2.6. 一般按默认设置安装软件,本次安装软件包括Java Runtime 与DevelopKit2.7. 安装完成后,进入开始/控制面板/Java Plugin2.8. 点击“Update”取消自动更新2.9. 点击“应用”,关闭Java Plug-in 控制面板3. 安装Microsoft IIS(如果该软件未安装)3.1. 点击“开始——控制面板——增加/删除程序”3.2. 在左边部分,点击“增加、移除Windows组件”3.3. 在Windows组件界面,选择“Intenet信息服务(IIS)”,点击“下一步”,直到安装完成(该过程需要Windows系统盘)。
艾动IMS系列单点传感器用户手册V1.0

IMS系列传感器用户手册V1.0介绍:本手册描述了如何使用艾动的IMS系列单点传感器。
艾动的IMS系列单点传感器是电阻式薄膜压力传感器,可以静态和动态地测试2个表面之间的力,超薄的传感器(100微米厚度)方便直接放入测试。
IMS薄膜电阻式传感器是采用双面聚酯基材上分别印刷银电极、力敏、绝缘、胶水,然后将上下2层基材面对面封装起来,引出的2个电极上压接公端或者母端的端子。
传感器用来测试传感器平面垂直方向的力。
传感器对外的2个引线就是一个电阻,在静态(不施力,不弯曲)条件下,传感器的电阻很大(>1MΩ)。
在传感器的有效面积上施加力之后会带来传感器2个引线之间电阻的对应减小,施力越大,电阻变得越小。
IMS系列薄膜电阻式压力传感器既不是测力计也不是应变仪,尽管它们有很类似的属性,IMS不适合精确测量。
免责申明本手册提供的信息仅用来提供产品的通用信息及指导应用,不作为本公司签订销售合同的补充协议。
本公司保留在不通知的前提下对本手册内容的修改的权利。
由于本公司不控制IMS系列传感器在客户产品的最终使用,任何潜在客户确认采用IMS系列传感器用于自己的产品商用之前,请自行确认产品的适用性。
进一步联系方式如果有进一步需求,请联系艾动客户服务人员邮件:support@.标准品规格IMS系列单点传感器包含5种标准品。
标准品统一采用100微米厚度的基材,传感器的成品厚度在230微米左右。
●IMS-C03:直径3mm的圆形有效区域。
●IMS-C05:直径5mm的圆形有效区域。
●IMS-C10:直径10mm的圆形有效区域。
●IMS-C20:直径20mm的圆形有效区域。
●IMS-C40:直径40mm的圆形有效区域。
对于IMS系列传感器标准品来说,有效区域就是指传感器一端银电极覆盖对应直径的圆形区域。
每种传感器按照测力范围分成2种类型●IMS-CXX-L:测力范围从100克-10千克,●IMS-CXX-H:测力范围从1千克-100千克。
- 1、下载文档前请自行甄别文档内容的完整性,平台不提供额外的编辑、内容补充、找答案等附加服务。
- 2、"仅部分预览"的文档,不可在线预览部分如存在完整性等问题,可反馈申请退款(可完整预览的文档不适用该条件!)。
- 3、如文档侵犯您的权益,请联系客服反馈,我们会尽快为您处理(人工客服工作时间:9:00-18:30)。
例子: <REQUEST> <GET_IMAGE> Client
<ENVELOPE minx="-180" miny="-90" maxx="180" maxy="90" /> </GET_IMAGE> </REQUEST> ArcXML Spatial Server
数据源
应用服务器
Weblink
XML Parser
Image Feature Query Geocode Extract
Data Access Manager
2000.9.6-8
ArcIMS Author
定义地图服务的内容 ? 输出结果是一个基于ArcXML的地图服 务的配置文件
ArcIMS的组成
客户端
Other Client
HTML Viewerver
Manager
Author Designer Administrator
空间服务器
Image Feature Query Geocode Extract
2000.9.6-8
中间层
ArcXML
数据管理层
数据源
数据源
2000.9.6-8
比喻: ArcIMS体系结构
食品
服务员
Coke
顾客
厨师
中间层 ArcIMS 空间服务器
客户端
2000.9.6-8
ArcIMS Server
2000.9.6-8
与已有IMS产品比较
ArcIMS是独立的Internet地图发布产品 ? ArcIMS集成了很多已有的IMS技术
-ArcView IMS: 易于使用 -MapObjects IMS: 容易定制
ArcIMS更具有开放性
Servlet 连接器 ArcXML
Web ArcXML CF ColdFusion 连接器 服务器 ASP ActiveX 连接器
ArcXML
ArcIMS 应用服务器
2000.9.6-8
ArcIMS空间服务器的部件
Weblink是在ArcIMS应用服务 器与空间服务器之间的通讯连 接 ?ArcXML Parser解析ArcXML 请求 ?Data Access Manager提供到数 据源的连接
2000.9.6-8
ArcIMS Designer
设置ArcIMS客户端 ? 输出结果为HTML和JavaScripts文件
2000.9.6-8
ArcIMS Administrator
生成和启动地图服务 ? 管理空间服务器和虚拟服务器 ? 检查Web站点的统计信息 ? 数据管理(EditNote和MapNote)
Image Feature Query Geocode Extract
应用服务器
Tasker Monitor
中间层
服务器
2000.9.6-8
ArcIMS应用服务器的连接器
提供与ArcIMS应用服务器进行通讯
-Web服务器直接和ArcIMS应用服务器进行通讯 (Servlet) -第三方的应用服务器与ArcIMS应用服务器进行通 讯(ColdFusion, ActiveX) -每一个连接器将它自己的语言翻译成ArcXML
本文由kennyferly贡献
pdf文档可能在WAP端浏览体验不佳。建议您优先选择TXT,或下载源文件到本机查看。
ArcIMS 体系结构
2000.9.6-8
什么是ArcIMS
Internet地图服务器软件
- 制作地图服务文件 - 定制用于地图应用的Web页面 - 通过Internet,提供地理数据和 服务 - 管理ArcIMS站点 - 通过Internet,集成各ArcIMS站 点和本地的数据
ArcIMS中间层
客户端
Other Client
HTML Viewer
Java Viewers
管理工具
Web 服务器 应用服务器的连接器
Manager
Author Designer Administrator
空间服务器
2000.9.6-8
ArcExplorer
Custom Desktop ArcInfo 8.1
HTML Viewer
ArcIMS
Java Viewer
ArcView GIS 8.1 Wireless ArcPad
2000.9.6-8
应用服务器连接器
应用服务器
Tasker Monitor
管理工具
服务器
2000.9.6-8
ArcXML简介
? ? ? XML 可扩展的标记语言 ArcIMS有自己的XML,叫做ArcXML ArcIMS的各个部件使用ArcXML进行通讯 ArcXML用于描述下列结构:
-支撑平台 -产品兼容性 -开发环境 -可伸缩的架构
2000.9.6-8
ArcIMS的体系结构是一个多层结构
展示层
Client Viewers Internet Web 服务器 ArcIMS 应用服务器的连接器 ArcIMS 应用服务器 ArcIMS 空间服务器
2000.9.6-8
地图服务(MapService)
运行在ArcIMS空间服务器上的进程 ? 地图服务需要一个地图配置文件 ? 地图服务有两种类型
-Image MapService -Feature MapService
2000.9.6-8
Image MapService
在服务器端执行地图操作 ? 利用空间服务器的Image Rendering能力 ? 类似与MapObjects IMS和ArcView IMS ? ArcIMS的所有客户端均支持
2000.9.6-8
Feature MapService
使用空间服务器的Feature Streaming能力 ? 客户端需要支持Java 2 Applet ? Feature MapService允许客户端有更强大的功能 -EditNotes -MapNotes -MapTips
