模糊数学教程第6章确定隶属函数的方法
隶属函数法

吕国利
不同植物和品种适应胁迫的方式是多种多样的,如一些植物具有综合 的、几种机理共同起作用的抗旱特征,任何单项机理的研究都有一定 的局限性,都不能有效准确地评价作物抗旱性。 没有一项抗旱指标能单独运用从而达到筛选的目标,需从植物抗旱性 的整体上进一步阐明。 利用多个指标综合评价的抗旱性,使单个指标对评定抗旱性的片面性 受到其他指标的弥补与缓和,从而使评定出的结果与实际结果较为接 近。
隶属函数评估法是根据模糊数学的原理,利用隶属函 数进行综合评估。 隶属函数在模糊控制系统中所起的作用是将普通的清 晰量转化为模糊量,以便进行模糊逻辑运算和推理。 实际上,隶属函数分析提供了一条在多指标测定基础 上,对各植物特性进行综合评价的途径。抗旱性隶属 函数法为目前应用最广的林木抗旱综合分析方法。
求出各抗旱指标 在各品种中的具 体隶属值
累加指定品种各 指标的抗旱隶属 值
求其平均值以评 定抗逆性
根据各品种平均 值的大小确定其 抗旱性强弱
隶属函数及其确定方法

美国加利福尼亚大学控制论教授扎得(L、A、Zadeh)经过多年的琢磨,终于在1965年首先发表了题为《模糊集》的论文。
指出:若对论域(研究的范围)U中的任一元素x,都有一个数A(x)∈[0,1]与之对应,则称A为U上的模糊集,A(x )称为x对A的隶属度。
当x在U中变动时,A(x)就是一个函数,称为A的隶属函数。
隶属度A(x)越接近于1,表示x属于A的程度越高,A(x)越接近于0表示x属于A的程度越低。
用取值于区间[0,1]的隶属函数A(x)表征x 属于A的程度高低,这样描述模糊性问题比起经典集合论更为合理。
隶属度属于模糊评价函数里的概念:模糊综合评价是对受多种因素影响的事物做出全面评价的一种十分有效的多因素决策方法,其特点是评价结果不是绝对地肯定或否定,而是以一个模糊集合来表示。
隶属度函数及其确定方法分类隶属度函数是模糊控制的应用基础,正确构造隶属度函数是能否用好模糊控制的关键之一。
隶属度函数的确定过程,本质上说应该是客观的,但每个人对于同一个模糊概念的认识理解又有差异,因此,隶属度函数的确定又带有主观性。
隶属度函数的确立目前还没有一套成熟有效的方法,大多数系统的确立方法还停留在经验和实验的基础上。
对于同一个模糊概念,不同的人会建立不完全相同的隶属度函数,尽管形式不完全相同,只要能反映同一模糊概念,在解决和处理实际模糊信息的问题中仍然殊途同归。
下面介绍几种常用的方法。
(1)模糊统计法:模糊统计法的基本思想是对论域U上的一个确定元素vo是否属于论域上的一个可变动的清晰集合A3作出清晰的判断。
对于不同的试验者,清晰集合A3可以有不同的边界,但它们都对应于同一个模糊集A。
模糊统计法的计算步骤是:在每次统计中, v o是固定的,A3的值是可变的,作n次试验,其模糊统计可按下式进行计算v0对 A 的隶属频率= v0∈A 的次数/ 试验总次数n随着n的增大,隶属频率也会趋向稳定,这个稳定值就是vo对A 的隶属度值。
隶属函数及确定方法
隶属函数正确地确定隶属函数,是运用模糊集合理论解决实际问题的基础。
隶属函数是对模糊概念的定量描述。
我们遇到的模糊概念不胜枚举,然而准确地反映模糊概念的模糊集合的隶属函数,却无法找到统一的模式。
隶属函数的确定过程,本质上说应该是客观的,但每个人对于同一个模糊概念的认识理解又有差异,因此,隶属函数的确定又带有主观性。
一般是根据经验或统计进行确定,也可由专家、权威给出。
例如体操裁判的评分,尽管带有一定的主观性,但却是反映裁判员们大量丰富实际经验的综合结果。
对于同一个模糊概念,不同的人会建立不完全相同的隶属函数,尽管形式不完全相同,只要能反映同一模糊概念,在解决和处理实际模糊信息的问题中仍然殊途同归。
事实上,也不可能存在对任何问题对任何人都适用的确定隶属函数的统一方法,因为模糊集合实质上是依赖于主观来描述客观事物的概念外延的模糊性。
可以设想,如果有对每个人都适用的确定隶属函数的方法,那么所谓的“模糊性”也就根本不存在了。
2.5.1 隶属函数的几种确定方法这里仅介绍几种常用的方法,不同的方法结果会不同,但检验隶属函数建立是否合适的标准,看其是否符合实际及在实际应用中检验其效果。
1.模糊统计法在有些情况下,隶属函数可以通过模糊统计试验的方法来确定。
这里以张南组等人进行的模糊统计工作为例,简单地介绍这种方法。
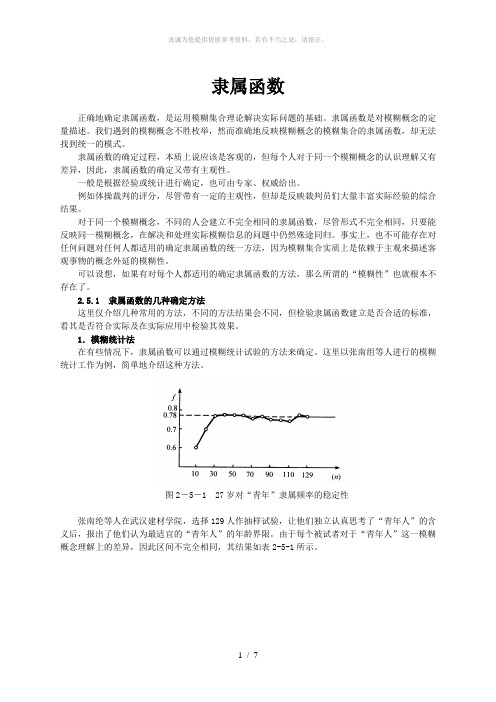
图2-5-1 27岁对“青年”隶属频率的稳定性张南纶等人在武汉建材学院,选择129人作抽样试验,让他们独立认真思考了“青年人”的含义后,报出了他们认为最适宜的“青年人”的年龄界限。
由于每个被试者对于“青年人”这一模糊概念理解上的差异,因此区间不完全相同,其结果如表2-5-1所示。
现选取0u =27岁,对“青年人”的隶属频率为)调查人数()岁的区间数(隶属次数包含n 27=μ (2-5-1)用μ作为27岁对“青年人”的隶属度的近似值,计算结果见表2-5-2。
78.027)=(青年人μ按这种方法计算出15~36岁对“青年人”的隶属频率,从中确定隶属度。
确定隶属函数的方法
7
其中mi是第i位专家的估计值,并请每个人标出各自对
所做估计值的信任度,记为 e1,e2, ,en, 这里ei表示第i
位专家对自己的估计的把握程度,并且规定 ei [0,1],第 有绝对把握时, ei=1;毫无把握时,取ei=0; 其
它情形,取 0 ei 1.
(6)计算
m
1 M
n
mi ,
iM
其中 M {iei;i1 ,2,...,n },
③中间型 A ( x ) 1, a x b
1
e
(
x
b
)
2
,x
b
a
编辑ppt
15
其它常见模糊分布还有 (3) 半梯形分布与梯形分布;
m21,m22, ,m2n
(4)重复2、3步,直至离差值小于或等于预先
给定的标准 0. 设重复k次后,有 d k , 这里 d k 为重复k次后的离差。
(5)将第k次得到的对
A (u 0 )的平均估计值
m
k
和d再交k给各位专家,请他们做最后的“判断”,给出估计
值
m1,m2, ,mn
编辑ppt
对于 m11,m12, ,m1n计算平均值 m 1 和离差 d 1 :
m1
1 n
n i 1
m1i ,
d1
1 n
n i1
m1i
m1
2
编辑ppt
6
(3)不记名将全部数据 m 11,m 12, ,m 1n,m 1,d 1送交 每位专家,同时附上进一步的补充资料,请每位
专家在阅读和思考之后,给出新的估计值:
可暂时使用m , 但要特别注意信息反馈,不断通过
“学习过程”,完 A(u0)m
隶属函数法
求出各抗旱指标 在各品种中的具 体隶属值
累加指定品种各 指标的抗旱隶属 值
求其平均值以评 定抗逆性来自根据各品种平均 值的大小确定其 抗旱性强弱
吕国利
不同植物和品种适应胁迫的方式是多种多样的,如一些植物具有综合 的、几种机理共同起作用的抗旱特征,任何单项机理的研究都有一定 的局限性,都不能有效准确地评价作物抗旱性。 没有一项抗旱指标能单独运用从而达到筛选的目标,需从植物抗旱性 的整体上进一步阐明。 利用多个指标综合评价的抗旱性,使单个指标对评定抗旱性的片面性 受到其他指标的弥补与缓和,从而使评定出的结果与实际结果较为接 近。
隶属函数评估法是根据模糊数学的原理,利用隶属函 数进行综合评估。 隶属函数在模糊控制系统中所起的作用是将普通的清 晰量转化为模糊量,以便进行模糊逻辑运算和推理。 实际上,隶属函数分析提供了一条在多指标测定基础 上,对各植物特性进行综合评价的途径。抗旱性隶属 函数法为目前应用最广的林木抗旱综合分析方法。
对模糊隶属函数确定方法的进一步探讨

对模糊隶属函数确定方法的进一步探讨隶属函数的确定不应只侧重于对信息自身模糊性的识别和描述,还应该正确描述主体的心理测度,重视主体认识水平的缺陷。
探讨了用简便可行的隶属函数度量方法来测量人们进行决策时心理测度上的模糊性,给出了具体不同情况下的描述函数,在一定程度上可以更准确地描述信息的模糊性,从而使决策更具有合理性。
标签:隶属函数;模糊分布;心理测度一、引言客观事物均不同程度地存在着不确定性,这种不确定性蕴涵在客观表现及其主观识别之中。
从本质上看,不确定性是主观对于客观而言的,即对客观信息的识别与刻画无不受到主观因素的影响,受到主体心理因素的影响,进而表现为认知水平和描述方法的差异。
而一般的隶属函数确定的方法多从下面两个角度;或侧重于描述信息自身的模糊性、识别和刻画方法的模糊性,或从如何消除减少主观任意性成分来进行研究,而忽视了起决定作用的主体想心理思维模式和判断尺度,使得隶属函数的确定不够完善。
另一方面,随着生产系统、社会系统的大规模化和复杂化,使得人们进行预测与决策变得十分困难。
由于决定预测的准确性及决策成败的关键是人,所以应能正确描述人的心理测度上的模糊性。
对于此类问题,当今决策理论是从理性决策的行为决策两分支进行研究,但在现实实际操作生活中,出现了理性决策与行为决策不相一致的情况。
正是基于这两方面因素考虑,力图应用理性决策与行为决策相结合的思想,通过定性与定量相结合的方法,找到一种能反映主体心理测度的方法,从能够描述存在的现象和避免不应发生的现象出现两个角度进行研究,使信息的模糊隶属描述更具有合理性,使人们在模糊的状态下进行的预测和决策偏差更小。
二、分类描述1.当主体参考事态进行判断时,往往由于过于自信而出现偏差,当事件发生的客观概率在0.5上,而人们又认为或希望它发生,则判断出的隶属度往往高于凭他们的知识和事实本应判断出的值;另一方面,当客观概率小于0.5,而人们又不认为或不希望它会发生,则往往估计偏低。
模糊数学教程第6章确定隶属函数的方法

主观经验法主要依赖于专家的专业知识和经验,通过专家对模糊概念的深入理 解和主观判断,来确定隶属函数的形状、参数和阈值等。这种方法简单易行, 但受限于专家知识和经验的局限性。
统计学习法
总结词
基于数据样本和统计学习理论来确定隶属函数的方法。
详细描述
统计学习法利用已知数据样本,通过统计学习理论和方法,如回归分析、决策树、支持向量机等,来拟合和优化 隶属函数。这种方法客观、科学,但需要足够的数据样本和计算资源。
VS
详细描述
连续性是指隶属函数在定义域内的任何一 点都存在明确的隶属度值,没有跳跃或中 断。连续的隶属函数能够更好地描述模糊 现象,因为模糊现象本身也是连续变化的 。
单调性
总结词
隶属函数应该是单调的,以反映模糊集合的 单调性质。
详细描述
单调性是指随着输入值的增大或减小,隶属 度值也相应增大或减小。单调递增的隶属函 数表示随着输入值的增加,隶属度也逐渐增 加;单调递减的隶属函数则表示随着输入值 的增加,隶属度逐渐减小。
经济效益评价
在经济效益评价中,隶属函数可以用于将各 评价指标的量纲统一,通过计算隶属度来评 价项目的经济效益。
在模糊聚类分析中的应用
模糊聚类算法
隶属函数在模糊聚类算法中起到关键作用,通过计算样本点对各个聚类的隶属度,实现样本点的软分 类。
聚类效果的评估
在模糊聚类分析中,隶属函数可以用于评估聚类效果,通过计算样本点对各个聚类的隶属度分布情况 ,判断聚类的质量和稳定性。
模糊数学教程第6章确定隶属函数 的方法
目 录
• 引言 • 确定隶属函数的方法 • 隶属函数的特性 • 隶属函数的优化 • 隶属函数的应用 • 总结与展望
01 引言
模糊隶属函数

模糊隶属函数模糊隶属函数(Fuzzy Membership Function)是一种把客观事物的状态或特征描述为统一的语言形式的方法。
由于客观实体总是具有多种不同属性,而每个属性都可以在某种程度上分为若干个状态,因此,对客观实体要表达出来,就需要一种能够把多种属性状态统一描述的表达方法,而这种把多种属性状态统一描述的表达方法就是模糊隶属函数,也可以说模糊隶属函数是客观实体的属性状态的自动统一描述的方法。
模糊隶属函数实际上是一种将客观事物的状态变量映射到模糊集合中的函数,它能够将客观实体的状态、特征以及其他描述信息统一描述,这种描述有时被称为隶属度函数,它可以用来描述客观实体的属性状态,从而使客观实体的描述信息更加精确,更具有决策可操作性。
模糊隶属函数的定义如下:设X为客观事物的一个属性状态,μA(X)为X在A模糊集合中的隶属度,则μA(X)就是X的模糊隶属函数。
模糊隶属函数可以通过模糊数学理论解释,从而加深对其本质的理解,模糊数学理论主要包括模糊集合、模糊逻辑等,而模糊集合则是模糊隶属函数的基础,模糊集合是一种由元素的隶属度组成的集合,它可以用来描述客观事物的属性状态,即可以用来表示客观事物的某个属性的取值范围以及其取值的合理程度。
模糊隶属函数由模糊集合构成,具体可以分为三种:线性模糊隶属函数、非线性模糊隶属函数和多选模糊隶属函数。
线性模糊隶属函数是指将状态或特征以线性模式表示的模糊隶属函数,它适用于描述连续性属性变量,它的表达式一般为:μA(x)=ax+b,其中a,b是常数,a>0,b<0。
非线性模糊隶属函数是指将状态或特征以非线性模式表示的模糊隶属函数,它适用于描述离散性属性变量,它的表达式一般为:μA(x)=1/ (1+|x-b|^a),其中a,b是常数,a>0,b<0。
多选模糊隶属函数是指将状态或特征以多选模式表示的模糊隶属函数,它适用于描述多个属性变量的取值范围,它的表达式一般为:μA(x)=1 / (1+ (1/p) * Σi=1n |x-xi|^ai),其中ai,bi是常数,ai>0,bi<0,n为多选的属性变量的数量。
模糊隶属度计算公式
模糊隶属度计算公式模糊隶属度计算是模糊逻辑中重要的概念,用于描述事物在某个模糊集合中的隶属程度。
模糊隶属度的计算公式可以根据不同的模糊集合类型和隶属函数进行选择,下面将介绍一些常见的模糊隶属度计算公式及其相关参考内容。
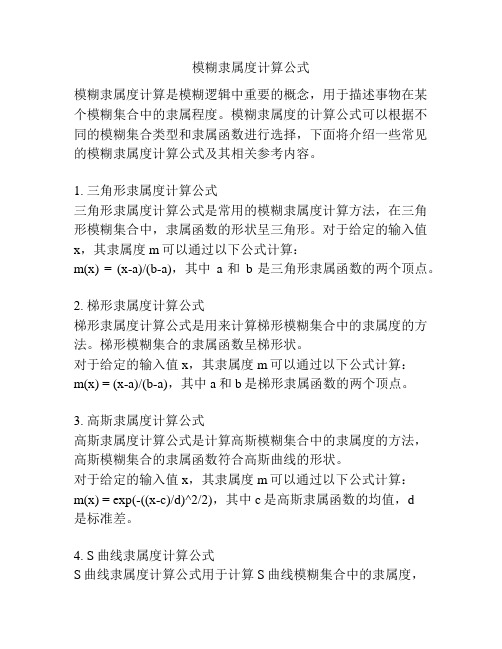
1. 三角形隶属度计算公式三角形隶属度计算公式是常用的模糊隶属度计算方法,在三角形模糊集合中,隶属函数的形状呈三角形。
对于给定的输入值x,其隶属度m可以通过以下公式计算:m(x) = (x-a)/(b-a),其中a和b是三角形隶属函数的两个顶点。
2. 梯形隶属度计算公式梯形隶属度计算公式是用来计算梯形模糊集合中的隶属度的方法。
梯形模糊集合的隶属函数呈梯形状。
对于给定的输入值x,其隶属度m可以通过以下公式计算:m(x) = (x-a)/(b-a),其中a和b是梯形隶属函数的两个顶点。
3. 高斯隶属度计算公式高斯隶属度计算公式是计算高斯模糊集合中的隶属度的方法,高斯模糊集合的隶属函数符合高斯曲线的形状。
对于给定的输入值x,其隶属度m可以通过以下公式计算:m(x) = exp(-((x-c)/d)^2/2),其中c是高斯隶属函数的均值,d是标准差。
4. S曲线隶属度计算公式S曲线隶属度计算公式用于计算S曲线模糊集合中的隶属度,S曲线模糊集合的隶属函数呈S形状。
对于给定的输入值x,其隶属度m可以通过以下公式计算:m(x) = 1/(1+exp(-a(x-b))),其中a和b是S曲线隶属函数中的参数。
以上介绍的模糊隶属度计算公式是常见的几种,根据不同的模糊集合类型和隶属函数,可以选择适合的公式进行计算。
模糊隶属度的计算在模糊逻辑和模糊控制等领域有着广泛的应用,对于模糊推理和模糊决策等问题具有重要的意义。
对于模糊隶属度计算公式的具体推导过程和理论研究,可以参考模糊逻辑和模糊控制相关的书籍和论文,如《模糊数学及应用》、《模糊控制系统设计与应用》等。
模糊规则与隶属度曲线定义详细求解方法倒车系统演示及试验结果课件

03
倒车系统演示
倒车系统工作原理
倒车系统的定义
倒车系统是一种辅助驾驶员进行 车辆倒退安全操作的电子系统。
倒车系统的重要性
倒车系统可以帮助驾驶员更好地掌 握车辆周围的状况,避免在倒车过 程中发生碰撞,提高倒车安全性。
倒车系统的组成
倒车系统通常由倒车雷达、倒车影 像和控制器等组成。
倒车雷达工作过程演示
模糊逻辑在许多领域都有应用,如控制系统、 医疗诊断、决策支持等。
隶属度曲线定义
隶属度曲线是一种用 于描述模糊集合的图 形表示。
隶属度值通常在0到1 之间,其中0表示不 属于该集合,1表示 完全属于该集合。
它表示一个元素属于 某个模糊集合的程度, 即隶属度。
模糊逻辑的应用场景
模糊逻辑在倒车系统中可以用于 处理传感器输入,如车速、距离
存在的不足与展望
1
算法复杂度与实时性
虽然所提方法在实验中取得了较好的效 果,但算法的复杂度较高,可能导致实 时性受到影响。未来可以研究优化算法, 降低复杂度,提高实时性能。
2
传感器精度与可靠性
倒车系统的性能与传感器的精度和可靠 性密切相关。目前我们的实验中使用的 传感器为普通超声波传感器,可能存在 误差和干扰。未来可以研究更先进的传 感器技术,提高测量精度和可靠性。
模糊运算的扩展
将模糊集合和模糊规则进 行各种运算,如交、并、 补等,以构建更复杂的模 糊逻辑系统。
模糊规则的优化方法
清晰化处理
对模糊规则进行清晰化处 理,将模糊集合转化为具 体的数值,以便于分析计算。
规则简化
简化模糊规则的数量和复 杂度,提高系统的响应速 度和准确性。
自适应调整
根据系统的运行状态和输 入输出数据,自适应调整 模糊规则和隶属度函数, 以优化系统的性能。
隶属函数及确定方法

隶属函数正确地确定隶属函数,是运用模糊集合理论解决实际问题的基础。
隶属函数是对模糊概念的定量描述。
我们遇到的模糊概念不胜枚举,然而准确地反映模糊概念的模糊集合的隶属函数,却无法找到统一的模式。
隶属函数的确定过程,本质上说应该是客观的,但每个人对于同一个模糊概念的认识理解又有差异,因此,隶属函数的确定又带有主观性。
一般是根据经验或统计进行确定,也可由专家、权威给出。
例如体操裁判的评分,尽管带有一定的主观性,但却是反映裁判员们大量丰富实际经验的综合结果。
对于同一个模糊概念,不同的人会建立不完全相同的隶属函数,尽管形式不完全相同,只要能反映同一模糊概念,在解决和处理实际模糊信息的问题中仍然殊途同归。
事实上,也不可能存在对任何问题对任何人都适用的确定隶属函数的统一方法,因为模糊集合实质上是依赖于主观来描述客观事物的概念外延的模糊性。
可以设想,如果有对每个人都适用的确定隶属函数的方法,那么所谓的“模糊性”也就根本不存在了。
2.5.1 隶属函数的几种确定方法这里仅介绍几种常用的方法,不同的方法结果会不同,但检验隶属函数建立是否合适的标准,看其是否符合实际及在实际应用中检验其效果。
1.模糊统计法在有些情况下,隶属函数可以通过模糊统计试验的方法来确定。
这里以张南组等人进行的模糊统计工作为例,简单地介绍这种方法。
图2-5-1 27岁对“青年”隶属频率的稳定性张南纶等人在武汉建材学院,选择129人作抽样试验,让他们独立认真思考了“青年人”的含义后,报出了他们认为最适宜的“青年人”的年龄界限。
由于每个被试者对于“青年人”这一模糊概念理解上的差异,因此区间不完全相同,其结果如表2-5-1所示。
现选取0u=27岁,对“青年人”的隶属频率为)调查人数()岁的区间数(隶属次数包含n 27=μ (2-5-1) 用μ作为27岁对“青年人”的隶属度的近似值,计算结果见表2-5-2。
78.027)=(青年人μ按这种方法计算出15~36岁对“青年人”的隶属频率,从中确定隶属度。
隶属函数确定问题

隶属函数确定问题standalone; self-contained; independent; self-governed;autocephalous; indie; absolute; unattached; substantive隶属函数确定问题一、隶属函数的确定原则1、表示隶属度函数的模糊集合必须是凸模糊集合;即:在一定范围内或者一定条件下,模糊概念的隶属度具有一定的稳定性;从最大的隶属度函点出发向两边延伸时,其隶属度是单调递减的,而不许有波浪性,呈单峰;一般用三角形和梯形作为隶属度函数曲线。
2、变量所取隶属度函数通常是对称和平衡的模糊变量的标值选择一般取3-9个为宜,通常取奇数(平衡),在“零”“适中”等集合的两边语言值通常取对称。
3、隶属度函数要避免不恰当的重复在相同的论域上使用的具有语意顺序的若干标称的模糊集合,应该合力排序。
4、论语中的每个点应该至少属于一个隶属度函数的区域,同时它一般应该属于之多不超过两个隶属度函数的区域。
5、对于同一输入,没有两个隶属度函数会同时有最大隶属度6、对两个隶属度函数重叠时,重叠部分对于两个隶属度函数的最大隶属度不应该有交叉。
二、隶属度函数确定的方法1、模糊统计法模糊统计法的基本思想是对论域U上的一个确定元素v是否属于论域上的一个可变的清晰集的判断。
(清晰集、模糊集)模糊统计法计算步骤:Step1 确定论域Step2形成调查表Step3统计成频数分布表Step4建立隶属函数Step5隶属度(由频数分布表或者隶属函数可得)所谓模糊统计实验包含以下四个要素:假设做n次模糊统计试验,则可计算出:实际上,当n不断增大时,隶属频率趋于稳定,其频率的稳定值称为0x 对A的隶属度,即2、例证法例证法由已知的有限个隶属度函数的值,来估计论域U上的模糊子集A的隶属函数。
3、专家经验法是根据专家的实际经验给出模糊信息的处理算式或者相应的权系数值隶属函数的一种方法。
4、二元对比排序法5、群体决策法6、指派方法(待定来自算法大全第22章模糊数学模型)指派方法是一种主观的方法,它主要依据人们的实践经验来确定某些模糊集隶属函数的一种方法。
模糊数学隶属函数的确定

我们取之为“很冷”、“冷”、“正好”、“热”和 “很热”,则凭借我们对“很冷”、“冷”、“凉 爽”、“适宜”和“热”这几个模糊概念的认知和理 解,规定这些模糊集的隶属函数曲线如图1 所示。
虽然直觉的方法非常简单,也很直观,但它却包含着对象的背
景、环境以及语义上的有关知识,也包含了对这些知识的语言学描 述。因此,对于同一个模糊概念,不同的背景、不同的人可能会建 立出不完全相同的隶属函数。例如,模糊集A = “很冷”的隶属函 数。不同性别、不同生活环境的人所得出的曲线是不同的。
归纳起来,模糊统计试验方法的基本步骤是:
① 在每一次试验,要对论域中固定的元素uu0 o是否属于一个可变动的分明集合 A*
( A*作为模糊集A的弹性疆域)作一个确切的判断;注意,在每一次试验下,A*必须 是一个确定的清晰集合;
② 在各次试验中,uuo0是固定的,而AA** 在随机变动;如果在所作的n 次试验中,
其隶属函数曲线如图 10 所示:
例 4 考虑建立模糊概念“青年人”的隶属函数。根据
统计资料,作出“青年人”的隶属函数的大致曲线(可 参考例2的过程)。通过分析比较,发现其与岭形分布的 中间型十分相似,于是选择岭形分布的中间型作为 “青年人”的隶属函数。
2.4 其它方法
确定隶属函数的方法还有许多。例如,可以请教有
③根据表3的数据,可作出模糊集A =“青年人”的隶属函数 曲线如图5所示:
模糊统计试验方法可以比较客观地反映论域中元素相对于模糊 概念的隶属程度,也具有一定的理论基础,因而是一种常用的确定 隶属函数的方法。但需要指出的是,模糊统计与概率统计是有区别 的:概率统计可以理解为“变动的点”是否落在“不动的圈内”, 而模糊统计则可理解为“变动的圈”是否覆盖住“不动的点”。 如图3所示。
模糊数学教程第6章 确定隶属函数的方法
(4)条件S,它联系着对模糊概念所进行的划分 过程的全部客观或心理的因素,制约者A*的运动。
Remark:
模糊统计法的基本要求是在每次实验中,对u0是 否属于 A 作出确切的判断,即要求在每次试验中, A*必须确定。 模糊统计试验的特点:在各次试验中 u0固定,A*是变的,这点不同于随机试验. 隶属度计算公式为:
这里 (x)
x
1 2
e dt
t2 2
增量法(Incremental) 例1、设论域X=[0, 200](单位:岁),又设 A F (X),
且定义 A 为老年,求其隶属函数 A(x).
解:任给x一个增量 x, 相应地 A(x)也有一个增量 A(x x) A(x), 假定
第6章 确定隶属函数的方法
一、确定隶属函数的原则 二、Delphi法 三、模糊统计法 四、增量法 五、因素加权平均法
隶属函数(Membership function)是建 立模糊集的基础,它在模糊数学中占有 突出的地位。隶属函数的确定,无论从 理论上还是实践上都是模糊数学及其应 用的基本而关键的问题。本章介绍确定 隶属函数的原则和方法。
n
其中 u (u1 , ...,un ) U,(1 , 2 ,, n)是权重向量,且
i 1
n
i
1 (i 1, 2, ...,n) 反映了第i个因素的重要程度 ,i
例如,用模糊集 A 表示学生集合上的“优秀 生“,将”优秀生“分成思想好、学习好、 身体 好、团结好、纪律好诸因素,学生属于”优秀生”的 隶 属度 A(u)就等于u属于5个因素的隶属度 Ai (ui ) 的加 权平均,即
对于 m11 ,m12 ,,m1n 计算平均值 m1 和离差 d1 :
模糊隶属度计算公式

模糊隶属度计算公式模糊隶属度计算公式是模糊数学中一个重要的概念,它可以用于描述某一个事物或现象在不同特征值下所呈现的程度或强度。
在现实世界中,很多情况都不是非黑即白的,而是存在着模糊性和不确定性,这时候就需要使用模糊隶属度计算公式来处理这种模糊性。
模糊隶属度的概念最早由L. A. Zadeh提出,他认为在现实生活中,许多事物或概念具有模糊性,即具有一定的隶属度。
例如,我们不能说一个人的年龄完全是成年或未成年,而应该说他的年龄是具有一定的成年或未成年的隶属度。
在模糊隶属度计算中,需要考虑一个事物或现象在不同特征值下的隶属程度,这通常通过计算它们各自的隶属度来实现。
在计算模糊隶属度时,需要采用一些模糊集合的基本概念和运算,如隶属度函数、模糊逻辑运算等。
在此基础上,可以通过一些数学方法来计算模糊隶属度,常见的计算方法包括模糊熵、模糊相似度等。
其中,模糊熵是一种比较常见的计算方法,它是用来衡量某一模糊集合的不确定性或模糊程度的。
假设有一个离散模糊集合$X=\{x_1,x_2,...,x_n\}$,其隶属度函数为$\mu(x_i)$。
则模糊熵的计算公式为:$H(X)=-\sum_{i=1}^{n}\mu(x_i)\ln \mu(x_i)$另一个常用的计算模糊隶属度的方法是模糊相似度,它可用于计算两个模糊集合之间的相似程度。
假设有两个离散模糊集合$A=\{x_1,x_2,...,x_n\}$和$B=\{y_1,y_2,...,y_m\}$,它们的隶属度函数分别为$\mu_A(x_i)$和$\mu_B(x_i)$。
则模糊相似度的计算公式为:$Sim(A,B)=\frac{\sum_{i=1}^{n}\sum_{j=1}^{m}min\{\mu_A(x _i),\mu_B(y_j)\}}{\sum_{i=1}^{n}\mu_A(x_i)+\sum_{j=1}^{m}\ mu_B(y_j)}$其中$min\{\mu_A(x_i),\mu_B(y_j)\}$表示$x_i$和$y_j$的隶属度函数中较小的那个值。
模糊数学中关于隶属函数的确定方法

The Ways of Determination the MembershipFunction学院:理学院专业:应用数学姓名:张启亮学号:2014564The ways of determination the membership functionzhangqiliangTo solve the problem, the membership function of a set of F should be founded firstly, and the way to find F, which based on pattern recognitions, has already mentioned above. This part we talk about fuzzy and the general way to find F, and some station should be paid more attention.StatisticsLet us take the way of determining <young> for example to explain it.Let U is the field of age, A is F. Take u = 27, the F statistic way to determine the of u. ex way: pick several persons and let them set their value of young after thinking twice. This make the mean of concept of fuzzy more precise.If m is the count of the occurrence that age is in field of 27, while n is the total experiment. m/n is the degree of membership function. Chart 2-1 is the result of the sampling survey. We find the frequency degree of membership is around the 0.78,so we take A(27) = 0.78.Chart 2-1We take the member function of <young> into consideration. Let's make the field of U intoserial groups, and the mid-value of each group stands for the frequency degree of membership (chart 2-2). Plot the <young> curve of the membership (figure 2-7). The result comes from one department in the static F way.In the same way, we've got the similar consequence from anther two departments.Test Number102030405060708090100110120129 (n)Membership61423313947536268768595101 Number (m)Membership0.60.70.770.780.780.760.760.780.760.760.750.790.78 Frequency (m/n)Chart 2-2Figure 2-7The F experiment shows the regular of membership. The main factors of the <young> is: jointhe corps (14),join the army(18),over the age corps (25), retire from corps(28),special ages(20,25,30,35), mature and age and so on, these point is showed on the chart.F statistics is similar to the static one in form, and both to research the chanciness in defining way. But, there are two differences between F statistics and the probability and statistics. These differences are:Group Frequency Membership Frequency GroupFrequency Membership Frequency13.5-14.5 2 0.016 25.5-26.5 103 0.798 14.5-15.5 27 0.210 26.5-27.5 101 0.783 15.5-16.5 51 0.395 27.5-28.6 99 0.767 16.5-17.5 67 0.519 28.5-29.5 80 0.620 17.5-18.5 124 0.961 29.5-30.5 77 0.597 18.5-19.5 125 0.969 30.5-31.5 27 0.209 19.5-20.5 129 1 31.5-32.5 27 0.209 20.5-21.5 129 1 32.5-33.5 26 0.202 21.5-22.5 129 1 33.5-34.5 26 0.202 22.5-23.5 129 1 34.5-35.5 26 0.202 23.5-24.5 129 1 35.5-36.5 1 0.00824.5-25.51280.992The main requirement of random experiment for the chance event: every time, the bechancing (not bechancing) of A is certainty. Every time A is certainty. w is random. In experiment,The frequency of the occurrence of A = (w in A)/nThe frequency is more stable, when n gets larger. The value of the frequency stands is called the Possibility of A in some Status.The main requirement of F statistic experiment: the fixed u is belong to an assemble A, whose elements are unfixed, do a judgment. This means every time, A is A fix assemble. Every experiment, u is fixed. A is fluctuated. n times' experiment , calculateThe degree of frequency membership of u = (u in A)/nWhen n grows, the frequency is more stable. The value of this frequency defined as the degree of u to A.The F experiment should follow the rule: the men should learn the meaning of fuzzy vocabulary and the ability to figure it out in number; after analysis drop the illegal data.Static F, also called Two-phase static F, which meansP2= {A, A2}In every event, defined a mape: U ---> P2It's a compartmentalization to U. Two-phase static F means there are only two elements in the assemble. So there is property :u∈U,A(u)+A c(u)=1Based on it, more theories about the static F can be given. SetP = {A1, A2, A3.......A m} A i∈A(U) i = 1,2,3...mevery result can gave mape: u ->pWe say the experiment is m-phase static F experiment, the P is m-aphase assemble.Ex,{short, mid, tall} is 3-aphase,{old, mid, young}is 3-aphase,{east, north,south,west}is 4-aphase,{gold,wood,water,fire,earth}is 5-aphase,and so on.The result of m-aphase can lead to the function of membership, and its properity:u ∈U, A 1(u)+A 2(u)+A 3(u)+...A m (u)=1TrichotomyTrichotomy is also the method that deals with fuzziness using the idea of random interval. For instance, we can establish the membership function of three concepts such as the set 1A of shorty, the set 2A of medium and the set 3A of high.In case of )3,0(=U , m is the unit, 3P ={ shorty, medium, high}, we can identify a partition of U after each test and each division determinates a couple of numbers (ηξ,):ξ: the cut-off point of shorty and mediumη: the cut-off point of medium and highOtherwise, if we know the couple of numbers (ηξ,), we can confirm a map e, in other words we can separate the shorty, medium and high. So fuzzy concepts are clear.The regions of shorty, medium and high are random, so that ξand η are random. They have the characteristics of normal distribution::ξ),(211σa N , :η),(222σa NAnd the couple of numbers (ηξ,) confirms the map ),(ηξe : U → {1A ,2A ,3A } PromptlyFigure 2-8⎪⎩⎪⎨⎧<≤<<=x x A x x A x x A x e ηηξξηξ)()()())(,(321P{ξ≤x } indicates the probability that ξ in the region (]b x , .If x increases, then (]b x , will be reduced, and the probability that ξ in the region (]b x , is reduced. The character of P{ξ≤x } is similar to the fuzzy set )(1x A :⎰+∞=≤=xdx x P x P x A )(}{)(1ξξSame argument:⎰∞-=<=xdx x P x P x A )(}{)(3ηη)(x P ξ and )(x P η are the probability density of ξ and η,and because)()(1)(312x A x A x A --=We can calculate:⎪⎪⎭⎫ ⎝⎛-Φ=⎪⎪⎭⎫ ⎝⎛-Φ-=223111)(,1)(σσa x x A a x x A And then⎪⎪⎭⎫⎝⎛-Φ-⎪⎪⎭⎫ ⎝⎛-Φ=22112)(σσa x a x x AIn that⎰∞--=Φxt dt ex 2221)(π.Selection of function and parameter adjustmentDue to the fuzzy set is fuzzy and the empirical study object, correctly determine the membership function, is the basis of using the fuzzy set theory to solve practical problems. JianBianXing membership function essentially reflect the function, so finding a unified membership degree calculation method is not realistic. Determination of membership function is also does not have a mature and effective method, the determination of most systems method still stays on the basis of the experience and experiment.Several commonly used methods: Fuzzy statistical method, example method, appoint such ascomparison method, the binary sorting method, a variety of methods have certain limitation in different degree.For the same fuzzy concept, different people will not identical membership function is established. How to find the most close to the membership function, or more approximation to reflect objectively the actual content expressed by the evaluation index, can best reflect the characteristics of its present state, there are many people for such work, here to study this problem from another side.With the aid of assigned to determine the membership function method of thought. Namely according to the nature of the problem to ready some gunk in the form of distribution, and then according to the measured data and with the aid of other mathematical methods, such as the least square method or methods of set-valued statistics and random colony shadow distribution contains parameters. Thought is still using preliminary determine the rough membership function, and then through learning and practice inspection modify and perfect gradually, to test and adjust the membership function by actual effect.Assumes that the reference point of the membership degree of 1, that is, reference points for satisfactory , with a linear distribution (figure 1), k = 2;)0(,,)()(>≤≤--=k b x a ab x b x f kFigure 1 represents the reference point value on both sides are in real life situations. Point a in figure 1 (a), as the reference point, point b choose membership degree under zero as a minimum point; Figure 1 (c) represents the reference point for a period.Also optional Γ distribution. Such as when the reference point value is an endpoint, assumes that the reference point of the membership degree is 0, namely reference point is not satisfied, can choose partial large (l) Γ distribution (see figure 2), k is generally preferable 2.0,1)()(>-=--k e x f a x kThis partial large Γ distribution is the most easy to adjust, can be determi ned by starting point tangent slope k, both decided curve is steep. Curve of this kind of situation can be adopted according to the actual situation in the opposite direction, namely partial small distribution.Bad phenomenon of adjacent marginal evaluation: evaluation such as height, 1 80 m high, membership for 1; 179 m to 1; So 1. Belongs to the genus degrees for 78 m? With rising ridge shape distribution described, its curve as shown in figure 3.⎪⎩⎪⎨⎧>≤<+--+≤=b x b x a b a x a b a x x f ,1),2(sin 2121,0)(πCauchy distribution:.0,0,,)(11,0)(>>⎪⎩⎪⎨⎧>-+≤=-βααβa x a x a x x fCurve near the boundary changed little, conform to the normal mentality.Of loss value, namely the phenomenon of negative effects, both sides is different membership function description, using asymmetric S membership function description:S-shaped membership function is a kind of commonly used fuzzy membership function, it can describe most of the fuzzy concept, describe its function has a variety of, here USES the shape is easy to control, adjust the function of the description of the following type:⎪⎪⎪⎩⎪⎪⎪⎨⎧>≤<⎪⎪⎭⎫ ⎝⎛---≤<⎪⎪⎭⎫ ⎝⎛--≤=μμβαμμβααμααμαγx x x n x x m x x ,1,1,,0),;(22 It is as the independent variable increases, the degree of satisfaction increased membership functions, can be regulated by adjusting the parameters of flexible. Curve is asymmetric, when theabsolute value of the independent variable phase at the same time, in winning regional function growth is fast, faster loss area function. Such as the loss is more important than income can be used to solve people's actual decision-making and action.When decision-maker reference events with judgment, often due to confidence and appeardeviation, the objective probability when the event occurs in the 0. 5 or more, and people think or hope it happen again, then determine the membership degree is often higher than supposed to determine the value of the; On the other hand, tend to estimate low again. The situation here is a reference point, not judging in two, so if the subordinate function method and other established cooperation effect, attention should be paid to the establishment of membership function is binary contrast method..Use Γ type d istribution > 0 is constant (k), k is generally desirable 3,⎩⎨⎧-=---)()(1)(a x k a x k ee xf Has been discussed above is for the typical case, hybrid forms can be used in practical application, and also can be used locally,As the method of determination of membership function are different, but no matter adopt what kind of method, are discussed here and should be taken to the content of the combination, complement each other, it is not easy to cause error or incurred a loss of information, the membership function can be maximally reflect the characteristics of its present state. Fuzzy DistributionThe most common case is the real numbers R as domain for the objective things, and call the membership function of fuzzy set in the real number field as the fuzzy distribution. Several kinds of commonly used distribution are listed for the study of the practical problems to choose. According to the actual situation, make the appropriate choice. The determinations of membership function are very simple.(2) Matrix distribution and A rectangular distribution ① Partial small (Figure 2-9a)1()0x a A x x a≤⎧=⎨>⎩② Partial large (Figure 2-9b)0()1x a A x x a<⎧=⎨≥⎩③ Partial medium (Figure 2-9c)0()10x a A x a x b x b<⎧⎪=≤<⎨⎪≥⎩Figure 2-9Matrix distribution and A rectangular distribution apply to exact concepts. (2)trapezium distribution and half echelon distribution ① Partial small (Figure 2-10a)1()0x a b x A x a x b b a x b<⎧⎪-⎪=≤≤⎨-⎪>⎪⎩ ② Partial large (Figure 2-10b)0()1x a x a A x a x b b a x b<⎧⎪-⎪=≤≤⎨-⎪>⎪⎩ ③ Partial medium (Figure 2-10c)0()1x a x a a x b b a A x b x c d x c x d d c x d<⎧⎪-⎪≤<-⎪⎪=≤<⎨⎪-⎪≤<-⎪⎪≥⎩Figure 2-10(3)parabolic distribution ① Partial small (Figure 2-11a)1()0k x a b x A x a x b b a x b<⎧⎪-⎪⎛⎫=≤<⎨ ⎪-⎝⎭⎪⎪≥⎩② Partial large (Figure 2-11b)0()1k x a x a A x a x b b a x b<⎧⎪-⎪⎛⎫=≤<⎨ ⎪-⎝⎭⎪⎪≥⎩③Partial medium (Figure 2-11c)0()1k kx a x a a x b b a A x b x c d x c x d d c x d<⎧⎪-⎛⎫⎪≤< ⎪⎪-⎝⎭⎪=≤<⎨⎪-⎛⎫⎪≤< ⎪⎪-⎝⎭⎪≥⎩Figure 2-11(4)normal distribution①Partial small (Figure 2-12a)2()1()x a x aA x ex aσ--≤⎧⎪=⎨⎪>⎩②Partial large (Figure 2-12b)2()0()1x a x aA x e x aσ--≤⎧⎪=⎨⎪->⎩③Partial medium (Figure 2-12c)2()()x aA x ex σ--=-∞<<+∞Figure 2-12(5)Cauchy distribution ①Partial small (Figure 2-13a)1()1(0,0)1()x aA x x a x a βαβα≤⎧⎪=⎨>>>⎪+-⎩②Partial large (Figure 2-13b)0()1(0,0)1()x aA x x a x a βαβα-≤⎧⎪=⎨>>>⎪+-⎩③Partial medium (Figure 2-13c)+1()(0,2N )1()A x x a βαβα=>∈+-Figure 2-13(6) Ridge distribution ①Partial small (Figure 2-14a)112122121+11()-sin -<22-20>x a a a A x x a x a a a x a π≤⎧⎪⎪⎛⎫=≤⎨ ⎪⎝⎭⎪⎪⎩②Partial large (Figure 2-14b)112122120+11()+sin -<22-21>x a a a A x x a x a a a x a π≤⎧⎪⎪⎛⎫=≤⎨ ⎪⎝⎭⎪⎪⎩③ Partial medium (Figure 2-14c)21221211112122120-+11+sin --<-22-2()1-<<+11-sin -<22-20>x a a a x a x a a a A x a x a a a x a x a a a x a ππ≤⎧⎪⎛⎫⎪≤ ⎪⎪⎝⎭⎪=⎨⎪⎛⎫⎪≤ ⎪⎪⎝⎭⎪⎩Figure 2-14The above six fuzzy distributions are given, and the best one can be selected according to the characteristics of subjects under discussion. In other words, according to the statistics and tracing roughly curve, then comparing with six fuzzy distributions, the closest one can be chosen. This can easily write out the membership function expression.For instance, to establish membership function of young people, we can according to thestatistics trace roughly curve about membership function of young people. Then the closest one is Cauchy distribution:1()1(0,0)1()x aA x x a x a βαβα≤⎧⎪=⎨>>>⎪+-⎩So the Cauchy distribution can be chosen as membership function of young people. When β=2,α=251,we can establish membership function of young people: 211()2515x a x aA x x ≤⎧⎪⎪>=⎨-⎛⎫⎪+ ⎪⎪⎝⎭⎩.Further Study on the Determination of Membership FunctionThe determination of membershp function should not only describe the fuzziness of the information ,but also correctly describe psychological measure of main body and take the limitation of cognition ability into account . In this paper ,the simple and feasible methods of measuring membership function are presented. These methods are used to measure the fuzzinessof psychological measurement when human being is making decision. The description function is presetned according to the condition. These methods can describe fuzzy information more exactly and make decision more rationally.Objective things and their uncertainty exist in different degrees ,This uncertainty implication in the objective performance and subjective recognition. In essence, the uncertainty is an objective, subjective, relative to the identification and characterization of objective information is influenced by subjective factors, is affected by the main psychological factors, and then show the cognitive level and description method of difference. The general method of determining the membership function is more from the following two angles; Itself or focuses on the description information of fuzziness, identification and characterization methods of fuzziness, from how to eliminate or reduce the subjective arbitrariness composition for research, while ignoring the main body and decisive psychological thinking and judgment, making the determination of membership function is imperfect.As production system, social system, on the other hand, large scale and complicated, makes itvery difficult to forecast and decision. Due to determine prediction accuracy and decision-making is the key to success, so should be able to correctly describe the person's psychology measure of fuzziness. For such a problem, today's decision theory from rational decision-making behavior of two branches of research, but in the real practical life, the rational decision-making and behavior is not consistent.Based on these two aspects into account, trying to apply the combination of rational decision-making and behavior, through the combination of qualitative and quantitative method, find a can reflect the subject psychological measurement method, from to describe the phenomenon and avoid should not appear two angles, the fuzzy membership to describe is more rationality of information, make people prediction and decision under the fuzzy state of the deviation is smaller.conclusionThe brain as the main body of understanding and transforming the objective world, it is reflection of natural phenomenon tend to be vague. This fuzzy from the ambiguity of the object itself, also have meet Angle ambiguity, research on membership function to determine how on the fuzzy information processing work, involving the main body of membership to determine the impact of research less. If not, consider the human factor analysis results would be impractical, even lead to unreasonable judgments, recognition, or decision result. In this paper, the understanding of the subject of how to reduce the defects affect the determination of membership function were 5 Li Gujun detail, such as: further discussion to the method of subordinate function determine the analysis of the three selection principles are given, but the membership function parameters in remains to be further discussed according to the specific problem. This article research can also be used as a description of the main body of psychological measurement, the method of research results can make rational decisions and behavior decision-making is consistent, so that the executive deviation smaller, forecast and decision more reasonable.。
- 1、下载文档前请自行甄别文档内容的完整性,平台不提供额外的编辑、内容补充、找答案等附加服务。
- 2、"仅部分预览"的文档,不可在线预览部分如存在完整性等问题,可反馈申请退款(可完整预览的文档不适用该条件!)。
- 3、如文档侵犯您的权益,请联系客服反馈,我们会尽快为您处理(人工客服工作时间:9:00-18:30)。
模糊数学教程第6章确定隶属函数的方法确定隶属函数是模糊数学中的一项重要任务,它决定了模糊集合如何
描述和应用。
本文将介绍几种常用的确定隶属函数的方法。
基于专家经验的方法是最常见的确定隶属函数的方法之一、通常,一
些领域的专家会通过自己的经验和知识来确定隶属函数的形状和参数,以
达到最佳的模糊集合描述效果。
例如,在模糊控制系统中,专家可以通过
对系统的分析和调试来确定隶属函数的形状,从而实现对系统的精确控制。
基于数据分析的方法是一种较为客观的确定隶属函数的方法,它通过
对已有数据的统计分析来确定隶属函数的形状和参数。
通常,需要收集一
定数量的数据样本,并对这些数据进行分析,确定隶属函数的形状和参数。
例如,在模糊分类问题中,可以通过对已有分类数据的统计分析来确定隶
属函数,从而实现对未知样本的分类。
基于模糊聚类的方法是一种将隶属函数与模糊聚类相结合的方法,它
通过对数据样本进行聚类分析来确定隶属函数的形状和参数。
通常,需要
先对数据进行模糊聚类,确定聚类结果,然后使用聚类结果来确定隶属函数。
例如,在模糊图像分割中,可以通过对图像像素进行模糊聚类,确定
图像的不同区域,然后使用聚类结果来确定图像的隶属函数,从而实现图
像分割。
基于优化算法的方法是一种通过优化算法来确定隶属函数的形状和参
数的方法。
通常,需要将需要确定的隶属函数作为优化目标函数,利用其
中一种优化算法来求解最优解,从而确定隶属函数的形状和参数。
例如,
在模糊最优化问题中,可以将需要确定的隶属函数作为目标函数,使用遗
传算法或粒子群算法等优化算法来求解最优解,从而确定隶属函数。
以上是一些常用的确定隶属函数的方法,不同的方法适用于不同的问题和场景。
在实际应用中,可以根据具体情况选择适合的方法来确定隶属函数,以达到最佳的模糊集合描述效果。