频响函数用于转子振动信号诊断
振动试验共振频率的判定
振动试验共振频率的判定在振动试验中,通常会通过施加外力或者激励信号来激发被试物体的振动。
当被试物体的振动频率与激励信号的频率相同或者接近时,就会发生共振现象,此时物体的振幅会显著增大,振动现象也会变得非常明显。
共振频率是指在共振条件下被试物体的振动频率,可以通过振动试验来测量和判定。
判断共振频率的方法有很多种,下面我们将介绍一些常用的方法:1. 频率扫描法:这是一种比较常用的方法,通过改变激励信号的频率,观察被试物体的振动响应,当振幅显著增大时,可以认为共振频率已经达到。
这种方法简单直观,适用于较为简单的振动系统。
2. 模态分析法:对于复杂的振动系统,我们可以利用有限元方法进行模态分析,得到被试物体的振动模态和特征频率,通过比较振动模态和激励信号的频率,可以得到共振频率。
3. 频率响应函数法:该方法主要用于计算机辅助振动试验,通过对激励信号和被试物体振动响应信号进行傅里叶变换,得到频率响应函数,从而确定共振频率。
判断共振频率的准确性对于振动试验的结果具有至关重要的影响,因此在进行共振频率的判定时,需要注意以下几点:1. 实验条件的选择:在进行振动试验时,需要选择合适的激励信号和测量设备,确保能够准确地获取被试物体的振动响应信号。
2. 数据处理的准确性:在进行振动试验后,需要仔细分析和处理实验数据,确保得到的共振频率结果准确可靠。
3. 系统参数的识别:在进行振动试验之前,需要对被试物体的系统参数进行准确的识别和估计,以便更好地判断共振频率。
4. 实验结果的验证:为了验证共振频率的判定结果的准确性,可以采用不同的方法进行验证,例如改变激励信号的频率,观察共振现象的变化。
总的来说,共振频率的判定是振动试验中非常重要的一环,准确地判断共振频率可以帮助我们更好地了解物体的振动特性,优化设计和改进结构。
在进行共振频率的判定时,需要注意实验条件的选择、数据处理的准确性、系统参数的识别和实验结果的验证,确保得到准确可靠的结果。
故障诊断实验——转子实验台振动信号的时域、频域分析

故障诊断第一次实验报告——转子实验台振动信号的时域、频域分析1.由时域信号得出震动的平均值、方差、峭度信息程序代码如下:y=Data(1:6000,1);y=y';[a,b]=xcorr(y,'unbiased');figure(1);plot(b,a);grid;xlabel('位移信号自相关')figure(2);x=0:1/2560:1;plot(x,mean(y));gtext('平均值');hold on;figure(3);plot(x,var(y));gtext('方差');hold on;figure(4);plot(x,kurtosis(y));gtext('峭度');位移信号当转速为600r/min时当转速为1000r/min时当转速为1500r/min时速度信号速度为600速度1000速度15001.由频域信号得出信号的傅里叶变换、功率谱密度信息程序代码如下:t=0:1/2560:1;f=Data;f=f';y=fft(f,82944);m=abs(y);f1=(0:length(y)/2-1)'*2560/length(y); %计算变换后不同点对应的幅值figure(1);plot(f1,m(1:length(y)/2));ylabel('幅值的模');xlabel('时间(s)');title('原始信号傅里叶变换');grid;p=y.*conj(y)/82944; %计算功率谱密度ff=(0:length(y)/2-1)'*2560/length(y); %计算变换后不同点对应的频率值figure(2);plot(ff,p(1:length(y)/2));ylabel('幅值');xlabel('频率(Hz)');title('功率谱密度');grid;位移信号速度600速度1000速度1500速度信号速度600速度1000速度1500。
飞机发动机转子振动特征提取方法诊断
的信息熵由下式给出
公式中,是10500转/分。
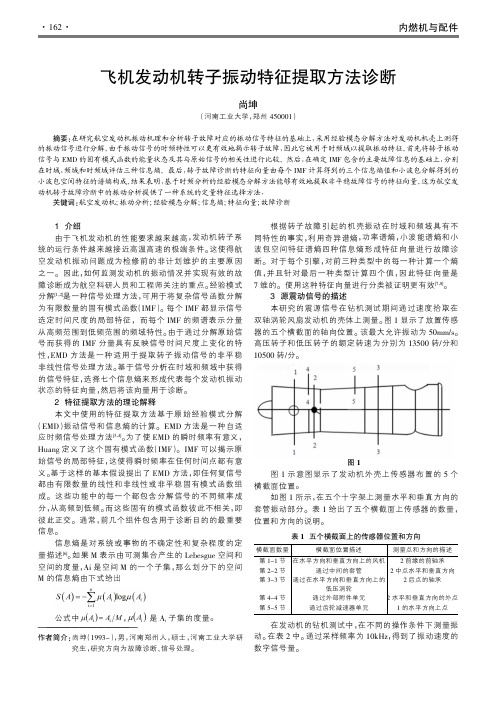
图1
图1示意图显示了发动机外壳上传感器布置的5个横截面位置。
如图1所示,在五个十字架上测量水平和垂直方向的套管振动部分。
表1给出了五个横截面上传感器的数量,位置和方向的说明。
表1五个横截面上的传感器位置和方向
横截面数量横截面位置描述测量点和方向的描述
第1-1节
第2-2节
第3-3节
第4-4节
第5-5节
在水平方向和垂直方向上的风机
通过中间的套管
通过在水平方向和垂直方向上的
低压涡轮
通过外部附件单元
通过齿轮减速器单元
2前缘的前轴承
2中点水平和垂直方向
2后点的轴承
2水平和垂直方向的外点
1的水平方向上点在发动机的钻机测试中,在不同的操作条件下测量振
————————————————————
作者简介:尚坤(1993-),男,河南郑州人,
熵计算结果的一个例子。
143.12158.93157.81167.70170.31161.03
(a)IMF分量从1到4(b)IMF分量从5到8
图2正常发动机的EMD分析结果
(a)IMF分量从1到4(b)IMF分量从5到8
图3故障发动机的EMD分析结果。
浅析航空发动机叶片振动的影响
浅析航空发动机叶片振动的影响摘要航空发动机因为其工作环境的特殊性,对于叶片有着较高的要求。
在文中则主要是针对航空发动机叶片振动及频率测量展开分析,以期可以为航空发动机的设计提供借鉴。
关键词航空发动机;叶片;振动航空发动机是一项追求极限的系统工程,涉及材料、力学、热学等物理方面的理论。
随着现代发动机技术突飞猛进的发展,作为发动机核心部件的压气机压比被设计的越来越高,为了满足发动机整体的大推重比要求,对压气机的效率的要求也越来越高。
压气机工况极其复杂,复杂的工况主要对压气机叶片性能产生消极影响。
压气机转子叶片需要在高负荷、高转速、高振动的环境下工作。
复杂的工作环境造成压气机叶片疲劳失效故障的原因多样化,这一直是世界航空发动机研究者重点研究的方向。
通过对航空发动机压气机叶片失效的分析表明,导致压气机叶片失效的因素很多,颤振引起的失效是叶片故障的主要因素。
航空发动机颤振的机理以及错频装配技术已经获得了广泛深入的研究。
但面对复杂的错频装配工艺技术约束条件,航空发动机主机装配单位的叶片排频装配技术还很薄弱,尤其是面对批产机型的压气机装配,传统的依靠人力装配已经显得效率过于低下压气机转子叶片的装配已经成为整机装配的重要影响因素,所以全新依托于计算机技术手段并应用于装配生的压气机叶片排频技术研究意义更显重大。
1 叶片排频技术应用意义叶片排频技术通过对待装配叶片按照每个叶片的固有频率和质量,遵循装配工艺技术条件进行装配,达到叶片在频率上实现错频,在质量矩上达到平衡,防止发动机产生颤振的方法研究。
我国某型涡喷发动机通过对压气机转子装配工艺进行叶片排频技术改进,在长时间使用过程中,减少了发动机颤振的发生。
航空发动机领域的学者得出结论,航空发动机转子叶片按照频率差和静质量矩进行优化排序对于减小叶片装配造成的不平衡量以及防止发动机颤振具有积极的意义。
目前国内的叶片排频技术主要是基于单纯的计算机算法进行研究,比如:组合优化方法、一般遗传算法、混合遗传算法等。
旋转机械的振动故障检测与诊断

旋转机械的振动故障检测与诊断旋转机械是指主要功能是由于旋转而完成的机械。
如电动机,,离心风机,离心式水泵,汽轮机,发电机等都属于发电机的范围。
从力学的角度分析,转子系统分为刚性和柔性转子。
转动频率低于转子一阶横向固有频率的转子为刚性转子。
转动频率高于转子一阶横向固有频率的转子为柔性转子,如燃气轮机。
在工程学上对应转子一阶横向固有频率的转速成为临界转速。
在我们分析时候经常会遇到在各种各样的问题,比如在信号的分析上可以按照信号的处理方式的不同可以分为幅域分析,时域分析以及频域分析。
信号的早期分析只是在波形的幅值上进行,如计算波形的最大值,最小值,平均值,有效值等,后而进行波形的幅值的概率分布。
在幅值上的各种处理通常称为幅域分析,信号波形是某种物理量随时间变化的关系。
研究信号在时域内时域的变化或分布称为时域分析。
频域分析是确定信号的频域结构,即信号中包含哪些频率成分,分析的结果是以频率为自变量的各种物理量的谱线或是曲线。
不同的分析的方法是从不同的角度观察,分析信号,使信号的处理的结果更加丰富。
从某种意义上讲,振动故障的分析诊断的任务就是读谱图,把频谱上的每个频谱分量与监测的机器的零部件对照联系,给每条频谱以物理解释。
主要的内容包括:1 振动频谱中存在哪些频谱分量?2 每条频谱分量的幅值多大?3 这些频谱分量彼此之间存在什么关系?4 如果存在明显高幅值的频谱分量,它的准确的来源?它与机器的零部件对应关系如何?5如果测量相位,应该检查相位是否稳定?、工频成分突出,往往是不平衡所致。
2X频为主往往是平行不对中以及转子存在裂纹。
1/2分频过大,显示涡轮涡轮失稳。
0.5X~0.8X是流体旋转脱离。
特低频是喘振。
整数倍频是叶片流道振动。
啮合成分高是齿轮表面接触不良。
谐波丰富是松动。
边频是调制。
分频是流体激荡,摩擦等。
大型旋转机械常见的故障原因分类如下:1 设计原因;设计不当,运行时发生强迫振动或是自激振动;结构不合理,应力集中;设计工作转速接近或是落入临界转速区;热膨胀量计算不准,导致热态对中不良。
机械振动信号的特征提取与诊断

机械振动信号的特征提取与诊断机械振动信号是机械故障诊断中非常重要的参数之一,它可以反映机械设备的运行状态和故障情况。
因此,有效地提取机械振动信号的特征并进行诊断,对于机械故障预测和维护非常有意义。
一、机械振动信号的特征机械振动信号通常包括时间域信号、频率域信号和时频域信号。
通过这些信号可以得到许多与机械运行状态相关的特征。
1. 时间域信号时间域信号是指机械振动信号在时间轴上的变化过程。
通过对时间域信号进行分析,我们可以得到以下特征:(1) 峰值信号: 时间域信号中的峰值表示机械振动的最大值或最小值,可以反映机械设备振动的强度。
(2) 均方根信号: 均方根信号反映了机械振动的整体能量水平。
(3) 自相关函数: 自相关函数可以用来分析信号的周期性,如果自相关函数呈现出周期性,则说明信号存在周期性振动。
2. 频率域信号频率域信号是指机械振动信号在频率轴上的分布情况。
通过对频率域信号进行分析,我们可以得到以下特征:(1) 频率谱: 频率谱是指机械振动信号在频率轴上的分布情况,可以用来判断是否存在故障频率。
(2) 峰值频率: 峰值频率是指频谱中最大振幅对应的频率,可以用来判断机械振动信号是否存在某个重要故障频率。
(3) 能量比: 能量比是指不同频段的信号能量之比,可以用来判断机械设备是否优化,或者是否存在故障。
3. 时频域信号时频域信号是指机械振动信号在时频平面上的分布情况。
通过对时频域信号进行分析,我们可以得到以下特征:(1) STFT谱图: STFT谱图可以用来分析机械振动信号的瞬时频率,通过确定峰值频率在时间轴上的分布情况,可以识别出一些故障。
(2) 小波变换: 小波变换可以将信号分解成多个频带,不同频带表现出的特征不同,可以用来判断不同故障类型。
(3) Wigner-Ville分布: Wigner-Ville分布是时频域分析中的一种重要方法,它可以提取出机械振动信号的瞬时频率和瞬时振幅,可以识别出一些瞬时故障。
振动故障诊断及其转子平衡
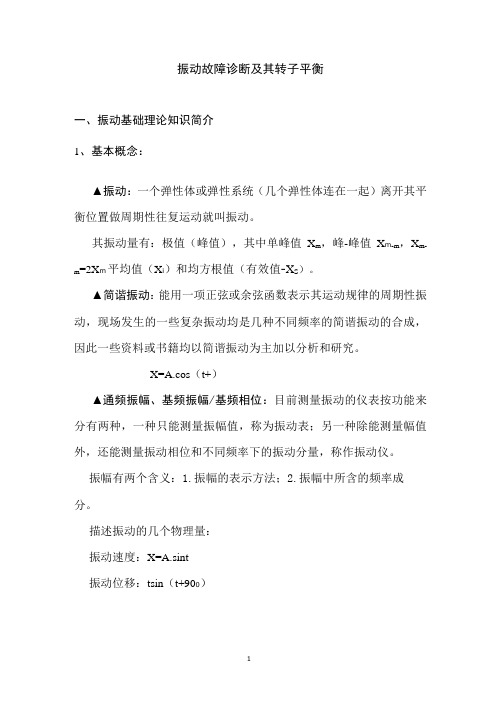
振动故障诊断及其转子平衡一、振动基础理论知识简介1、基本概念:▲振动:一个弹性体或弹性系统(几个弹性体连在一起)离开其平衡位置做周期性往复运动就叫振动。
其振动量有:极值(峰值),其中单峰值X m,峰-峰值X m-m,X m-=2X m平均值(X i)和均方根值(有效值-X S)。
m▲简谐振动:能用一项正弦或余弦函数表示其运动规律的周期性振动,现场发生的一些复杂振动均是几种不同频率的简谐振动的合成,因此一些资料或书籍均以简谐振动为主加以分析和研究。
X=A.cos(t+)▲通频振幅、基频振幅/基频相位:目前测量振动的仪表按功能来分有两种,一种只能测量振幅值,称为振动表;另一种除能测量幅值外,还能测量振动相位和不同频率下的振动分量,称作振动仪。
振幅有两个含义:1.振幅的表示方法;2.振幅中所含的频率成分。
描述振动的几个物理量:振动速度:X=A.sint振动位移:tsin(t+900)振动加速度:2tsin(t+1800)X、Y、Z:相同,A(最大位移),A,2A;Y比X矢量超前900;Z比X矢量超前1800。
表示振动强度,位移是最有效的;表示振动平均能量的振动速度是有效的;表示振动冲击强度,振动加速度是最有效的。
极值(幅值)、有效值、平均值的关系:36001Xi■Xm2,2◎极值(幅值):单峰值()1峰峰值—17平均值:()一1T x(t)dt■0.636AT0:1T均方根值(有效值):=亍・x2(t)dt■0.707A F o三者之间的关系:双振幅近似等于3倍的有效值或平均值。
轴承振动烈度是以振动速度的均方根值,我们现在一直沿用的是轴承振动位移峰峰值,国外和国内某些制造厂有用轴承烈度表示P-P振动,上述换算关系只是指单一频率的振动,如果是混频振动不能直接换算。
▲通频振幅:用普通振动表(不带滤波器)测得的振幅值是各种频率振动分量的叠加值,如果振幅是由几种不同频率的周期振动叠加而成,其叠加后的振动仍是周期振动,在各个周期内保持不变,仪表指示稳定,如果表记示值不稳定,说明由非周期成分存在。
物理实验技术中的频率响应与频谱分析方法

物理实验技术中的频率响应与频谱分析方法在物理实验中,我们常常需要研究材料或装置的频率响应,以了解其振动或信号传输的特性。
频率响应的研究可以帮助我们更好地理解物理系统的行为,并为实验设计和数据分析提供指导。
而频谱分析方法则是评估频率响应的重要工具之一。
频率响应是指一个系统或装置对输入信号在不同频率上的响应程度。
在物理实验中,这通常涉及到测量信号的振幅和相位随频率的变化。
例如,我们可能想了解一个材料对声波的传递特性,或者一个电子元件对电信号的传导情况。
频率响应可以帮助我们确定系统的共振频率,寻找系统的自然频率以及阻尼特性。
为了测量频率响应,我们通常需要使用一些仪器和技术来提供准确的信号发射和接收。
其中最常见的方法是使用函数发生器产生一个可变频率的信号,并通过一个传感器或探头测量输出信号的幅度和相位。
这样做可以得到一个频率响应曲线,显示出系统在不同频率上的响应。
频率响应曲线通常以图表的形式展示,横轴表示频率,纵轴表示幅度或相位。
曲线的形状可以给出有关系统特性的重要信息。
例如,当一个系统在某个频率上具有很高的响应时,我们可以说它处于共振状态。
而当幅度或相位随频率的变化不稳定或不连续时,我们可以怀疑系统存在失真或不稳定情况。
为了更详细地分析频率响应曲线,我们会使用频谱分析方法。
频谱分析是一种将时域信号转换为频域信号的技术,可以将信号分解成不同频率成分的能力。
这个技术在物理实验中广泛应用于研究波动现象、振动特性以及电信号的频率分布。
频谱分析方法涉及到信号的傅里叶变换,这是一种将信号从时域转换为频域的数学方法。
傅里叶变换可以将信号分解成一系列正弦和余弦函数的叠加,每个函数对应一个特定的频率。
通过傅里叶变换,我们可以看到信号中各个频率成分的幅度和相位信息。
在实际应用中,频谱分析常常使用快速傅里叶变换(FFT)算法来处理信号。
这种算法可以在较短的时间内计算出信号的频谱,使得频谱分析可以在实时或准实时的条件下进行。
转子系统振动信号处理及故障诊断算法研究
转子系统振动信号处理及故障诊断算法研究随着工业自动化程度的不断提高,各种机械设备的使用越来越广泛,而机械故障诊断则成为了一个重要的领域。
在机械设备运行过程中,经常会出现各种故障,而一旦出现故障,会对生产工艺造成不良影响,严重的甚至会导致机械设备报废。
因此,如何及时、准确地诊断机械故障,成为了工业生产过程中的难点之一。
转子系统是机械设备中的重要部分,转子系统的振动信号对于故障诊断有着重要的作用。
目前,转子系统振动信号处理及故障诊断算法是转子系统故障诊断的一个重要研究课题。
转子系统振动信号处理是将转子系统振动信号进行处理和分析,以便于更好地进行故障诊断。
常用的信号处理方法有时域分析、频域分析、小波分析、功率谱分析等。
时域分析是指将振动信号在时间上进行分析。
常用的时域分析方法有:均值、标准差、偏度、峰值、波形因子等。
时域分析方法适用于信号周期性较强的情况下,但无法反映出信号的频域特征。
频域分析则是将振动信号在频域上进行分析。
常用的频域分析方法是傅里叶变换和小波变换。
其中,小波分析是一种新兴的频域分析方法,相较于傅里叶变换,它能够在时域和频域上同时表现信号的特征,并且小波变换能够提供多分辨率的信息,以更好地反映出信号的局部特征和时变特性。
功率谱分析是将振动信号进行频域分析,再将频域信号平方后求和,所得到的结果就是信号的功率谱。
通过对功率谱的分析,能够得到信号的主频率、谐波频率、谐波振幅等信息。
在转子系统振动信号的处理过程中,如果初步处理得当,就可以与故障信息挂钩,从而进行故障诊断。
常见的故障诊断算法有模式识别算法、神经网络算法、遗传算法等。
模式识别算法是一种基于模式匹配的算法。
通过对样本数据的学习,生成模型集合,之后通过对新数据进行比对,找出与之最相似的模型,最终确定所属的类别。
神经网络算法是一种模拟人类神经系统进行信息处理的算法。
通过对样本数据进行学习和训练,生成一种具有分类、识别等功能的神经网络。
遗传算法是一种基于生物遗传学思想的计算模型。
强度振动实验报告(包含梁模态实验和转子动力学实验)

结构强度与振动实验技术报告学院:能源与动力学院姓名:学号:SX1导师:指导教师:沈承同组人员:2015年6月实验一 单自由度系统的动力吸振实验一、实验目的通过对单自由度系统施加动力吸振器,减小其振动量,观察实验现象,灵活掌握动力减振实验方法。
二、实验内容基于二自由度反共振原理设计动力吸振的基本理论,测试单自由度系统的固有频率,了解动力吸振器的设计过程,采用动力吸振器后单自由度系统的减振效果。
三、实验原理所谓吸振就是将原系统的振动能量转移到附加系统,从而使原系统的振动减小。
动力吸振器利用联结在振动系统上的附加质量的动力来实现吸振,即将原振动系统的振动能量转移到附加的弹簧质量振动系统上了。
单式动力吸振器是一个单自由度振动系统,与单自由度振动主系统一起构成二自由度系统,力学模型如右图所示。
主系统质量1m ,刚度1k ,位移1y 。
吸振器质量m ,刚度k ,位移y 。
激扰力为sin F t ω。
系统的运动微分方程如下(无阻尼):()1112122sin m y k k y k y F t ω++-=()122210m y k y y +-=设其稳态响应为11sin y A t ω=22sin y A t ω=代入得到:()()()2221222121222F k m A kk m km kωωω-=+---()()22222121222Fk A k k m k m k ωω=+--- 令111/k m ω=——主系统的固有角频率; 222/k m ω=——动力吸振器的固有角频率; 1/st F k δ=——主系统的静位移;21/m m μ=——质量比值;上式可以改变为无量纲形式:()()()()()22122222122211/1//1//stA ωωδμωωωωωωμωω-=⎡⎤⎡⎤+---⎣⎦⎣⎦()()()()2222221222111//1//stA δμωωωωωωμωω=⎡⎤⎡⎤+---⎣⎦⎣⎦当单式动力吸振器的固有角频率2ω等于外力的角频率ω时,外力正好等于动力吸振器的弹性恢复力22k A ,此时设备不振动,从而达到了减震的目的。
基于Matlab的转子故障振动信号分析
毕业设计(论文)`题目:基于Matlab的转子故障振动信号分析院系机械工程系专业班级学生姓名指导教师基于Matlab的转子故障振动信号分析摘要随着机械行业的日益发展,转子等旋转机械的故障日渐趋多,转子的故障诊断技术受到越来越多的重视,并在世界范围内取得了长足的进步。
作为大型机器中不可或缺的部件,有着举足轻重的作用,但自身也存在缺点:造价很高,结构纷繁杂乱,如果出现受损的情况,则需要很长的时间来维修,故对其安全可靠性具有较高的要求。
对发电机及其转子进行状态监测和信号分析,避免更大事故的产生,对于安全生产具有重要意义,对于工业发展具有积极的推动作用。
转子故障类型主要有四种:转子不平衡、转子不对中、动静碰摩以及油膜涡动与振荡。
首先明确转子的故障类型及故障机理,掌握不同类型的故障特征,能够准确区分转子的几种故障类型。
然后应用Matlab软件,在Matlab软件中建立起转子故障图形程序,利用Matlab中的程序对仿真信号及故障数据进行分析,包括信号的时域图、频域图以及轴心轨迹图,最后与已知的故障机理进行比较,检验其正确性。
关键字:转子;Matlab;故障机理;信号分析ANALYSIS OF ROTOR FAULTVIBRATION SIGNAL BASED ONMatlabAbstractWith the development of the machinery industry, the rotor and other rotating machinery are becoming more and more common. Rotor fault diagnosis technology has been paid more and more attention, and has made great progress in the world. As an indispensable part of the large machine, although it has a pivotal role, it comes with own shortcomings: high cost, complex structure, a long time to repair the damaged. Therefore, it requires high safety and reliability. The condition monitoring and signal analysis of the generator and its rotor are of great significance to the safety production, and they play a positive role in promoting the development of the industry.There are four kinds of rotor fault types: rotor unbalance, rotor misalignment, static and dynamic rub impact and oil whirl and oscillation.First, the fault types and fault mechanism of the rotor are clearly defined, and the fault characteristics of different types of faults can be mastered. Establish a rotor failure graphics program in the Matlab software,and the use of Matlab program for the simulation of signal and fault data analysis includes the signal time domain, frequency domain and the axis trajectory Finally known failure mechanism were compared, to test its correctness.Keywords: rotor; Matlab; failure mechanism;signal analysis目录摘要 (I)Abstract (II)1绪论 (1)1.1课题背景 (1)1.2 国内外发展概况 (2)1.3 Matlab软件简单介绍 (2)1.4 课题研究内容 (3)1.5 本章小结 (4)2转子系统典型故障机理与特征 (5)2.1 转子不平衡 (5)2.2 转子不对中 (7)2.3 动静碰摩 (9)2.4 油膜涡动与油膜振荡 (10)2.5本章小结 (11)3振动信号分析方法及仿真分析 (12)3.1信号的时域分析方法 (12)3.2 信号的频域分析方法 (13)3.3 信号的轴心轨迹图 (14)3.4 仿真分析 (14)3.6本章小结 (15)4基于Matlab的转子故障振动信号分析 (17)4.1数据分析 (17)4.1.1转子不平衡 (17)4.1.2动静碰摩 (19)4.1.3油膜涡动和油膜振荡 (21)4.2本章小结 (23)5结论与展望 (24)5.1结论 (24)5.2展望 (25)参考文献 (26)致谢 (29)附录A 基于Matlab的转子故障振动信号分析仿真程序 (30)1绪论旋转机械是最常用的机械设备之一,如汽轮机、航空发动机、发电机等。
频响特性曲线_模态测试之频响函数

频响特性曲线_模态测试之频响函数在进⾏模态测试时,核⼼就是测试结构输⼊点到相应点的频响函数,最终通过各种算法从频响函数中提取我们所关注的信息(频率、阻尼、振型...)。
本⽂我们就详细探讨⼀下有关频响函数的问题。
1、什么是频响函数(FRF)频响函数定义为结构的输出响应和输⼊激励⼒之⽐。
将测试的时域数据转换到频率的数据后,数据会显⽰为复数形式(实部和虚部、幅值和相位),测量的多条频响函数为了⽅便统计,通常以矩阵形式表⽰。
下标可以⽅便地确定某个FRF输⼊-输出的位置,频响函数中第⼀个下标表⽰输出响应位置,第⼆个下标表⽰输⼊激励位置,下标k表⽰阶数。
所以H ij表⽰由‘j’点输⼊引起‘i’点响应的频响函数。
FRF元素的分⼦中包含留数信息,与模态振型直接相关;分母包含极点信息,与频率和阻尼相关。
因此,从频响函数矩阵可以得到系统全部的模态信息。
将分⼦留数信息展开可得式中右侧⽅程,可以得出以下结论:l 通过⽅程中分⼦信息我们可以发现:留数的值与输⼊位置的模态振型值相关,不同输⼊-输出位置的留数值是不同的,即振型值不同,也就是说留数值(振型)具有局部性,在做⼤型模态试验时需要多布置响应点来拾取局部振型,从⽽把振型更好的表达出来。
l 通过⽅程中分母信息我们可以发现:分母中包含极点信息是保持不变,即极点信息(频率阻尼)不依赖于输⼊输出的位置。
理论上讲,在避开节点的情况下⼀个测量位置即可测量出所有的模态频率。
2、什么是频响函数具有哪些性质l 频响函数是系统的固有特性,与系统本⾝有关,与激励、响应等外界因素没有关系。
l 频响函数具有互易性,即Hij=Hji,也就是说,‘j’点单位激励⼒在‘i’点引起的响应等于‘i’点单位激励⼒在‘j’点引起的响应,说明频响函数矩阵是对称的。
l 频响函数是复值函数,因⽽可以⽤幅值与相位或者实部与虚部表⽰,因此频响函数具有幅频、相频和实频、虚频等多种表现形式。
当幅频曲线和相频曲线同时显⽰时,称为伯德图。
声学基础:频率响应函数
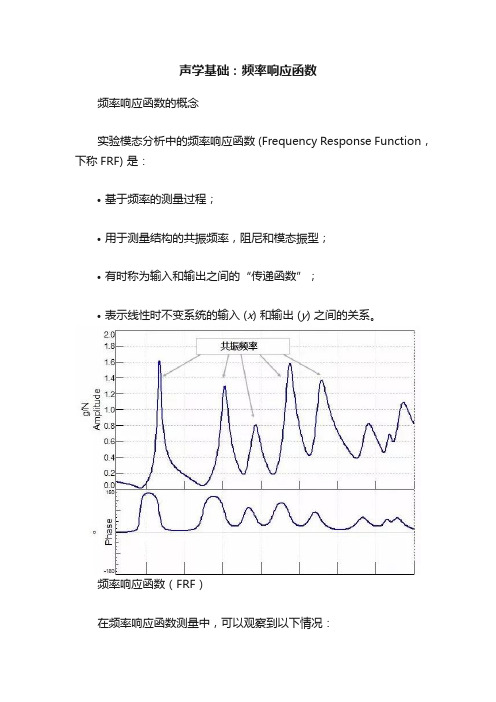
声学基础:频率响应函数频率响应函数的概念实验模态分析中的频率响应函数 (Frequency Response Function,下称FRF) 是:•基于频率的测量过程;•用于测量结构的共振频率,阻尼和模态振型;•有时称为输入和输出之间的“传递函数”;•表示线性时不变系统的输入 (x) 和输出 (y) 之间的关系。
频率响应函数(FRF)在频率响应函数测量中,可以观察到以下情况:•共振:峰值表示被测结构的固有频率;•阻尼:阻尼与峰的宽度成比例。
峰值越宽,阻尼越大;•模式振型:获取到结构上的公共参考的多个FRF的幅度和相位用于确定模式振型。
实验模态分析中频率响应函数许多类型的输入激励和响应输出可用于计算实验FRF,下面举一些例子:•声学系统:Q(体积加速度)输入和声压输出 (Pa);•机械系统:输入为力,输出为加速度,速度或者位移;•上述两者的混合系统。
对于机械结构的实验模态分析,通常输入是力,输出是加速度,速度或位移。
输入及测量可以通过:•力锤•激振器输出响应可以通过如下方式测量:•加速度计:测量振动;•激光测振仪:测量物体表面速度。
一般来说,输入力的频谱(X)应该是平坦的,即均匀激励所有频率。
当查看响应(Y)时,响应中的峰值表示被测结构的自然/共振频率。
如下图所示。
因为FRF响应被“归一化”到输入,所以得到的FRF函数中的峰值是测试对象的共振频率。
FRF中的数字信号处理术语在命名法中,FRF通常由单个大写字母H表示。
输入为X 且输出为Y。
H,X和Y都是函数与频率的关系。
FRF是输入(x)和输出(y)的互功率谱(Sxy)除以输入的自功率谱(Sxx)。
自功率谱Sxx 是输入频谱与其自身的复共轭,它成为一个全实数函数,不包含相位。
互功率谱Sxy是输出频谱和输入频谱的复共轭,包含幅度和相位。
评估RFR的质量01计算Coherence相干性是函数与频率的关系,表示输出多少是由FRF中的输入引起的。
它可以作为FRF质量的指标,它能够评估FRF从测量到重复相同测量的一致性。
运用时域、频域、包络分析方法诊断电动机振动异常

运用时域、频域、包络分析方法诊断电动机振动异常电动机的状态监测是其维护工作的重要部分,对于如何运用状态监测工作指导电动机的维护检修是设备管理人员关注的重点之一;对于大批量的电动机维护来说,正确运用时域、频域和包络频谱分析其振动状态,显得尤为必要。
标签:频域;时域;包络频谱0 引言某大型炼化企业大量电动机的运行检修工作中出现不同的问题,前期多通过听诊和普通的监测手段进行分析电机运行情况,往往出现分析偏差较大的情况,有电动机在运行中出现故障的现象。
通过采用振动图谱分析法来降低故障率,图谱分析一般有时域、频域、和包络频谱分析。
振动时域分析是指控制系统在一定的输入下,根据输出量的时域表达式,分析系统的稳定性、瞬态和稳态性能,通过波形的变化来判断振动信息;振动频域分析是指在频域范围内应用图解分析法评价系统性能的方法;包络解调分析是指将采集的振动信号进行解调后产生包络线,并对其进行相应变换后做频谱分析,振动波形和频谱的变化会在一定程度上反映出电动机振动的异常情况。
1 电动机振动基础及故障诊断要求電动机的振动一般有电磁振动、机械振动,电动机的机械振动多表现为动不平衡、对中不良、轴承装配松动、机械故障引起的振动等。
常用的振动分析方法有时域分析、频域分析、幅值域分析和相域分析等,本文通过几个案例着重讲解电动机振动异常时的时域、频域和包络频谱特征及振动诊断处理方法避免故障的发生。
掌握电动机状态监测分析和诊断技术,处理必备的专业技术知识外,必须要掌握电动机的基础数据,这其中包括电动机额定电压、额定功率、额定转速及监测时的转动速度,电动机运行时长,电动机所用润滑脂特性、润滑五定执行情况、机泵间联轴器类型,电动机的安装方式和支撑形式,电动机是否经历过大修、大修检修内容有哪些、是否处理过电机转子、定子、线圈等故障,再结合现场运行状态监测进行比较全面、比较合理的分析和诊断。
2 电机振动异常时的波形特征时域波形的变化分析多是指振动达到不满意时的波形分析,对未达到不满意值,但变化异常的波形也要进行相应进行分析,如图1、2、3示。
机械振动学中的振动响应与频率响应函数
机械振动学中的振动响应与频率响应函数机械振动学是研究物体在受到外力作用时产生振动的学科,其中振动响应与频率响应函数是研究振动系统动态响应的重要概念。
振动是物体由于受到外力激励而发生的周期性运动,而振动响应则是描述物体在振动作用下的运动状态。
频率响应函数则是描述系统在不同频率下的响应特性。
本文将从振动响应与频率响应函数这两个方面展开探讨。
振动响应是描述物体在受到外力激励下的振动状态。
当物体受到外力作用时,会出现振动现象。
振动响应包括位移响应、速度响应和加速度响应。
位移响应描述物体在振动过程中的位移变化,速度响应描述物体在振动过程中的速度变化,加速度响应描述物体在振动过程中的加速度变化。
振动响应可以通过模型分析或实验测试进行研究,掌握物体在振动过程中的响应规律对于优化设计和预防振动损伤具有重要意义。
频率响应函数是描述系统在不同频率下的响应特性的函数。
在振动系统中,频率响应函数通常表示为系统的输入与输出之间的关系。
频率响应函数可以通过计算或实验测试获取。
频率响应函数的特点包括幅频特性、相频特性和群延迟特性,这些特性可以帮助我们了解系统的频率响应特性,指导系统的设计和优化。
总而言之,振动响应与频率响应函数是机械振动学研究中的重要内容,通过对振动系统响应和频率响应的分析研究,可以更深入地了解
振动系统的动态特性,为振动控制、优化设计和故障诊断提供依据。
希望本文的介绍对您有所帮助。
汽轮发电机组振动信号的特征图谱
汽轮发电机组振动信号的特征图谱随着能源的快速发展和需求的增加,发电机组广泛应用于各个领域。
为保障发电机组的安全、稳定运行,提高发电效率和生产效益,对发电机组的振动信号进行实时监测和分析显得格外重要。
本文将介绍汽轮发电机组振动信号的特征图谱。
一、振动信号的定义振动信号是指由于机械运动而产生的机械振动信号。
在发电机组中,由于转子转动和外部载荷作用,会产生机械振动信号,这些信号可以被监测和量化,进而分析和判断发电机组的运行情况。
振动信号分为时间域信号和频域信号两种。
在发电机组振动信号的分析中,常常使用频域信号,对振动信号进行频谱分析,得到振动信号的特征图谱。
特征图谱是一种将振动速度与频率相关联的图形,通常是将频率沿水平轴,振动速度沿垂直轴,以幅值或相位的形式表示,用来描绘振动信号的能量分布和频率特征。
在振动信号的特征图谱中,可以得到以下几个参数:1.主要频率:振动信号能量最强的频率,通常代表机械系统的主体结构振动频率。
3.含能频带:指振动信号中能量振幅较大的一段频率区间。
4.幅值:振动信号的振动幅值,通常用于判断振动信号的强度和机械系统的损伤程度。
5.相位:指振动信号的相对相位关系,可用于分析机械系统的运动状态和运动方向。
汽轮发电机组的振动信号主要包括转子运动振动、下拉设备振动、空气动力振动和电磁振动四种类型。
在振动信号的特征图谱分析中,主要应对以上四种类型的振动信号进行分析和判断。
1.转子运动振动转子运动振动是指由于不平衡、失衡、变形、裂纹等因素引起的转子运动产生的振动信号。
在频域分析中,转子运动振动主要集中在主要频率和谐波频率处,而且能量分布较集中,幅值较大。
主要频率通常在100Hz以上,谐波频率改变较小,幅值随着频率的增高而降低。
2.下拉设备振动下拉设备振动是指由于下拉设备的运动和振动引起的振动信号。
在频域分析中,下拉设备振动的能量分布较为均匀,含能频带较宽,主要频率和谐波频率分布范围较广,幅值也较低,通常在10-50Hz之间。
工程振动3——自由度系统频响函数
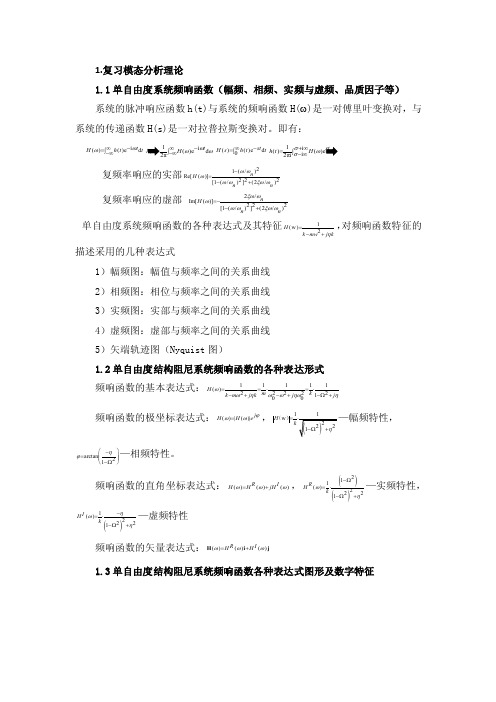
1.复习模态分析理论1.1单自由度系统频响函数(幅频、相频、实频与虚频、品质因子等) 系统的脉冲响应函数h(t)与系统的频响函数H(ω)是一对傅里叶变换对,与系统的传递函数H(s)是一对拉普拉斯变换对。
即有:i ()()e d t H h t t ωω-∞=⎰-∞i ()e d t H ωωω-∞-∞()()e d 0st H s h t t -∞=⎰1i ()(i 2πi h t H σωσ+∞=⎰-∞复频率响应的实部21(/)Re[()]222[1(/)](2/)n H n n ωωωωωξωω-=-+ 复频率响应的虚部 2/Im[()]222[1(/)](2/)nH n n ξωωωωωξωω=--+单自由度系统频响函数的各种表达式及其特征1(w)2H k mw j kη=-+,对频响函数特征的描述采用的几种表达式1)幅频图:幅值与频率之间的关系曲线 2)相频图:相位与频率之间的关系曲线 3)实频图:实部与频率之间的关系曲线 4)虚频图:虚部与频率之间的关系曲线 5)矢端轨迹图(Nyquist 图)1.2单自由度结构阻尼系统频响函数的各种表达形式 频响函数的基本表达式:11111()22222100H m k k m j k j j ωωηωωηωη==⋅=⋅-+-+-Ω+频响函数的极坐标表达式:()|()|j H H e ϕωω=,w H=()—幅频特性,arctan 21ηϕ⎛⎫-= ⎪⎪⎝-Ω⎭—相频特性。
频响函数的直角坐标表达式:()()()R I H H jH ωωω=+,()()211()2221R H kωη-Ω=⋅-Ω+—实频特性,()1()2221I H kηωη-=⋅-Ω+—虚频特性频响函数的矢量表达式:()()()R I H H ωωω=+H i j1.3单自由度结构阻尼系统频响函数各种表达式图形及数字特征Nyquist 图:无论阻尼多大,半功率点总位于水平直径两端,半功率点之间的曲线范围相当大,共振区在Nyquist 图上最易反映出来,故用Nyquist 图作参数识别较好。
频响函数在共振

频响函数在共振
频响函数描述了一个系统对不同频率的输入信号的响应情况。
当频响函数在某个特定频率上达到最大值时,我们称之为共振。
在共振状态下,系统对该特定频率的输入信号表现出最大的振幅响应。
共振通常发生在系统的固有频率附近,也就是系统自身的振动频率。
当外部输入信号的频率接近系统的固有频率时,能量会以较大的幅度传递到系统中,导致系统产生共振现象。
共振可以发生在各种物理系统中,包括机械系统、电路系统和声学系统等。
在实际应用中,共振可以带来很多有益的效果,如增强振动传输、提高谐振器性能和增加音响的音质等。
然而,共振也可能导致一些问题。
在工程设计中,需要注意避免共振现象对系统的破坏性影响。
对于某些系统,共振可能引起不稳定行为、失真、过载或甚至破坏系统的风险。
因此,在设计和分析系统时,需要仔细考虑频响函数和共振现象,并采取相应的措施来控制和管理系统的响应特性,以确保系统的稳定性和性能。
1。
普通车床固有频率的测量
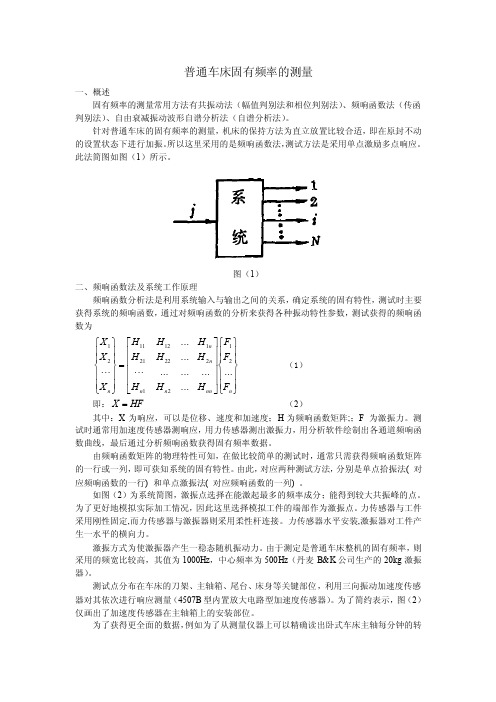
普通车床固有频率的测量一、概述固有频率的测量常用方法有共振动法(幅值判别法和相位判别法)、频响函数法(传函判别法)、自由衰减振动波形自谱分析法(自谱分析法)。
针对普通车床的固有频率的测量,机床的保持方法为直立放置比较合适,即在原封不动的设置状态下进行加振。
所以这里采用的是频响函数法,测试方法是采用单点激励多点响应。
此法简图如图(1)所示。
图(1)二、频响函数法及系统工作原理频响函数分析法是利用系统输入与输出之间的关系,确定系统的固有特性,测试时主要获得系统的频响函数,通过对频响函数的分析来获得各种振动特性参数,测试获得的频响函数为⎪⎪⎭⎪⎪⎬⎫⎪⎪⎩⎪⎪⎨⎧⎥⎥⎥⎥⎦⎤⎢⎢⎢⎢⎣⎡⋅⋅⋅=⎪⎪⎭⎪⎪⎬⎫⎪⎪⎩⎪⎪⎨⎧⋅⋅⋅n nn n n n n n F F F H H H H H H H H H X X X (2121)222211121121 (1) 即:HF X = (2)其中:X 为响应,可以是位移、速度和加速度;H 为频响函数矩阵;;F 为激振力。
测试时通常用加速度传感器测响应,用力传感器测出激振力,用分析软件绘制出各通道频响函数曲线,最后通过分析频响函数获得固有频率数据。
由频响函数矩阵的物理特性可知,在做比较简单的测试时,通常只需获得频响函数矩阵的一行或一列,即可获知系统的固有特性。
由此,对应两种测试方法,分别是单点拾振法( 对应频响函数的一行) 和单点激振法( 对应频响函数的一列) 。
如图(2)为系统简图,激振点选择在能激起最多的频率成分;能得到较大共振峰的点。
为了更好地模拟实际加工情况,因此这里选择模拟工件的端部作为激振点。
力传感器与工件采用刚性固定,而力传感器与激振器则采用柔性杆连接。
力传感器水平安装,激振器对工件产生一水平的横向力。
激振方式为使激振器产生一稳态随机振动力。
由于测定是普通车床整机的固有频率,则采用的频宽比较高,其值为1000Hz ,中心频率为500Hz (丹麦B&K 公司生产的20kg 激振器)。
- 1、下载文档前请自行甄别文档内容的完整性,平台不提供额外的编辑、内容补充、找答案等附加服务。
- 2、"仅部分预览"的文档,不可在线预览部分如存在完整性等问题,可反馈申请退款(可完整预览的文档不适用该条件!)。
- 3、如文档侵犯您的权益,请联系客服反馈,我们会尽快为您处理(人工客服工作时间:9:00-18:30)。
A frequency response function-based structuraldamage identification methodUsik Lee *,Jinho ShinDepartment of Mechanical Engineering,Inha University,253Yonghyun-Dong,Nam-Ku,Incheon 402-751,South KoreaReceived 9March 2001;accepted 9October 2001AbstractThis paper introduces an frequency response function (FRF)-based structural damage identification method (SDIM)for beam structures.The damages within a beam structure are characterized by introducing a damage distribution function.It is shown that damages may induce the coupling between vibration modes.The effects of the damage-induced coupling of vibration modes and the higher vibration modes omitted in the analysis on the accuracy of the predicted vibration characteristics of damaged beams are numerically investigated.In the present SDIM,two feasible strategies are introduced to setup a well-posed damage identification problem.The first strategy is to obtain as many equations as possible from measured FRFs by varying excitation frequency as well as response measurement point.The second strategy is to reduce the domain of problem,which can be realized by the use of reduced-domain method in-troduced in this study.The feasibility of the present SDIM is verified through some numerically simulated damage identification tests.Ó2002Elsevier Science Ltd.All rights reserved.Keywords:Structural damage;Damage identification;Beams;Frequency response function;Damage-induced modal coupling;Reduced-domain method1.IntroductionExistence of structural damages within a structure leads to the changes in dynamic characteristics of the structure such as the vibration responses,natural fre-quencies,mode shapes,and the modal dampings.Therefore,the changes in dynamic characteristics of a structure can be used in turn to detect,locate and quantify the structural damages generated within the structure.In the literature,there have been appeared a variety of structural damage identification methods (SDIM),and the extensive reviews on the subject can be found in Refs.[1–3].The finite element model (FEM)update techniques have been proposed in the literature [4–9].As a draw-back of FEM-update techniques,the requirement of reducing FEM degrees of freedom or extending the measured modal parameters may result in the loss of physical interpretability and the errors due to the stiff-ness diffusion that smears the damage-induced localized changes in stiffness matrix into the entire stiffness matrix.Thus,various experimental-data-based SDIM have been proposed in the literature as the alternatives to the FEM-update techniques.The experimental-data-based SDIM depends on the type of data used to detect,locate,and/or quantify structural damages.They include the changes in modal data [10–18],the strain energy [19,20],the transfer function parameters [21],the flexibility matrix [22,23],the residual forces [24,25],the wave characteristics [26],the mechanical impedances [27,28],and the frequency response functions (FRFs)[29–31].Most of existing modal-data-based SDIM have been derived from FEM model-based eigenvalue problems.As discussed by Banks et al.[32],the modal-data-based SDIM have some shortcomings.First,themodal*Corresponding author.Tel.:+82-32-860-7318;fax:+82-32-866-1434.E-mail address:ulee@inha.ac.kr (U.Lee).0045-7949/02/$-see front matter Ó2002Elsevier Science Ltd.All rights reserved.PII:S 0045-7949(01)00170-5data can be contaminated by measurement errors as well as modal extraction errors because they are indirectly measured test data.Second,the completeness of modal data cannot be met in most practical cases because they often require a large number of sensors.On the other hand,using measured FRFs may have certain advan-tages over using modal data.First,the FRFs are less contaminated because they are directly measured from structures.Second,the FRFs can provide much more information on damage in a desired frequency range than modal data are extracted from a very limited number of FRF data around resonance[30].Thus,the use of FRFs seems to be very promising for structural damage identification.How to minimize the experimental measurement errors,structure model errors,and the damage identifi-cation analysis errors has been an important issue in most structural damage identification researches.To develop or to choose a proper reliable SDIM,one needs to well understand the degree of damage effects on the dynamics of a structure as well as the aforementioned errors.Some researchers[13,16,32–37]have investigated the damage-induced changes in natural frequencies, mode shapes,and curvature mode shapes with varying the location and severity of a damage.However,very few attentions have been given to the effects of the damage-induced coupling of vibration modes(simply, damage-induced modal coupling)and the higher vibra-tion modes omitted in the analysis on the accuracy of predicted vibration characteristics of the damaged beam, from a damage identification viewpoint.The purposes of the present paper are:to develop an FRF-based SDIM,in which an efficient reduced-domain method of damage identification can be used,to inves-tigate the effects of the damage-induced modal coupling and the omitted higher vibration modes on the accuracy of predicted vibration characteristics of the damaged beam,andfinally to verify the feasibility of the present SDIM through some numerically simulated damage identification tests.2.Dynamics of damaged beams2.1.Dynamic equation of motion for damaged beamsThough the FRF-based SDIM developed in this paper can be readily extended to the higher order structures including Timoshenko beams and plate structures,the Bernoulli–Euler beam is considered in this paper as an example structure,for simplicity.The beam has the length L,the mass density per length q A, and the intact Young’s modulus E.For small amplitude vibrations,the dynamic equation of motion for the beams in an intact state is given by[38]o2o x2EIo2wo x2þq A€w¼fðx;tÞð1Þwhere wðx;tÞis theflexural deflection,fðx;tÞthe external force,and EI is the bending stiffness for the intact beam. In Eq.(1),dot(Á)indicates the partial derivative with respect to time t.For most practical vibration monitoring problems,it might be difficult to assign a definitive representation for the stiffness of damaged area because the location,sizes, and geometry of the damage are not known in prior. Thus,one of the simplest approaches is to represent the damage-induced change in stiffness at damage location by the degradation of elastic modulus as follows[16, 32,35]:E dðxÞ¼E1½ÀdðxÞ ð2Þwhere E d is the effective Young’s modulus in the dam-aged state,and dðxÞis the damage distribution function which may characterize the state of damage.The case dðxÞ¼0indicates the intact state,while dðxÞ¼1indi-cates the complete rupture of material due to damage.It seems to be reasonable to assume that the damage-in-duced changes in mass distribution are negligible be-cause the damage does not result in complete breakage with a loss of mass[13,17,18,35].Assume that the damages in a beam are uniform through the thickness of beam(i.e.,thickness-through damages).Then,the intact Young’s modulus E in Eq.(1)can be replaced with the effective Young’s modulusE d to derive the dynamic equation of motion for the beams in the damaged state as follows:o2o x2EIo2wo x2Ào2o x2EI Do2wo x2þq A€w¼fðx;tÞð3Þwhere EI D is the effective reduction of bending stiffness due to the presence of damages:EI DðxÞ¼ZAEdðxÞy2d Að4ÞThe second term in the left side of Eq.(3)should vanish for the intact state.In this study,it is assumed that there are no damages on the boundaries of beam. Thus,the boundary conditions applied to a beam in the intact state can be equally applied to the beam in the damaged state.2.2.Dynamic response of the intact beamThe dynamic equation of motion for uniform intact beams(i.e.,EI¼constant)is reduced from Eq.(1)as118U.Lee,J.Shin/Computers and Structures80(2002)117–132EI o4wo x4þq A€w¼fðx;tÞð5ÞForced vibration response can be obtained by su-perposing M normal modes aswðx;tÞ¼X MmW mðxÞq mðtÞð6Þwhere q mðtÞare the modal(or generalized)coordinates and W mðxÞare the normal modes satisfying the eigen-value problemEIW0000m Àq A X2mW m¼0ðm¼1;2;...;MÞð7Þand the orthogonality propertyZ Lq AW m W n d x¼d mnð8ÞZ L 0EIW00mW00nd x¼X2md mnð9Þwhere X m are the natural frequencies for the intact beam and d mn is the Kronecker symbol.Substituting Eq.(6)into Eq.(5)and then applying Eqs.(8)and(9)yields the modal equations as€q mþX2mq m¼f mðtÞðm¼1;2;...;MÞð10Þwhere f mðtÞare the modal(or generalized)forces defined byf mðtÞ¼Z Lfðx;tÞW m d xð11ÞAssume that a harmonic point force is applied at x¼x F asfðx;tÞ¼F0d xðÀx FÞe i x tð12Þwhere F0is the amplitude of the harmonic point force and x is the excitation(circular)frequency.Substituting Eq.(12)into Eq.(11)givesf mðtÞ¼W mðx FÞF0e i x tð13ÞSolving Eq.(10)for q m yieldsq mðtÞ¼W mðx FÞX2mÀx2F0e i x t Q m e i x tð14ÞThe vibration response of the intact beam can be readily obtained by substituting Eq.(14)into Eq.(6).2.3.Dynamic response of the damaged beamThe dynamic equation of motion for damaged uni-form beams can be reduced from Eq.(3)as EIo4wo x4Ào2o x2EI Do2wo x2þq A€w¼fðx;tÞð15ÞBy using the normal modes of the intact beam,the general solution of Eq.(15)can be assumed aswðx;tÞ¼X MmW mðxÞ q mðtÞð16ÞSubstituting Eq.(16)into Eq.(15)and then applying Eqs.(8)and(9)yields the modal equations for the damaged beam as follows:€ qmþX2mq mÀX Mnk mn q n¼f mðtÞðm¼1;2;...;MÞð17ÞThe third term in the left side of Eq.(17)reflects the influence of damage,which is characterized by the symmetric matrix k mn defined byk mn¼EIZ LdðxÞW00mW00nd x DIMð18ÞThe matrix k mn,which is called‘damage influence matrix (DIM)’herein,depends on the mode curvatures as well as the damage distribution function.Eq.(18)shows that the off-diagonal terms of DIM induce the coupling be-tween modal coordinates,which is called herein‘dam-age-induced modal coupling(DIMC)’.To the authors’knowledge,the DIMC has not been discussed in the existing literatures on SDIM.The natural frequencies of the damaged beam(X m) can be obtained fromdet X2mjÀX2md mnÀk mnk¼0ðno sumÞð19ÞFor the harmonic point force acting at x¼x F,the general solutions of Eq.(17)can be assumed asq mðtÞ¼q mðtÞþD q mðtÞð20Þwhere q mðtÞare the modal coordinates for the intact beam satisfying Eq.(10),and D q mðtÞare the damage-induced small perturbed solutions.Substituting Eq.(20) into Eq.(17)givesD€q mþX2mD q mÀX Mnk mn D q n¼X Mnk mn q nðm¼1;2;...;MÞð21ÞOn applying Eq.(14)into the right side of Eq.(21) and solving for D q mðtÞgivesD q mðtÞ¼X MnX MlX2mÀÂÀx2Ád mlÀk mlÃÀ1k mn Q n e i x tð22ÞThe third term in the left side of Eq.(21)is so small that it can be neglected.Then,Eq.(22)can be approximated in a simplified form asU.Lee,J.Shin/Computers and Structures80(2002)117–132119D q mðtÞ¼X Mnk mn Q nX2mÀx2e i x tð23ÞOn substituting Eqs.(14)and(23)into Eq.(20)and substituting the result into Eq.(16)may yield the forced vibration response of the damaged beam as follows:wðx;tÞ¼X Mm W mðxÞW mðx FÞXmÀx2"þX Mm X Mnk mnW mðxÞX2mÀx2W nðx FÞX2nÀx2#F e i x tWðxÞe i x tð24Þwhere M indicates the number of normal modes super-posed in the analysis.The structural damping can be taken into account in Eq.(24)by simply replacing the natural frequencies X m in Eq.(24)with X m(1þi g m)1=2, where g m is the m th modal loss factor.2.4.Damage influence matrixThe DIM depends on how the structural damage is distributed along the beam.Once the damage distribu-tion function dðxÞis given,the DIM can be readily computed from Eq.(18).As shown in Fig.1,consider a thickness-through damage of magnitude06D61, which is uniformly distributed over the small span2 x, with its midpoint at x¼x D.The‘piecewise uniform’thickness-through damage can be represented bydðxÞ¼D f H½xÀðx DÀ xÞ ÀH½xÀðx Dþ xÞ gð25Þwhere HðxÞis the Heviside’s unit function.Substituting Eq.(25)into Eq.(18)yields the DIM as follows:k mn¼EIZ x Dþ xx DÀ x W00mW00nd x!D k mn Dð26ÞIf there exist many damages,say N local damages,Eq.(26)can be further generalized as follows:k mn¼X Nj¼1EIZ x Djþ x jx DjÀ x jW00mW00nd x!D jX Nj¼1k jmnD jð27Þwhere N is the number of damage detection zones (DDZs),and D j,x Dj,and2 x j represent the magnitude, location,and size of the piecewise uniform damage over the j th DDZ,respectively.Here,the‘DDZs’indicate the finite beam segments that are suspected of damages. It can be observed from Eq.(27)that the damage-free zones in which D j¼0can be removed from the domain of integration without degrading the accuracy of DIM. This may drastically reduce the domain of problem or the number of DDZs for which damage identification analysis should be conducted.Based on this observa-tion,the reduced-domain method of damage identifica-tion is introduced in Section3.3.Development of damage identification methodIf the DIMC is negligible,Eq.(27)can be approxi-mated ask mnffiK m d mnð28ÞwhereK m¼X Nj¼1EIZ x Djþ x jx DjÀ x jW00m2d x!D jX Nj¼1kmjD jð29ÞApplying Eq.(28)into Eq.(19)may yield a set of linear algebraic equations for unknown D j as½ k mj f D j g¼X2mnÀX2moðm¼1;2;...;M and j¼1;2;...;NÞð30ÞOnce the modal data(i.e.,natural frequencies and mode shapes)for a beam in both intact and damaged states are provided by modal testing or theoretical vibration analysis,Eq.(30)can be solved for unknown D j to lo-cate and quantify many local damages at a time,which implies the structural damage identification.Thus,Eq.(30)can be used as a means of structural damage iden-tification.The SDIM derived from Eq.(30)is found to be the same as the modal-data-based SDIM introduced by Luo and Hanagud[16].However,as discussed in Section1,the modal-data-based SDIM may have some important limitations.Thus,this study aims to develop an FRF-based SDIM as an alternative to the modal-data-based SDIM derived Eq.(30).It might be relatively cheap and easy to use accel-erometers to measure vibration responses of a structure. The vibration signals measured by accelerometers can be readily processed to obtain FRFs.There are several different definitions of FRF[39].Though any ofthemcan be used to develop an FRF-based SDIM,the ‘in-ertance’FRF is adopted in this paper.The inertance FRF generated by the harmonic point force applied at a point x F can be measured at a point x as follows:A ðx ;x Þ¼€w ðx ;t Þf ðx F ;t Þ¼Àx 2W ðx ÞF 0ð31ÞSubstituting Eqs.(12)and (24)into Eq.(31)and applying Eq.(27)may yieldÀx 2X N j X M m X M n W m ðx ÞX 2m Àx 2k j mn W n ðx F ÞX 2nÀx 2D j ¼A ðx ;x Þþx2X M mW m ðx ÞW m ðx F ÞX m Àx2ð32ÞBecause Eq.(32)provides the relationship between un-known damage information (i.e.,damage location andmagnitude)and known vibration data,it can be used to develop an algorithm for structural damage identifica-tion.In Eq.(32),the mode shapes (W m )and natural frequencies (X m )of the intact beam are considered as known quantities because they are provided in advance by the modal testing or theoretical vibration analysis.The inertance FRF,A ðx ;x Þ,is also considered as known quantity because it is measured directly from the dam-aged beam.However,the damage magnitudes D j are the unknown quantities to be determined.In Eq.(32),the (response,FRF)measurement point x and the excitation frequency x can be chosen arbi-trary.For a specific set of x and x ,Eq.(32)may yield a linear algebraic equation for N unknown D j .Thus,choosing N different sets of excitation frequency and measurement point may yield N linear algebraic equa-tions for N unknown D j in the form of b X ij cf D j g ¼f Y i g ði ;j ¼1;2;...;N Þð33ÞwhereX ij ¼Àx 2qW m ðx p ÞX m Àx 2q()Tk j mnÂÃW n ðx F ÞX n Àx 2q()ð34ÞY i ¼A x p ;x q ÀÁþx 2qX m W m ðx p ÞW m ðx F ÞX m Àx 2qð35Þk jmn¼EIZx Dj þ x j x Dj À x jW 00m W 00n d xð36Þi ¼p þðq À1ÞPðp ¼1;2;...;P ;q ¼1;2;...;Q ;PQ P N Þð37Þwhere x p ðp ¼1;2;...;P Þdenote the measurement points and x q ðq ¼1;2;...;Q Þdenote the excitation frequencies.Solving Eq.(33)for N unknown D j simplyimplies the location and quantification of damages at atime.Thus,Eq.(33)provides a new algorithm for FRF-based SDIM.The present FRF-based SDIM requires the following data only:1.natural frequencies of intact beam,i.e.,X m ;2.modes shapes of intact beam,i.e.,W m ;3.FRF of damaged beam,i.e.,A ðx p ;x q Þ.The damage identification problem is a sort of in-verse problem.Thus,if the number of useful data (or equations)is not equal to the number of unknown quantities to be determined,a proper optimization solution technique is required.One of traditional approaches is to minimize a suitable norm of the dis-crepancy between measured and computed quantities,which is usually a quadratic form associated to the in-verse of the covariance matrix.The minimization pro-cedure may smear the damage over intact zones,which results in the incorrect damage identification.Thus,to avoid this sort of problem,how to setup a well-posed damage identification problem has been an important research issue in the subject of damage identification.To cope with this issue,two feasible strategies are intro-duced in the following.The first strategy is to obtain a sufficient number of equations from Eq.(32)by choosing as many sets of excitation frequency and (response)measurement point as needed.The use of FRFs may help realize this strategy.Because it is not always easy or practical to increase the number of measurement points over a cer-tain number,it seems to be much simple and easy first to fix the measurement points and then to vary the exci-tation frequency until a sufficient number of equations are derived.The second strategy is to reduce the (spatial)domain of problem.From Eqs.(33)and (36),one may find that the number of unknown quantities is equal to that ofDDZs and the matrix k jmn requires definite integrals only over the zones with damages.Thus,instead of examin-ing whole domain of problem to search out damages (i.e.,full-domain method),one can reduce the domain of problem in advance by removing the zones that are found out to be damage-free to examine only the reduced domain of problem (i.e.,reduced-domain method).The reduced-domain method will not degrade the accuracy of damage identification results at all.To realize the reduced-domain method,however one should know the locations and sizes of damage-free zones in advance.Unfortunately,this is impracticable for most cases.Thus,one needs a method to search out damage-free zones in the process of damage identification analysis.In this paper,a three-steps method is introduced and its feasibility is numerically verified in Section 4.The first step:Divide the domain of problem into N DDZs and use Eq.(33)to predict N unknown damagesU.Lee,J.Shin /Computers and Structures 80(2002)117–132121D j for N DDZs.Thefirst prediction results are repre-sented by D j(first step)ðj¼1;2;...;NÞ.The second step:Divide each DDZ at thefirst step into M sub-DDZs to have total(MÂN)sub-DDZs and use Eq.(33)to re-predict(MÂN)unknown damages for (MÂN)sub-DDZs.The second prediction results arerepresented by D ij (second step)(i¼1;2;...;M andj¼1;2;...;N).The third step:If D ij ðsecond stepÞ<D jðfirst stepÞ,conclude that the i th sub-DDZ within the j th DDZ is damage-free.Otherwise,the sub-DDZ is suspected of damage.Once damage-free zones are searched out and re-moved from the domain of problem by using the present three-steps method,it is possible to put D¼0for all removed damage-free zones and to conduct damage identification only for the reduced domain,which is the reduced-domain method of damage identification in-troduced in the present study.By iteratively using the reduced-domain method,all damage-free zones can be removed from the original domain of problem to leave damaged zones only,which simply implies the location of damages.The damage magnitudes are quantified from Eq.(33)every iteration.In summary,an FRF-based SDIM is introduced based on the damage identification algorithm of Eq.(33).In the present SDIM,the reduced-domain method can be iteratively used to reduce the domain of problem. The present SDIM can locate and quantify many local damages at a time by using the FRFs experimentally measured from the damaged beam.The appealing fea-tures of the present SDIM may include the followings: (1)the modal data of damaged beam are not required in the analysis;(2)as many equations as required to setup a well-posed damage identification problem can be gen-erated from the measured FRFs by varying the excita-tion frequency as well as the measurement point;(3)the reduced-domain method based on the three-steps pro-cess of domain reduction can be iteratively used to effi-ciently reduce the domain of problem andfinally to identify many local damages just within a few iterations.4.Vibration characteristics of damaged beamsMany researchers[13,16,32–37]have investigated the damage-induced changes in natural frequencies,mode shapes,and curvature mode shapes varying the location and severity of damage.However,there have been very few investigations,from a damage identification view-point,on the effects of the DIMC as well as the higher vibration modes omitted in the analysis(simply the omitted higher modes)on the accuracy of predicted vi-bration characteristics of the damaged beam.Thus,in this section,some numerical investigations are given to the DIMC and the omitted higher modes.As a repre-sentative problem,a uniform beam of length L¼1:2m is considered herein.The beam has the intact bending stiffness EI¼11:2N m2and the mass density per length q A¼0:324kg/m.4.1.Effects of damage-induced model couplingThe DIM for the cantilevered beam with a piecewise uniform damage at the midpoint of beam,i.e.,x D¼0:6 m,is shown in Table1.Similarly,the DIM for the cantilevered beam with three identical piecewise uniform damages at x D¼0:3,0.6,and0.9m is given in Table2. The piecewise uniform damages considered for Tables1 Table1Damage influence matrixðk mn=k refÞfor the cantilevered beam with one piecewise uniform damage:D¼0:5;x D¼0:6m;2 x¼0:133m;k ref¼3:87Table2Damage influence matrixðk mn=k refÞfor the cantilevered beam with three piecewise uniform damages:D1¼D2¼D3¼0:5; x D1¼0:3m,x D2¼0:6m,x D3¼0:9m;2 x1¼2 x2¼2 x3¼0:133 m;k ref¼3:87122U.Lee,J.Shin/Computers and Structures80(2002)117–132and2have the same magnitude D¼0:5and the samesize2 x¼0:133m.Tables1and2show that,as a general rule,the di-agonal terms of DIM(i.e.,the direct effects of damage)increase in magnitude as the mode number increases.However,they decrease momentary at certain vibrationmodes if a node of the modes is located in damagedzones.For instance,k33and k55in Table1are smallerthan k22and k44,respectively,because a node of the thirdandfifth modes is located in the damaged zone.Eq.(27)shows that,in general,DIM becomes larger as thedamage magnitudes increase.The off-diagonal terms ofDIM(i.e.,the indirect effects of damage or the DIMC)are relatively smaller than the diagonal terms.The off-diagonal terms vanish completely when the damage isuniformly distributed over the whole beam,regardless ofits magnitude,which can be readily proved from Eq.(27)by using the orthogonality property for normalmodes.Fig.2shows the effects of DIMC on the damage-induced changes in natural frequencies of the cantile-vered beam depending on the magnitude of a piecewiseuniform damage.Fig.3is for the simply supportedbeam.Neglecting the DIMC tends to underestimatethe damage-induced changes in natural frequencies.Ingeneral,the effects of DIMC on the changes in naturalfrequencies are found to be negligible,especially whenthe damage is very weak.However,it will be desirable toinclude the DIMC in the damage identification analysisbecause damages are not known in prior for mostpractical cases.From Figs.2and3,one may observe the followings.First,in general,the percent changes in natural fre-quencies at the lower modes are larger than those at thehigher modes,and vice versa for the absolute changes innatural frequencies.Second,the percent changes innatural frequencies highly depend on mode number anddamage location.If damages are located at or very nearthe nodes of a mode,the percent change in the naturalfrequency of the corresponding mode is very small.Forinstance,the percent changes in natural frequencies arevery small for the odd(e.g.,third andfifth)modes ofcantilevered beam and for the even(e.g.,second and fourth)modes of simply supported beam.Very similar results have been experimentally observed by Capecchi and Vestroni[40].Third,the percent changes in natural frequencies converge to a certain steady state value as the mode number increases.For instance,about1% when D¼0:5and about0.1%when D¼0:05for the cantilevered beam.Similarly,about0.5%when D¼0:5 and about0.05%when D¼0:05for the simply sup-ported beam.Fig.4compares the inertance FRFs of damaged beam,calculated with and without including the DIMC, with that of intact beam.In general,the effects of DIMC on the changes in inertance FRFs are found to be neg-ligible.One notes that the third andfifth resonance peaks are not appeared in Fig.4because the FRFmeasurement point(x¼0:6)coincides with a node of the third andfifth modes.4.2.Effects of the omitted higher modesA sufficiently large number of normal modes and natural frequencies of the intact beam are required for accurate damage identification.However,in practice, only a limited number of the lower normal modes and natural frequencies can be provided by modal testing or theoretical modal analysis.Thus,the errors due to the omission of the higher normal modes are inevitable.Fig.5shows the ratios between the omitted higher modes-induced errors in natural frequencies and the damage-induced changes in natural frequencies for the cantilevered beam with a piecewise uniform damage. Similarly,Fig.6shows the results for the simply sup-ported beam.The omitted higher modes-induced error in natural frequency,denoted by D X(omitted modes)in Figs.5and6,is defined by the difference between the exact and approximate natural frequencies of the dam-aged beam.The approximate natural frequencies are calculated by using afinite number of normal modes.On the other hand,the damage-induced change in natural frequency,denoted by D X(damage)in Figs.5and6,is defined by the difference between the exact natural fre-quency of the intact beam and that of the damaged beam.The important thing here is that the omitted higher modes-induced errors should be much smaller than the damage-induced changes for very reliable damage identification.From Figs.5and6,one may observe the followings.First,if damages are located at or very near the nodes of a normal mode,the omitted higher modes-induced errors become very significant for the natural frequency corresponding to the normal mode.For example,the damage considered herein is located at a node of the third andfifth modes of the cantilevered beam.Thus, when totalfive normal modes are used to calculate natural frequencies,for instance,the omittedhigher。