flowjo中文使用手册
flowjo中文使用手册

flowjo中文使用手册摘要:1.引言2.FlowJo 软件简介3.FlowJo 的使用方法4.案例分析5.总结正文:【引言】FlowJo 是一款专业的中文文本处理软件,适用于各种文本分析和处理任务。
本手册将为您介绍如何使用FlowJo 进行文本分析和处理。
【FlowJo 软件简介】FlowJo 是一款功能强大的中文文本处理软件,主要包括以下功能:1.文本清洗:可以去除文本中的多余空格、换行符等无关信息。
2.分词:将文本切分成有意义的词汇。
3.词性标注:为切分后的每个词汇标注词性。
4.命名实体识别:识别文本中的人名、地名、组织名等实体。
5.依存关系分析:分析词汇之间的关系。
【FlowJo 的使用方法】使用FlowJo 进行文本处理主要分为以下几个步骤:1.安装FlowJo 软件:从官方网站下载并安装软件。
2.打开FlowJo:双击桌面上的FlowJo 图标启动软件。
3.导入文本:点击“文件”菜单,选择“打开”,导入需要处理的文本。
4.预处理:选择“文本清洗”对文本进行预处理。
5.分词:选择“分词”功能对文本进行分词。
6.词性标注:选择“词性标注”功能为分词后的词汇标注词性。
7.命名实体识别:选择“命名实体识别”功能识别文本中的实体。
8.依存关系分析:选择“依存关系分析”功能分析词汇之间的关系。
9.导出结果:处理完成后,选择“文件”菜单,选择“另存为”,导出处理结果。
【案例分析】假设我们有一段中文文本:“小明是北京的一名大学生,他喜欢在周末去颐和园游玩。
”我们可以使用FlowJo 进行如下处理:1.导入文本。
2.对文本进行预处理。
3.分词:“小明/是/北京的/一名/大学生/,/他/喜欢/在/周末/去/颐和园/游玩/。
”4.词性标注:“小明(n)/是(v)/北京的(adj)/一名(num)/大学生(n)/,/他(pron)/喜欢(v)/在(adv)/周末(n)/去(v)/颐和园(n)/游玩(v)/。
flowjo中文使用手册

flowjo中文使用手册摘要:1.引言2.FlowJo 软件介绍3.FlowJo 的使用方法4.FlowJo 的功能与应用5.总结正文:【引言】FlowJo 是一款专业的中文知识类写作软件,可以帮助用户高效地进行文本的编写、排版和整理。
本手册将为您详细介绍如何使用FlowJo,以及它的功能和应用场景。
【FlowJo 软件介绍】FlowJo 软件是一款人工智能写作助手,它基于大数据和自然语言处理技术,可以为用户提供高质量的中文写作服务。
FlowJo 支持多种文本格式,可以满足不同用户的写作需求。
【FlowJo 的使用方法】1.安装与登录:首先,您需要在官方网站上下载并安装FlowJo 软件。
安装完成后,用您的账号登录。
2.文本编写:在主界面,您可以选择您要编写的文本类型,如文章、报告等。
点击后,系统会自动生成一个模板,您可以根据需要进行修改。
3.文本排版:在文本编写完成后,您可以选择排版样式,FlowJo 会自动为您进行排版。
4.检查与修改:在文本排版完成后,您可以进行检查和修改,直到您满意为止。
【FlowJo 的功能与应用】FlowJo 主要有以下功能:1.自然语言处理:FlowJo 可以理解并分析您的文本,提供相关建议和修改意见。
2.大数据支持:FlowJo 可以连接各大数据库,提供实时的数据支持。
3.多语言支持:FlowJo 支持多种语言,包括中文、英文等。
4.自动排版:FlowJo 可以根据您的要求,自动进行文本排版。
FlowJo 主要应用于以下场景:1.写作辅助:FlowJo 可以帮助您进行文本的编写和修改,提高您的写作效率。
2.数据分析:FlowJo 可以连接数据库,提供实时的数据支持,帮助您进行数据分析。
3.翻译服务:FlowJo 支持多种语言,可以提供翻译服务。
【总结】FlowJo 是一款专业的中文知识类写作软件,可以帮助用户高效地进行文本的编写、排版和整理。
FlowJo中文使用说明书
FlowJo中文实用手册(软件版本:FlowJo7.6.5 2012/06/20 更新)第一章 FlowJo简介 (1)一、FlowJo对电脑配置的要求 (1)二、FlowJo的安装过程(Windows) (1)三、FlowJo的工作台 (5)第二章 FlowJo分析单标样本 (6)一、由原始数据生成单参数直方图的过程 (6)二、图形的输出和保存 (10)第三章 FlowJo分析多色标记样本 (13)一、由原始数据生成二维点图的过程 (13)二、二维点图的设门原则 (16)三、多色标记分析说明 (16)第四章 FlowJo软件荧光补偿 (18)一、用FlowJo做荧光补偿并进行数据分析的步骤 (18)二、FlowJo荧光补偿的具体步骤 (18)三、双指数转换 (24)第五章 FlowJo的批处理功能 (27)一、设门分析的批处理 (27)二、表格分析的批处理 (32)三、图形分析的批处理 (35)第六章 FlowJo分析细胞凋亡样本 (43)一、细胞凋亡概述 (43)二、FlowJo分析凋亡数据的过程 (44)三、凋亡数据结果分析 (45)第七章 FlowJo软件分析细胞周期样本 (47)一、细胞周期分析概述 (47)二、FlowJo分析细胞周期数据的过程 (48)三、细胞周期拟合的调整方法和步骤 (51)四、细胞周期结果分析 (53)第一章 FlowJo简介FlowJo是美国斯坦福大学Leonard Herzenberg(FACS机器的发明者)实验室在90年代研发的一款流式数据分析软件。
FlowJo由于功能强大,简单易用,已经被领域内的科学家、实验室广泛引用;同时FlowJo也是各高影响力核心期刊引用最多的流式数据分析软件。
一、FlowJo对电脑配置的要求1. PC电脑:操作系统:Windows XP,Vista,Windows7内存:512MB及以上网络连接:使用试用序列号及联网序列号必需要有网络连接;加密狗无需网络2. 苹果电脑:操作系统:OSX10.3或者更高版本内存:512MB及以上网络连接:使用试用序列号及联网序列号必需要有网络连接加;密狗无需网络二、FlowJo的安装过程(Windows)•请到我们的网站上下载最新版本:/content/download在此,我们下载V7.6.5 为例/sites/default/files/7.6.5_X32.exe 将文件下载到桌面之后,就可以看到FlowJo安装程序图标。
flowjomanual说明

Table of ContentsTable of Contents (1)Welcome, new users! (2)Overview (4)What does FlowJo do? (4)Workspace Overview (8)Adding Samples (10)Groups (11)Batch Analysis (13)Statistics (14)Summary of Drag and Drop Examples (16)Unify Analyses (17)Compensation Overview (18)The Experiment Annotator (21)Getting Help in FlowJo (23)Offline Documentation (23)Cancelling Batch Operations (24)Graph Window (25)Axis Labels (26)Graph Types (28)Bivariate displays (28)Gating (29)Platforms (30)Kinetics (30)Derived Parameters (32)Compensation Overview (34)Calibrated Parameters: Overview (37)Kinetics Overview (38)Cell Cycle (42)Proliferation (45)32 Bit Data Settings (48)Output (50)The Layout Editor (51)Copying Graphs (52)Copying Gates (53)Tables (54)Printing (58)FlowJo Menus (59) (59)Preferences (77)Workspace Tab (77)Techniques (81)Techniques (82)Windows Template (83)Table of ContentsWelcome, new users!This page was designed for people new to FlowJo to answer some of the most common questions people have. Please click on a question below to see the answer.What is FlowJo ?What are the software/hardware requirements for FlowJo?How do I get FlowJo?How do I activate my FlowJo demo?How can I buy FlowJo?How do I learn FlowJo?What is FlowJo ?FlowJo is a scientific analysis program for flow cytometric data. Flow cytometry is the study of properties of suspended particles in a liquid. FlowJo is powerful enough to perform comprehensive analyses of thousands of samples simultaneously.Built into FlowJo are a wide array of visualization and gating tools, special platforms for kinetics, cell cycle analysis, quantitation and compensation. FlowJo produces the best publication quality charting available and introduces new technologies for presenting and publishing new data via the web.What are the software/hardware requirements for FlowJo?FlowJo for Macintosh requires a Power PC processor, running OS9.2, Jaguar, Panther or Tiger with at least 128MB RAM and a USB port.FlowJo for Windows requires a Pentium class or higher processor, running Windows 2000 or Windows XP, with at least 512MB RAM and a USB port.The amount of samples FlowJo can open depends on how much memory is installed.How do I get FlowJo?FlowJo can be downloaded (PC, Mac). If our webiste is down, you can request a free CD by calling 800 366 6045 or 541 201 0022. More contact info here. You can use the software free of charge for 30 days if you register.How do I activate my FlowJo demo?Activating your FlowJo demo means you'll be able to use your own data for analysis. Unactivated demos will only let users work with our tutorial data. To activate your license, please fill out and submit the request form and a serial number will be sent to your email address.PC users will open the FlowJo preferences (edit menu item, preferences, look in the lower left for a field labeled "serial number").Mac users will open the "about flowjo" dialog from the apple menu, click "enter new serial number", paste the serial number from your email there, and click "use serial number".How can I buy FlowJo?If you think FlowJo is right for you, you can by all means buy it. Our pricing is here. We only discount prices for Universities (30%) and software resellers (10%).You can order FlowJo online with a credit card or a PO (USA) or fax your order in, or call it in (contact info)How do I learn FlowJo?A good place to start is with the tutorials. The basic tutorial teaches you basic FlowJo operations, suchas adding sample data files, graphing them, and creating simple layouts. The advanced tutorial is longer and addresses complex analysis needs and batching.New to FlowJo?• Table of ContentsOverviewThis page describes some of the basic concepts underlying FlowJo; it is meant to help you familiarize yourself with some of the terminology and the features of FlowJo. As you navigate through the main documentation, you will get more details about all of these topics. In addition, you can follow links to some special topics regarding FlowJo: The all-important Credits page, where we have the opportunity to thank the many individuals who have spent much time and effort helping us make FlowJo the most sophisticated analysis package around, a Frequently-Asked Questions page (FAQ), listing some common questions and answers, a page about getting Help from within FlowJo itself, and a page detailing the history of revisions to FlowJo.What does FlowJo do?FlowJo should be the first step in the process of analyzing flow cytometry data. FlowJo can analyze data generated by any flow cytometer from any manufacturer. FlowJo has a number of different analysis platforms that let you not only perform standard analyses such as gating and statistics, but also specialized analyses such as DNA/Cell Cycle, Kinetics (Calcium flux), Proliferation, Calibration, and Statistical Comparison. You may find that FlowJo's sophisticated tools for generating output (graphical or tabular) are sufficient for you to generate publication-quality material.... but if not, FlowJo makes it easy for you to copy any graphs, statistics, or other information into other programs for further analysis and presentation.Experiments and workspacesFlowJo is a program designed to analyze flow cytometry data. The basic concept behind this analysis is that of the experiment. An experiment is a collection of samples which have a set of common attributes; for instance, there are sets of tubes stained with the same antibodies, other sets of tubes which come from the same tissue sources, etc. An experiment can be a single collection of samples, or it can stretch across multiple runs over a period of months.With FlowJo, you will organize the samples in a workspace. A Workspace is similar to a notebook: it references every sample that you are analyzing, and records the analyses (gates, statistics, graphs, tables) that you have done. You can close the workspace, and then reopen in the future and start where you left off. You can have as many workspaces as you want; the organization is up to you. We recommend that you have at least one workspace for every experiment.Within a workspace, you can group samples by various attributes. For instance, you can make a group of all samples derived from a single individual (which may have different stains); you can also make groups of all samples with the same stains (which come from different individuals). Groups are really the powerful feature of FlowJo: when you perform an operation on a group, it performs the operation on every sample belonging to that group. Thus, you can apply a gate or a statistic to a group, and that gate or calculation will be automatically performed on all samples![Top]Analyzing with FlowJoYou will find that your mode of operating FlowJo will probably be very similar to the following series of steps:Load the samples into a workspace.1.2.Group samples for analysis with common procedures.3.Analyze a single prototype sample in detail. Decide on gates, statistics, etc.4.Apply the appropriate analyses to all the samples in a group.5.Quickly check the samples in the group to make sure the gates are acceptable: they may need minor modifications to accommodate sample to sample variation.6.Generate a graphical layout in which you can display particular graphs from all samples.Generate a table in which you can generate particular statistics from all samples.7.You can then save this workspace as a template... Next week, when you do another (similar) experiment, most of the work is already done for you! You simply have to import the new samples into the template workspace you created before: all of the data files will be added to the appropriate groups, which means all of your previous analyses (gates & statistics, etc.) will be automatically applied to each sample. You need only regenerate the graphical layouts and the tables.[Top]The Gating HierarchyAnother fundamental concept in FlowJo is that of the gating hierarchy. When you first generate a gate on a sample (for instance, a lymphocyte gate), FlowJo shows you this gate (subset) in the paradigm of a genealogical tree. In other words, the Lymphocyte subset is a child of the parent sample. It is shown in the workspace underneath the sample, indented a single level from the sample. If you were to make another gate on the sample (for instance, monocytes) FlowJo will create another new subset as another child of the sample; now, the lymphocyte and monocyte subsets (or gates) are siblings.Any operation that you can perform on a sample can also be performed on a subset of the sample. Therefore, you can view the lymphocyte subset and create gates (subsets) of this population. If you create a T cell gate within lymphocytes, then the T cell subset becomes a child of the lymphocytes (and, by extension, a grandchild of the sample).This paradigm is very important to the way in which FlowJo operates. When you copy analyses like gates, you can choose to copy only the single gate that you click on, your you can choose to copy it with all of its children (i.e., copy the entire analysis tree). You can copy the gate with its parents as well. Remember, any subpopulation is a single gate. When you want to recreate the same subpopulation on another sample, you need to carry all of the gates (all of the ancestors of the subset) with the subpopulation when you copy it.[Top]Batch operationsBatch operations (repetitive analyses performed on multiple samples) are very simple in FlowJo. In general, batch operations are performed on all samples in the currently selected group (therefore, you will want to create sample groups that will serve to help you generate batch outputs). Batch operations include copying gates and analyses, generating graphical layouts, and generating tables. In addition, there are some minor operations like opening a graph of a subset as you are viewing from all samples in the group, unifying the analyses across samples within a group, deleting analyses, and so forth.In this way, FlowJo is a program that doesn't just analyze individual data samples. Rather, the focus is on analyzing groups of samples, experiments, or even multiple experiments at once.CompensationIn the world of increasing fluorescence parameters, it has become impossible to fully compensate samples at the time of collection. FlowJo provides an interface for computing the compensation matrix based on the collection of singly-stained samples. You can then apply this compensation matrix to samples that are uncompensated. At this point, you can view and analyze the compensated data.[Top]Derived ParametersFlowJo lets you define new parameters for samples. These include the ability to add Time as a parameter (for performing kinetics analyses), to compute the ratio of two collected parameters, or to convert between log and linear scaling. Derived parameter definitions can be copied to entire groups of samples.Kinetics (Ca++ flux) analysesFlowJo provides a sophisticated platform designed to analyze kinetics data. The sample must have a parameter which corresponds to time (and is named "Time"); if it does not, FlowJo allows you to create a time parameter (assuming a constant event rate). From this platform, you can compute the maximal response time, the slope of a response, the fraction of responding cells, etc.[Top]Cell Cycle AnalysisThe Cell Cycle Platform is easy to use, yet can view several different models simultaneously, constrain fitting parameters, and automatically calculate the percentage of cells in G1, S, or G2 peaks. Fitting can be constrained in a number of ways, letting you generate reasonable interpretations of even very unusual cell cycle distributions. All models can be copied between populations or samples, with the same easy drag and drop interface used to propagate other gates or analyses.Calibration (Quantitation)FlowJo has a unique Calibration Platform that allows you to calibrate any collected parameter. Most commonly, this is used to convert the scaling into absolute number of molecules (given a standard that converts between the fluorescence intensity collected on your instrument and absolute numbers of fluorophores). The platform can use a calibrated bead set as a standard, a stained sample as a reference, or numbers that you enter to define the calibration manually.[Top]Proliferation AnalysisThe Proliferation Platform is used to model proliferation data obtained using cell tracking dyes such as CFSE. FlowJo presents a graphical display as well as information about each generation in the subset. The proliferation platform also provides information about the fraction of cells from the original population that have divided, and the number of times these cells have divided. In addition the FlowJo Proliferation Platform draws gates that separate each generation.Movies•Movies. An analysis platform unique to FlowJo: view your data dynamically. Use the Movie Platform to generate graphs as a function of time (kinetic analyses), or to generate a graph of one or two parameters as a function of a third. This unique visualization lets you uncover subtle relationships in your data that would be impossible to see otherwise.Backgating AnalysisOnce your analysis contains subpopulations produced by gating within gates, it can be useful to see the source of a given subpopulation rendered graphically. Backgating analysis shows graphs of each gating operation with the final subpopulation highlighted in the graph of each stage.Statistics and FormulasA host of standard statistical calculations can be performed on a subpopulation then generalized to the whole experiment by batching. FlowJo will build a table of statistical analyses across groups of tubes that you designate. These tables update continuously as long as you are modifying your experiment, for example, by correcting gates. You can export these tables and work further in third party software. You can also devise and apply your own formulas within FlowJo and use its tools to complete your analysis across multiple populations without tedious duplication of effort. The tables you create can be dragged and dropped from one workspace to another.[Top]OverviewWorkspace OverviewFlowJo organizes all of your analyses into a "workspace". The workspace contains the following information:•A list of all the samples that you have put into the workspace•A list of all the groups that you have created•All of the analyses (and results of calculations)•All compensation matrices that you have created or loadedAll table definitions that you created••All layout definitions that you createdThis information is at your fingertips through the workspace window.Your workspace is like your laboratory notebook. You can save it, and then re-open it in the future and continue your analyses from where you left off. It will remember everything that you do (although you can choose to delete analyses or samples and they will be forgotten). Workspaces can become templates for batch analyses of many experiments--you can load as many samples as you wish into a single workspace.How you organize your workspaces is up to you. We recommend that you assign each experiment a workspace. Remember that you can copy analyses between workspaces; there is no limitation imposed by maintaining multiple workspaces. Of course, all batch analyses are limited to samples within a single workspace, so you will want to keep all similarly-analyzed samples (even from different experiments) in the same workspace. You may have as many workspaces open at the same time as you wish.For an explanation of the elements of the window, click here.Workspaces: an overview• Table of ContentsGroupsGroups are the heart of all the powerful tools in FlowJo. A group is a collection of samples-and a mechanism by which analyses can be applied uniformly to that collection of samples. Any given sample may belong to one or more groups. FlowJo lists the groups in the upper portion of the workspace window.There is a special case group: the "All Samples" group. It contains (by definition) all of the samples known to the workspace. The "All Samples" group can neither be renamed nor deleted.Groups are created in one of two ways:(1) When you read in a folder of data files, FlowJo creates a group with the name of the folder and automatically adds the samples to the group; or(2) You can create a new group by clicking on the New Group button under the Workspace menu.When you create the group, you are given the option of adding samples to the group which fit a set of criteria-this is specified by the Create Group dialog window. In addition, you can specify that these criteria should be checked anytime new samples are added to the workspace: if the new samples meet those criteria, they are added to the group (and group-based analyses are automatically performed at once.)You can add samples from the workspace to any group. Just click on the sample and drag it to the group. To remove a sample from a group, select the group, then select the sample and press the delete key. If the current group is All Samples and you delete the sample, then you will be permanently removing the sample from the workspace.A group behaves in some ways as a "template sample" for its members. In other words, you can drag gates or statistic nodes to a group exactly the same way as you would to another sample. The only difference is that these gates, after being added to the group, are then added to every sample belonging to the group. This is one of the ways in which FlowJo performs batch analyses. For hints on creating groups to efficiently use this feature, click here.There is one unbreakable rule with regards to groups: Every sample belonging to a group must contain every analysis that has been applied to the group. Of course, if the group specifies analyses that are not applicable to the sample, then this doesn't happen. (For example, if you have created a gate based on compensated parameters, and a sample that is not compensated is added to the group, then those gates cannot be added to that sample. Once you compensate the sample, however, the gates will be automatically added.)If a sample belongs to multiple groups, then it will have all of the analyses from all of the groups to which it belongs. Whenever you add a sample to a group (by dragging it into the group), that group's analyses are automatically applied to the sample.Associated with group names is a color and text style. A gate that is attached to a sample through a group operation appears in the same color and style as that group. Therefore, any gate within a sample that has a group's color and style is guaranteed to be identical to the group's version of that gate. When you change a group's version of a gate (by dragging a new version of that gate onto the group or if you have the Synchronize Group's Gates option checked), then all samples with the group'sversion of the gate are likewise updated.If you modify a sample's version of a group's gate (for instance, if you decide that a lymphocyte gate for one sample should be slightly different and you move it), then that gate will now appear in the workspace window in black and plain text (unlike the group's gates). This is how you can tell from the text when a gate has been modified. However, if you checked the Synchronize Group's Gates option when you created the group, any time you modify a gate on any sample, the group's gate is automatically updated.Note that modified gates will still behave in other ways like group gates: when you attach asubpopulation to a group's gate, it will be attached to the same gate in all samples, whether or not they are identical to the group's version of the gate.If you have modified a gate and decide later that it should be identical to the group's version, you can select the gate and choose the Unify analyses option under the Workspace menu. Likewise, if you select a gate within a group and choose this menu option, then all sample's versions of this gate are made identical to the group's version.How do you know what the group's version of a gate looks like? Simply open any sample which has the group's version of the gate (i.e. the node is displayed in the color and text style of the group). If you change this sample's gate (move it), then you are only changing that sample's version. To change the group's version, drag the node back onto the group after you have made the modification or if you checked the Synchronize Group's Gates option when creating the group, the update happens automatically.If a sample belongs to multiple groups which all have an analysis of the same name, then the sample's version of the gate will be whichever one it got first.Deleting nodes associated with groups have special consequences:If you delete the node in the group itself, then it is removed from the group. You are then asked if you want to remove the same nodes from all of the samples; if you choose not toremove them from the samples, they are left alone (but they are then owned by thesamples-i.e., drawn in black and plain text-since they no longer belong to a group).♦ You cannot delete a sample's node which is identical to the group's node, since every sample must have every analysis belonging to the groups that it is in.♦ If you delete a node which is a modified version of the group's node, then FlowJo will replace it with the original, group's version of the node.♦ If you delete a sample from a group, then it is removed from the group but all analyses which came from the group are still applied to the sample (but they are now owned by the sample,not the group).♦ If you delete a group, then all of the group's analyses nodes are assigned to the samples.♦ If you rename a sample's version of a group node, then a copy of that node is made with the new name, and the sample will retain a node with the same name as the group's node.♦ Groups• Table of Contents•Batch AnalysisThe real power of FlowJo as an analysis tool becomes immediately evident when you start to do "batch" analysis; i.e., the repeated application of a set of analyses (gates, statistics, graphical outputs) to a series of samples.Application of analyses to other samples is very easy: simply click once on the analyses that you wish to duplicate, and while holding down the mouse button - drag them to the destination sample. You can select a single gate (by clicking), or select several independent gates (by shift-clicking and dragging any of the selected gates).You can also apply a set of analyses to all samples within a group simultaneously. Simply drag the analyses trees onto the group. They are attached to the group itself, and then attached to each sample that belongs to the group (assuming the analysis is valid for that sample). By using these kinds of group analyses, you can assure that all samples are being analyzed identically. When you change a group's version of an analysis (by dragging a new version of a gate onto the group), then all samples belonging to the group will be automatically updated with the new copy (with the exception of those samples which have "special" versions of such gates). These operations are fully explained in the pages on group analyses .Another kind of batch analysis is the extraction of statistical information from a series of samples. This is accomplished through the table editor. Using the table editor, you specify what sorts of statistical information you wish to collect for each sample. Then you create the table for the current group; FlowJo allows you to save the table to a file (which you can export into a spreadsheet), to the clipboard (so you can copy it directly into a spreadsheet), or print it out. In addition, FlowJo will save the table AND open your favorite spreadsheet program AND copy the table into this program - all with a single click! Table definitions are saved with the workspace so that you can use them again in the future.The final type of batch analysis is the extraction of graphical displays for a series of samples. For this, you use the layout editor. The layout editor allows you to arrange several graphs on a drawing board. This graphical layout is then applied to the series of samples in the current group; the result can be saved to a disk file (PICT format), copied into other applications (such as Canvas), or printed.Template workspaces save all the analyses (gates and statistics), table definitions and layout definitions while removing the samples. Because FlowJo saves all of this information in the workspace, it is a simple matter to read new samples into the same workspace that has been saved as a template and then apply the same batch analyses to those samples.A batch is composed of a series of tasks. The task is the unit of computation; that is the generation of each statistic or graph, sorting of a list etc. FlowJo can execute tasks asynchronously, meaning that you do not have to wait for all pending tasks to complete before interacting with the program. You can even initiate new tasks while others are being completed, so that the amount of time you have to spend waiting for the program is minimized. Because the tasks can also be sorted in such a way as to reduce the loading and unloading of files, the asynchronous processing can actually be faster than giving all of the computing resources to handling pending computations.See Also: Groups , Layout Editor , Table EditorBatch analysisTable of Contents •Statistics•Summary of Drag and Drop ExamplesThis series of examples is based on a workspace in which there were several samples collected from different people. These samples were stained with CD4, CD8, and differentiation markers. The first sample was analyzed in detail and gates were generated to define several T cell subsets.A series of drag operations using different modifier keys will serve to show how drag and drop can be used to replicate analyses between samples. (This information applies equally to performing operations on groups, but the resulting behavior may be somewhat different. This is discussed fully in the help on groups).You may go through each of the examples in sequence, or jump straight to a specific example:Dragging a single node•Dragging a node with its children•Dragging a node with its parents••Dragging multiple nodesDragging multiple nodes with children and parents••Replacing existing nodesThese examples are all based on copying analysis nodes from one sample to another. However, the same options are available for dragging within a single sample, and for dragging to the table editor or the layout editor.Summary:To select more than one analysis node, use the command key to select additional nodes. (Use shift key if you want to select a range of nodes that are all siblings).To take an entire analysis tree, click on the top-most node of the set of nodes you wish to take, and drag with the option key down (select all children).To take only a single analysis node with all the gates used to create it, select that node and drag with the control key down (select all parents).Thus, judicious use of selection and the modifier keys allows you to drop only the portion of the original analysis tree that you want to move.Dragging and dropping (copying) analysis nodes & trees。
flowjo处理数据步骤 -回复
flowjo处理数据步骤-回复FlowJo处理数据步骤FlowJo是一款专业的流式细胞术数据分析软件,广泛用于分析和可视化流式细胞仪产生的多变量数据。
本文将为您详细介绍FlowJo的数据处理步骤,帮助您更好地理解和应用该软件。
一、导入数据首先,我们需要将流式细胞仪产生的原始数据导入到FlowJo中。
FlowJo 可以支持多种常见的文件格式,如FCS、CSV、BDF等,您可以选择适合您数据格式的方式导入数据。
通过打开FlowJo软件,您可以在主界面上选择“导入”按钮,然后选择合适的数据文件格式进行导入。
导入后,您可以为数据设置适当的标题和实验说明,以便更好地管理和识别数据。
二、数据矫正和清洗在导入数据后,您可能需要进行一些数据矫正和清洗的步骤,以确保数据的准确性和一致性。
FlowJo提供了一系列的工具和功能,用于处理和清洗数据。
例如,您可以通过设置门(Gates)来排除噪声或异常数据,选择适当的控制样品进行数据矫正,调整仪器设置等。
您还可以使用FlowJo 提供的统计学算法,如均值、中位数、百分位数等,对数据进行清洗和排除异常值。
三、标记和分组数据导入和清洗后,您可以开始对样本进行标记和分组。
流式细胞术通常使用多种荧光染料来标记不同的细胞亚群或生物标记物。
FlowJo提供了丰富的标记和分组工具,以便您对数据进行分类和组织。
您可以根据染色体类型、标记物的强度或共表达等特征创建标记或分组策略。
FlowJo还支持自定义标注方法,让您根据实验设计和目标需求进行个性化标记和分组。
四、绘制和分析标记和分组完成后,您可以开始使用FlowJo的分析功能进行数据可视化和绘制图形。
FlowJo提供了多种绘图工具,如散点图、直方图、线图等,用于可视化和展示您的数据。
您可以在图表中添加坐标轴标记、图例、标题等,以便更好地展示数据信息和结果。
FlowJo还支持多种数据分析方法,如聚类分析、细胞分型、统计学测试等,帮助您从数据中提取更多的信息和结论。
flowjo中文使用手册

flowjo中文使用手册
FlowJo是一款由美国斯坦福大学Leonard Herzenberg(FACS机器的发明者)实验室在90年代研发的流式数据分析软件。
以下是它的中文使用手册部分内容:
1. 安装:下载安装程序,双击安装;
2. 运行:安装完成后,双击桌面快捷方式运行程序;
3. 许可证:如果有加密狗,可直接使用;如果没有,可以申请试用版或者购买许可证;
4. 演示模式:如果是演示版,可以点击"Demo FlowJo"运行演示模式。
实际的使用手册可能会因软件的版本不同而有所差异。
如果需要更详细的信息,请查看FlowJo官方网站或联系该软件的客服团队。
flowjo中文使用手册

flowjo中文使用手册摘要:1.引言2.FlowJo 的使用方法3.FlowJo 的功能介绍4.常见问题及解决方案5.结论正文:【引言】FlowJo 是一款用于中文文本处理的人工智能助手,可以帮助用户进行文本分析、生成、翻译等操作。
本手册将为您详细介绍如何使用FlowJo,以及它的功能和使用方法。
【FlowJo 的使用方法】1.下载与安装:首先,您需要在官方网站上下载FlowJo,并按照提示进行安装。
安装完成后,打开FlowJo 客户端,即可开始使用。
2.注册与登录:在第一次使用FlowJo 时,您需要注册一个账号并登录。
注册时,请务必使用常用邮箱和密码,以便在忘记密码时进行找回。
3.导入与分析文本:登录后,您可以选择导入文本文件或直接输入文本进行分析。
FlowJo 支持多种文本格式,如.txt、.docx、.pdf 等。
【FlowJo 的功能介绍】1.文本分析:FlowJo 可以对输入的文本进行情感分析、主题分析、关键词提取等操作,帮助您快速了解文本内容。
2.文本生成:FlowJo 可以根据用户输入的关键词或主题,生成与之相关的文章、诗歌等文本。
3.文本翻译:FlowJo 支持多种语言之间的翻译,包括中英、中日、中韩等。
4.文本纠错:FlowJo 可以对输入的文本进行语法检查和纠错,帮助您提高写作质量。
【常见问题及解决方案】1.问题:导入的文本无法分析。
解决方案:请检查导入的文本格式是否正确,或尝试重新导入。
2.问题:生成的文本质量不高。
解决方案:请提供更具体的关键词或主题,或尝试提高生成文本的质量等级。
3.问题:翻译结果不准确。
解决方案:请检查输入的文本是否存在歧义,或尝试提高翻译的质量等级。
【结论】FlowJo 是一款功能强大的中文文本处理助手,可以帮助用户快速处理文本,提高写作效率。
flowjo中文使用手册
flowjo中文使用手册(原创实用版)目录1.引言2.FlowJo 软件简介3.FlowJo 的功能与应用4.FlowJo 的使用方法与技巧5.结论正文【引言】随着生物科学研究的不断发展,数据分析与可视化工具在实验中的应用越来越广泛。
FlowJo 是一款专业的流式细胞仪数据分析软件,适用于科研和临床实验室。
本文将为您介绍 FlowJo 软件的简介、功能与应用、使用方法与技巧,帮助您更好地掌握这一强大的数据分析工具。
【FlowJo 软件简介】FlowJo 是一款功能强大的流式细胞仪数据分析软件,适用于各种类型的流式细胞仪。
它集数据采集、分析、存储和可视化为一体,为用户提供了一站式的解决方案。
FlowJo 支持多种数据格式,如 FCS、FLOW、CSV 等,能够满足不同品牌和型号的流式细胞仪数据处理需求。
【FlowJo 的功能与应用】FlowJo 具有以下主要功能和应用:1.数据预处理:对原始数据进行去噪、补偿、统计等操作,提高数据质量。
2.数据分析:提供多种分析算法,如细胞计数、细胞分类、细胞周期分析等,满足不同实验需求。
3.数据可视化:提供多种图表展示形式,如散点图、直方图、伪三维图等,方便用户直观地观察和分析数据。
4.报告生成:支持生成实验报告,包括数据表格和图表,方便用户撰写论文和汇报。
5.数据管理:支持数据导入、导出和备份,便于用户管理和共享数据。
【FlowJo 的使用方法与技巧】1.安装与运行:根据软件官网提供的安装教程,下载并安装相应版本的 FlowJo。
安装完成后,运行软件并连接到流式细胞仪。
2.数据采集:启动流式细胞仪,采集数据并保存到本地。
然后,在FlowJo 中打开数据文件,进行预处理和分析。
3.数据分析:根据实验需求,选择合适的分析算法。
例如,进行细胞计数时,可以使用“细胞计数”功能;进行细胞分类时,可以使用“聚类分析”功能。
4.数据可视化:在数据分析完成后,选择合适的图表类型,如散点图、直方图等,将分析结果进行可视化展示。
flowjo 使用申请

FlowJo 使用申请FlowJo 是常用的流式细胞术数据分析软件,流式细胞术广泛应用于细胞生物学、免疫学、遗传学等学科领域。
FlowJo 可以将流式细胞术数据转化为多种形式的图形和报告,方便了研究人员对细胞样本进行深入研究和分析。
本文将介绍FlowJo 的使用申请和使用方法,希望能够帮助有需要的研究人员。
FlowJo 使用申请首先,您需要下载并安装FlowJo 软件,安装完成后需要向软件开发商申请使用许可。
FlowJo 提供了两种许可方式:单机许可和网络许可。
单机许可是指在一台计算机上安装 FlowJo 软件并使用许可,这种方式适用于只有一个人需要使用 FlowJo 的情况。
网络许可则适用于多人共享的情况,可以在局域网内共享FlowJo 软件,这种方式可以在多个计算机中使用FlowJo,使用更加灵活便捷。
您可以在FlowJo 的官方网站上了解更多关于许可方式的信息。
FlowJo 安装和使用安装FlowJo 软件非常简单,只需要下载软件并按照提示进行安装即可。
安装完成后,您可以打开软件并导入数据进行分析。
FlowJo 的主要界面分为两个部分,左侧是样本列表和统计信息,右侧则是绘图区域和结果报告。
您可以使用FlowJo 的多种分析工具来处理您的数据,例如分类分析、群体分析和细胞凋亡分析,您还可以根据需要自定义计算方法。
在使用 FlowJo 进行数据分析时,我们需要特别注意以下几点:1.数据预处理:在导入数据之前,我们应该对数据进行预处理,例如去除噪声和异常值、进行校准等操作,以保证数据的准确性和可靠性。
2.数据清洗:在进行分析之前,我们需要对数据进行清洗。
清洗过程包括去除无效的事件和错误的标签等等。
如果不进行数据清洗,则会对分析结果产生负面影响。
3.分析方法选择:在进行分析之前,我们需要明确分析的目的。
根据不同的目的,我们可以选择不同的分析方法,例如聚类分析、差异分析等等。
4.结果报告:分析完成后,我们需要对结果进行报告。
FlowJo软件的简单介绍和基本应用
FlowJo 软件的简单介绍和基本应用FlowJo 是九十年代美国斯坦福大学Leonard Herzenberg(FACS 机器的发明者)实验室研发的一款流式数据分析软件。
这款分析软件功能强大,操作简单,易学易用,可在Windows 或者Mac 系统下安装使用。
它简单直观的操作平台,已被领域内的科学家、实验室广泛使用。
同时,他也是各期刊杂志引用最多的流式数据分析软件。
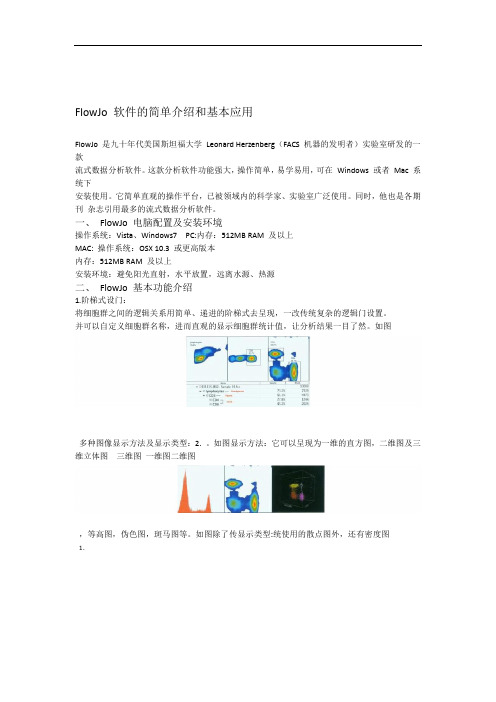
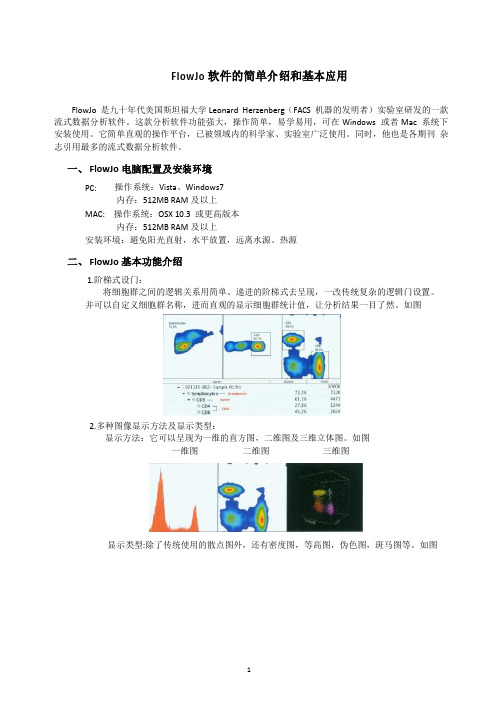
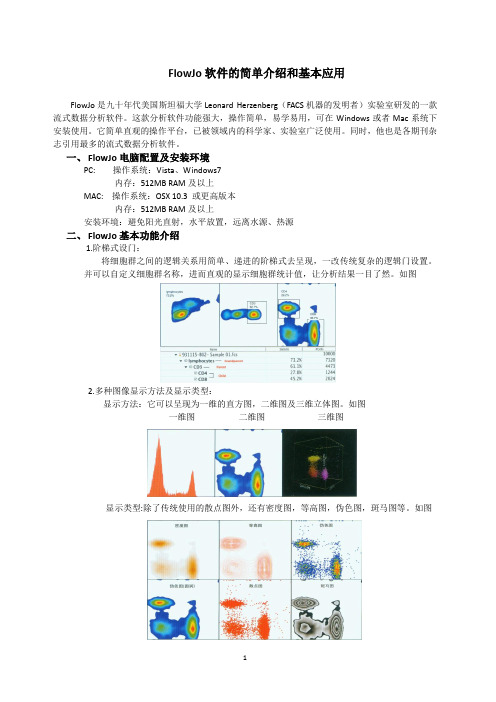
一、FlowJo 电脑配置及安装环境操作系统:Vista、Windows7 PC:内存:512MB RAM 及以上MAC: 操作系统:OSX 10.3 或更高版本内存:512MB RAM 及以上安装环境:避免阳光直射,水平放置,远离水源、热源二、FlowJo 基本功能介绍1.阶梯式设门:将细胞群之间的逻辑关系用简单、递进的阶梯式去呈现,一改传统复杂的逻辑门设置。
并可以自定义细胞群名称,进而直观的显示细胞群统计值,让分析结果一目了然。
如图多种图像显示方法及显示类型:2.。
如图显示方法:它可以呈现为一维的直方图,二维图及三维立体图三维图一维图二维图,等高图,伪色图,斑马图等。
如图除了传显示类型:统使用的散点图外,还有密度图1.多种设门工具:3..的目标细胞群是规则分布设门是流式数据分析中界定细胞目标群的必要手段,不管检测便的界定各种细胞群。
如图还是不规则分布的,是小概率事件还是集体事件,都可以很方矩形门、椭圆门、自动门蜘蛛门四分门4.多种分析平台及工具:胞周期,细胞增殖,钙离子流量,反向设门等。
特殊的分析平台:细的批处理,样品的荧光补偿。
独特的分析工具:门灵活方便的数据导出:5.或直接打印,输出的表软件、Powerpoint 无论是图形数据还是表格数据都可以用Ofice SQL 等格式。
格数据可保存为HTML,的基本应用:三、FlowJo1.单标样本的分析方法:软件工作台由菜单栏、工具栏、组空间双击桌面Flowjo 软件图标,进入软件工作台。
FlowJo中文使用说明书
FlowJo中文实用手册(软件版本:FlowJo7.6.5 2012/06/20 更新)第一章 FlowJo简介 (1)一、FlowJo对电脑配置的要求 (1)二、FlowJo的安装过程(Windows) (1)三、FlowJo的工作台 (5)第二章 FlowJo分析单标样本 (6)一、由原始数据生成单参数直方图的过程 (6)二、图形的输出和保存 (10)第三章 FlowJo分析多色标记样本 (13)一、由原始数据生成二维点图的过程 (13)二、二维点图的设门原则 (16)三、多色标记分析说明 (16)第四章 FlowJo软件荧光补偿 (18)一、用FlowJo做荧光补偿并进行数据分析的步骤 (18)二、FlowJo荧光补偿的具体步骤 (18)三、双指数转换 (24)第五章 FlowJo的批处理功能 (27)一、设门分析的批处理 (27)二、表格分析的批处理 (32)三、图形分析的批处理 (35)第六章 FlowJo分析细胞凋亡样本 (43)一、细胞凋亡概述 (43)二、FlowJo分析凋亡数据的过程 (44)三、凋亡数据结果分析 (45)第七章 FlowJo软件分析细胞周期样本 (47)一、细胞周期分析概述 (47)二、FlowJo分析细胞周期数据的过程 (48)三、细胞周期拟合的调整方法和步骤 (51)四、细胞周期结果分析 (53)第一章 FlowJo简介FlowJo是美国斯坦福大学Leonard Herzenberg(FACS机器的发明者)实验室在90年代研发的一款流式数据分析软件。
FlowJo由于功能强大,简单易用,已经被领域内的科学家、实验室广泛引用;同时FlowJo也是各高影响力核心期刊引用最多的流式数据分析软件。
一、FlowJo对电脑配置的要求1. PC电脑:操作系统:Windows XP,Vista,Windows7内存:512MB及以上网络连接:使用试用序列号及联网序列号必需要有网络连接;加密狗无需网络2. 苹果电脑:操作系统:OSX10.3或者更高版本内存:512MB及以上网络连接:使用试用序列号及联网序列号必需要有网络连接加;密狗无需网络二、FlowJo的安装过程(Windows)•请到我们的网站上下载最新版本:/content/download在此,我们下载V7.6.5 为例/sites/default/files/7.6.5_X32.exe 将文件下载到桌面之后,就可以看到FlowJo安装程序图标。
FlowJo中文使用说明书

FlowJo中文使用说明书FlowJo是一款广泛用于流式细胞仪数据分析的软件,它提供了强大的工具和功能,帮助研究人员快速准确地分析和解读实验数据。
本文将为您详细介绍如何在FlowJo中文版本中进行数据分析和操作。
1. 软件下载和安装首先,您需要从FlowJo官方网站上下载适用于您操作系统的软件安装包。
下载完成后,按照安装向导的提示进行安装。
安装完成后,您可以打开FlowJo软件开始使用。
2. 导入数据文件在FlowJo中文版本中,您可以通过“文件”菜单中的“导入”选项来导入实验数据文件。
您可以导入FCS格式的流式细胞仪数据文件,也可以导入其他格式的数据文件,如CSV文件等。
导入完成后,您将在软件中看到您导入的数据文件。
3. 数据分析在FlowJo中文版本中,您可以使用各种工具和功能来进行数据分析。
比如,您可以通过绘制散点图、直方图等图表来展示数据分布情况;还可以使用统计分析功能来进行数据分析和对比;另外,您还可以进行细胞亚群分析等操作。
4. 结果展示在FlowJo中文版本中,您可以自定义图表的样式和颜色,使得您的数据结果更加清晰、直观。
您可以将结果导出为图片或PDF格式,以便在论文中使用或与他人分享。
5. 其他功能除了上述功能外,FlowJo中文版本还提供了许多其他实用的功能,如自动补偿、样本比较、批量分析等。
您可以根据您的实验需求来灵活运用这些功能,提高数据分析的效率和准确性。
总结:通过本文的介绍,相信您已经对FlowJo中文版本的使用有了一定的了解。
在进行流式细胞仪数据分析时,FlowJo将是您强大的助手,帮助您快速准确地分析和解读实验数据。
祝您在科研道路上取得更多的成就!。
流式软件FlowJoVX10的超详细图文讲解

流式软件FlowJoVX10的超详细图文讲解一安装教程软件下载以后,解压缩,找到这个图标,鼠标左键双击,打开软件。
就是下面这个工作页面:二FlowJo VX10使用教程流式数据分析的过程就是在流式图上选门和设门的过程。
门:在流式图上人为设定的区域。
设门:用门选择某一特性细胞的过程。
处理流式数据(1)打开保存的数据,不同的流式仪器用的系统不同,例如BD CellQuest Pro 系统(calibur);DIVA系统(canto、Fortessa、Aria、celesta),但数据分析用的都是FlowJo VX软件,数据保存时选择FCS格式。
直接把FCS格式的文件夹拖进空白区域。
操作结果如下:(2)调节补偿(在上样时可以在DIVA系统上自动/手动调节补偿,但有时因为仪器预约时间问题,故也可以在数据分析时用Flow Jo 调节补偿)①点击compensation,把单染管拖到空白区域②单染管拖到空白区域后,补偿编辑器被点亮③点击补偿编辑器,出现以下界面FlowJo VX默认设的门与我们的目的细胞群不在一个位置,需要自己调整,左键双击A图,重新设门;再左键双击B图,调整阴阳门的位置,如下图所示:注意:A. 调补偿时,选择区域门工具,阴性门和阳性门设在细胞群分布的中心区域,也就是峰顶,不用把整个峰都包含住;B. 如果单染管的直方图没有明显的双峰,设门时,阴性门和阳性们的距离尽可能远;C.调补偿时尽量选择强阳性的信号,不在乎阳性群体细胞数量的多少,也就是直方图中Y轴的高度,关键是要与阴性群分的开。
④补偿调完以后,点击“Apply To Group---All sample”,运用到所有样品中(3)正向设定逻辑门①左键双击调过补偿的fcs格式数据出现流式散点图(建议首先对空白组细胞先处理),如下图所示②设门,根据实验目的选择合适的设门工具,(以淋巴细胞群为例,圈住并命名,点击OK确定)③一直按着鼠标左键,将已处理的文件lymphocytes拖到All samples中,进行批量处理结果如下:④左键双击圈门部位(淋巴细胞群),根据实验目的以及染料的荧光激发/发射波长,选择流式图合适的横坐标和纵坐标,以横坐标为percp-cy5.5-CD3,纵坐标为SSC为例,看CD3+T cell的比例⑤将CD3 T也拖到lymphocytes中,批量处理(每分析完一级,都可以拖到上一级,进行批处理),并且可以通过点击右上角绿色按钮(⑤标记处)查看所有样品的设门是否合适,因为有些样品会进行对照处理,如若不合适,可手动微调。
11_流式分析方法

Flowjo 是现在最受欢迎的流式数据分析软件,由于它简朴易用并且十分有效。
则本文将其基本操作以及对细胞凋亡和细胞周期的 Protocol 分享给大家。
1.打开 Flowjo 软件双击桌面 FlowJo 软件图标,进入软件工作台。
或软件工作台由菜单栏、惯用工具栏、组空间和样本空间构成。
2.F lowjo 分析单标样本单标记样本数据惯用的显示方式是单参数直方图。
普通横坐标能够是线性标度或对数标度,代表着所检测的荧光或散射光的强度;纵坐标表达的是横坐标某一特定荧光强度的细胞数,有时也用相对比例来体现。
以 3 color comp 文献夹中的 CyPE comp.fcs 进行分析演示。
将此文献夹移至桌面,并把该数据文献夹从桌面拖入 Flowjo 中的组空间中。
在组空间中单击选中“3 color comp”组,此时在样本空间里显示“3 color comp”组中的全部样本。
而后在样本空间中双击“Cy5PE comp.fcs”,出现图形窗口。
此为二维点图,X 轴选择 SSC(侧向散射,细胞内颗粒构造越复杂,质量越大,SSC 越大,反之越小。
)Y 轴选择 FSC(前向散射,细胞越大,FSC 越大;反之越小。
)选择设门工具(矩形门、椭圆门、多边形门、自动门)中的任意一种,在二维点图中选中淋巴细胞。
在图形窗口中双击选中的淋巴细胞,生成新的图形窗口。
在 X 轴选择 Cy5PE:CD4,Y 轴选择 Histogram,选择设门工具(区域门、双分门)中任意一种,在单参数直方图中设门。
3.F lowjo 分析多色标样本多色标记样本,包含双标记、三标记及以上的样本。
横坐标和纵坐标分别代表与细胞有关的两个独立参数,平面上的每一种点表达含有对应坐标值的细胞。
以三标记样本为例,选择 3-color-experiment 文献夹中的 931115-B02- Sample01.FCS 进行分析演示。
同样,在在样本空间中双击“931115-B02-Sample01.FCS”样本,出现图形窗口,显示为二维点图。
flowjo中文使用手册

flowjo中文使用手册摘要:一、引言1.介绍FlowJo软件2.软件在我国的应用领域3.中文使用手册的目的和作用二、FlowJo软件基本操作1.软件的安装与启动2.界面布局与功能模块3.基本操作与快捷键三、数据导入与预处理1.数据文件格式支持2.数据导入步骤与方法3.数据预处理功能与技巧四、数据分析和可视化1.数据分析方法与工具2.数据可视化类型与技巧3.自定义图表与报告五、FlowJo软件的高级功能1.高级数据分析方法2.数据存储与导出3.软件配置与优化六、常见问题与解决方案1.软件运行中遇到的问题2.数据处理与分析中的常见问题3.解决问题的方法和技巧七、总结与展望1.软件的优势与不足2.在我国的发展前景3.对用户的使用建议和展望正文:一、引言FlowJo是一款功能强大的流式细胞术数据分析和可视化软件,广泛应用于生命科学研究、临床检测和药物研发等领域。
随着在我国的应用逐渐普及,为了方便广大用户更好地使用该软件,我们推出了中文使用手册,旨在帮助用户快速掌握软件的使用方法,提高数据分析效率。
二、FlowJo软件基本操作FlowJo软件的安装过程简单,只需根据安装向导完成操作。
安装完成后,启动软件,用户可以看到简洁直观的界面,以及丰富的功能模块。
在软件中,用户可以进行基本操作,如数据导入、预处理、分析和可视化等。
此外,软件还提供了快捷键功能,方便用户快速操作。
三、数据导入与预处理FlowJo支持多种数据文件格式,如FCS、CSV、TXT等。
用户可以根据需要选择合适的数据文件导入软件。
数据导入后,可以通过软件提供的预处理功能对数据进行清洗、筛选和归一化等操作,为后续分析做好准备。
四、数据分析和可视化FlowJo提供了丰富的数据分析工具和方法,如聚类分析、细胞周期分析、凋亡分析等。
用户可以根据需求选择合适的方法对数据进行分析。
同时,软件支持多种数据可视化类型,如散点图、直方图、热图等。
用户可以灵活运用这些可视化工具,展示数据分析结果。
FlowJo软件的简单介绍和基本应用
FlowJo软件的简单介绍和基本应用FlowJo 是九十年代美国斯坦福大学Leonard Herzenberg(FACS机器的发明者)实验室研发的一款流式数据分析软件。
这款分析软件功能强大,操作简单,易学易用,可在Windows或者Mac 系统下安装使用。
它简单直观的操作平台,已被领域内的科学家、实验室广泛使用。
同时,他也是各期刊杂志引用最多的流式数据分析软件。
一、FlowJo 电脑配置及安装环境PC:操作系统:Vista、Windows7内存:512MB RAM及以上MAC: 操作系统:OSX10.3 或更高版本内存:512MB RAM及以上安装环境:避免阳光直射,水平放置,远离水源、热源二、FlowJo 基本功能介绍1.阶梯式设门:将细胞群之间的逻辑关系用简单、递进的阶梯式去呈现,一改传统复杂的逻辑门设置。
并可以自定义细胞群名称,进而直观的显示细胞群统计值,让分析结果一目了然。
如图2.多种图像显示方法及显示类型:显示方法:它可以呈现为一维的直方图,二维图及三维立体图。
如图一维图二维图三维图显示类型:除了传统使用的散点图外,还有密度图,等高图,伪色图,斑马图等。
如图3..多种设门工具:设门是流式数据分析中界定细胞目标群的必要手段,不管检测的目标细胞群是规则分布还是不规则分布的,是小概率事件还是集体事件,都可以很方便的界定各种细胞群。
如图蜘蛛门四分门矩形门、椭圆门、自动门4.多种分析平台及工具:特殊的分析平台:细胞周期,细胞增殖,钙离子流量,反向设门等。
独特的分析工具:门的批处理,样品的荧光补偿。
5.灵活方便的数据导出:无论是图形数据还是表格数据都可以用Ofice软件、Powerpoint 或直接打印,输出的表格数据可保存为HTML,SQL等格式。
三、FlowJo 的基本应用:1.单标样本的分析方法:双击桌面Flowjo 软件图标,进入软件工作台。
软件工作台由菜单栏、工具栏、组空间和样本空间组成(见图1)。
FlowJo软件的简单介绍和基本应用
FlowJo软件的简单介绍和基本应用FlowJo是九十年代美国斯坦福大学Leonard Herzenberg(FACS机器的发明者)实验室研发的一款流式数据分析软件。
这款分析软件功能强大,操作简单,易学易用,可在Windows或者Mac系统下安装使用。
它简单直观的操作平台,已被领域内的科学家、实验室广泛使用。
同时,他也是各期刊杂志引用最多的流式数据分析软件。
一、FlowJo电脑配置及安装环境PC: 操作系统:Vista、Windows7内存:512MB RAM及以上MAC: 操作系统:OSX 10.3 或更高版本内存:512MB RAM及以上安装环境:避免阳光直射,水平放置,远离水源、热源二、FlowJo基本功能介绍1.阶梯式设门:将细胞群之间的逻辑关系用简单、递进的阶梯式去呈现,一改传统复杂的逻辑门设置。
并可以自定义细胞群名称,进而直观的显示细胞群统计值,让分析结果一目了然。
如图2.多种图像显示方法及显示类型:显示方法:它可以呈现为一维的直方图,二维图及三维立体图。
如图一维图二维图三维图显示类型:除了传统使用的散点图外,还有密度图,等高图,伪色图,斑马图等。
如图3..多种设门工具:设门是流式数据分析中界定细胞目标群的必要手段,不管检测的目标细胞群是规则分布还是不规则分布的,是小概率事件还是集体事件,都可以很方便的界定各种细胞群。
如图蜘蛛门四分门矩形门、椭圆门、自动门4.多种分析平台及工具:特殊的分析平台:细胞周期,细胞增殖,钙离子流量,反向设门等。
独特的分析工具:门的批处理,样品的荧光补偿。
5.灵活方便的数据导出:无论是图形数据还是表格数据都可以用Ofice软件、Powerpoint或直接打印,输出的表格数据可保存为HTML,SQL等格式。
三、FlowJo的基本应用:1.单标样本的分析方法:双击桌面Flowjo软件图标,进入软件工作台。
软件工作台由菜单栏、工具栏、组空间和样本空间组成(见图1)。
- 1、下载文档前请自行甄别文档内容的完整性,平台不提供额外的编辑、内容补充、找答案等附加服务。
- 2、"仅部分预览"的文档,不可在线预览部分如存在完整性等问题,可反馈申请退款(可完整预览的文档不适用该条件!)。
- 3、如文档侵犯您的权益,请联系客服反馈,我们会尽快为您处理(人工客服工作时间:9:00-18:30)。
flowjo中文使用手册
【实用版】
目录
1.引言
2.FlowJo 软件简介
3.FlowJo 的使用方法
4.应用实例
5.结论
正文
【引言】
FlowJo 是一款用于流式细胞术数据分析的软件,广泛应用于生物科学研究和临床实验室。
本文将为您介绍如何使用 FlowJo 软件进行数据分析。
【FlowJo 软件简介】
FlowJo 是一款功能强大的流式细胞术数据分析软件,适用于科研和临床实验室。
它能够对流式细胞仪产生的数据进行快速、准确的处理和分析。
FlowJo 具有用户友好的界面,支持多种数据格式,可以进行多种分析,如细胞计数、细胞分类、细胞表面标志物分析等。
【FlowJo 的使用方法】
1.打开 FlowJo 软件:在 Windows 操作系统下,点击“开始”菜单,找到 FlowJo 软件并双击打开。
2.读取数据:在软件主界面,点击“File”菜单,选择“Open”,找到流式细胞仪产生的数据文件并导入。
3.数据预处理:导入数据后,可以对数据进行预处理,如去除死细胞、
噪声等。
4.数据分析:在数据预处理完成后,可以进行数据分析。
FlowJo 提供了多种分析功能,如细胞计数、细胞分类、细胞表面标志物分析等。
5.结果导出:分析完成后,可以将结果导出为 Excel、CSV 等格式。
【应用实例】
假设我们有一份 PBMC(外周血单个核细胞)的流式细胞术数据,我们可以使用 FlowJo 进行以下分析:
1.细胞计数:通过 FlowJo 软件,我们可以对 PBMC 样本中的细胞数量进行计数。
2.细胞分类:FlowJo 可以根据细胞表面标志物的表达情况,将 PBMC 细胞分为不同的亚群,如 CD4+ T 细胞、CD8+ T 细胞等。
3.细胞表面标志物分析:FlowJo 可以分析 PBMC 细胞表面标志物的表达情况,如 CD3、CD4、CD8 等。
【结论】
FlowJo 是一款实用的流式细胞术数据分析软件,可以帮助生物科学研究人员和临床实验室人员快速、准确地分析流式细胞术数据。