基于序列保守型特征排序出基因单核苷酸多态性的优先顺序(IJEM-V1-N5-9)
基因组多态性_单核苷酸多态性和_国际人类基因组单倍型图谱计划__cropped

基因组多态性_单核苷酸多态性和_国际人类基因组单倍型图谱计划__cropped“?医学生物信息学专题杂志”专栏?基因组多态性、单核苷酸多态性和“国际人类基因组单倍型图谱计划”随着人类基因组测序计划的完成 ,人们进一步利用基因组测序的研究成果 ,深入地了解生命的基因现象 . 其中人类疾病基因组研究是一重要课题 ,并已取得了成果. 复杂性疾病是多个微效基因作用累加 ,个体对疾病的易感性并在特定的环境因素下诱发发病 . 这些基因的 SNPs 及其特定组合是研究疾病基因组的重要内容.() 个体基因组差别称为基因组多态性 gene polymorphism个体差异必须从不同个体 DNA 序列的差异上阐明人类基因的多态性 ,才能真正了解与疾病特别是多基因疾病有关的遗传机制 ,同时深入了解人类起源、进化和迁徙过程中的 DNA 序列变化. 任意两个人之间的 DNA 核苷酸差异约占基因组的 0 . 01 %. 按人类基因组共有 30 亿对碱基计算 ,将有 300 万核苷酸位点的不同. 就是这基因组中万分之一的差异 ,决定了人类的遗传多样性.基因的多态性 ,又可分为正常型和异常型 ,当存在异常型时 ,可直接导致疾病 ,成为容易患病的危险因子 ,或者影响对药物敏感性 ,不同个体对药物产生不同的反应. 基因变异存在的事实 ,且数量之多 ,其研究重点是 :弄清楚基因变体的生物学功能及其对生命、健康和疾病的意义. 如对癌症、心血管病等的易感基因还不清楚了解 ,希望从对基因变异功能的研究去提高对上述疾病发病机理的认识.基因多样性是整个生物医学研究中的组成部分 ,对复杂疾病的发生发展过程的基因定位、疾病发生的分子遗传机理、环境因子易感基因的检出、药物设计和用药均有极重要的意义. 基因组多样性研究是免疫基因组学、药物基因组学、环境基因组学和预防医学等的主要内容之一.( 基因组多态性在阐明人体对疾病、毒物的易感染与耐受性、疾病发生发展及临床表征的多样性 Clini2) cal phenotype diversity在个体对药物治疗的反应及预后上起着重要作用. 所以对疾病基因多态性研究可以揭示疾病的不同临床表型 ,也可作为实行个体化治疗的根据. 对大数量基因变体的深入研究 ,将对生命、健康和疾病均有重要的意义.( 在个体基因组的差异中 ,大多数属于 DNA 链上的单个核苷酸的不同 ,称为单核苷酸多态性 Single nu2) cleotid polymorphisms ,SNPsSNPs 是广泛分布于人类基因组中的稳定多态位点 ,最大程度地代表了个体间的遗传差异. 每组 SNPs 位点所代表的序列称为一个“始祖板块”,每个板块上全部 SNPs 的类型称为单倍型 ( ) Haplotype.( ) “人类基因组单倍型图谱计划”Haplotype map 属于遗传多态性研究范畴 ,为人类常见疾病提供简化基因分型 ,致病基因的确定等提供更多的信息.( )单倍域图谱 Haplotype Block 最初单倍型的概念是一条染色体上不同等位基因的集合 ,而在此单倍型的概念扩展为在一定范围内 SNPs 位点上相应核苷酸碱基的组合. 单倍域的生物学意义更明确 ,单倍域的发现 ,提示人类基因组有着更复杂的结构. 从不同人群中单倍域的差异 ,可以更深入了解生命现象和解释人群间对疾病易感性的差异.( )人类基因组的单核苷酸多态性 Single nucleotial polymorphisms ,SNPs遗传信息的变异是所有基因组的共同特征 ,而天然序列的变异是所有基因组的一个基本特征 ,大多数( ) 人类基因组的多态性是单碱基对的差异 ,也称单核苷酸多态性 Single nucleotide polymorphisms , SNPs是必不可少的重要信息 ,是变异中最常见的一种形式. 核苷酸是基因的组成单元 ,任何两个单倍型人类基因组都表现出多个位点和多种类型的多态性.( ) 当两个单倍型基因组比较时 ,平均每 1 ,000 个碱基出现一次单碱基差异SNPs. 有关多态性在人类基因组和人群中的类型、频率和分布的基本信息对人类遗传学的进步是极其重要的. 在人类疾病研究中利用这类信息的高通量方法也是需要的.SNPs 在单个基因或整个基因组中的分布是不均匀的. 基因组中为蛋白质编码的序列为 3 % ,在蛋白质编码的 SNPs 称为 cSNP ,它和位于表达调控序列中的 SNPs 在功能或致病方面具有更重要的意义. 其多态( ) 性称为功能多态性 Functional Polymorphism. 自然界之所以没有完全相同的个体 ,就是 SNPs 造成的.SNPs 位点并不是独立遗传的 ,而是在染色体上成组的遗传 ,即一组 SNPs 位点在一代又一代的遗传中绝少发生重组 . 于是 ,这样的每组 SNPs 位点所代表的序列被称为一个“始祖板块”,每个板块上全部 SNPs 的类型称之为单倍型 ,这里的单倍型是指一条染色体而言. 由于始祖板块在人类进化过程中是保守的 ,故只需少数几个典型的 SNPs 就可以作为该板块内单倍型的标签 ,从而获知一个板块的单倍型.SNPs 是指在基因水平由单个核苷酸的变异引起的一种 DNA 序列多态性 ,它是人类可遗传的变异中最常见的一种 ,占所有已知多态性的 90 %以上. SNPs 在人类基因中广泛存在.( ) SNPs 所表现的多态性只涉及到单个碱基的变异 , 这种变异可由单个碱基的转换 Tranrition或颠换( ) Tranrverzion所引起 ,也可由碱基的插入或缺失所致. 但通常所说 SNPs 是指前者.在基因组 DNA 中 ,SNPs 可能发生在基因序列内 ,也可能发生在基因以外的非编码序列上. 位于编码( ) 内的 SNPs coding SNP ,cSNP比较少 ,因为在内显子内 ,其变异率仅及周围序列的 1/ 5 ,但是它在遗传性疾病的研究中却有重要的意义. 所以 cSNP 的研究更受关注.) cSNP 可分为 2 种 ,一种是同义 cSNP C synonymoes cSNP即 SNPs 所致编码序列的改变并不影响其所翻( ) 译的蛋白质的氨基酸序列 ,突变与未突变碱基的含义相同 ; 另一种是非同义 cSNP nonsynonymaus cSNP指碱基序列的改变可使以其为蓝本翻译的蛋白质序列发生改变 ,从而影响了蛋白质的功能 . 这种改变常是导致生物性状改变的直接原因. cSNP 中约有一半为非同义 cSNP.SNPs 的优点及其应用 :由于 SNPs 在任一特定位点上只有 2 个等位基因 ,因此 ,与简单序列长度多态( ) 性 SSLP相比 ,其所涵盖的信息量很有限 ,似乎很难满足疾病易感基因精确定位的要求. 但这个不足可通过加大分布密度来弥补 ,而且 ,这个目标并不是难以实现的 ,因为完整的 SNPs 图谱完成之后 ,可以提供远高于此要求的密度. 有研究认为 ,1 个核苷酸重复多态性标记的信息量大约是SNPs 的 2 . 25,2 . 5 倍 . 所用 SNPs 数量虽多 ,但因检测速度快 ,故它将能最终取代 SSLP ,用于复杂性的多基因遗传病研究.( ) 人类的遗传连锁图谱至今已发展到了第三代. 第一代是限制性酶切片段长度多态性 RFLP图谱 ,第二代是微卫星标记图谱 ,第三代图谱就是 SNPs 图谱.() SNPs 用作遗传标记具有以下优点 : 1SNPs 在人群中是二等位基因的 ,在任何人群中其等位基因频率() () 都可估计出来 . 2它在基因组中的分布较微卫星标记广泛得多. 3与串联重复的微卫星位点相比 ,SNPs( ) 是高度稳定的 ,尤其是处于编码区的 SNP cSNP,而前者的高突变率容易引起对人群的遗传分析出现困() 难 . 4部分位于基因内部的 SNPs 可能会直接影响产物蛋白质的结构或基因表达水平 ,因此 ,它们本身可() 能就是疾病遗传机制的候选改变位点 . 5易于进行自动化分析 ,缩短了研究时间.由于 SNPs 具有以上优点 ,所以其应用范围较微卫星标记更加宽广 ,它对群体遗传学、制药业、法医学、癌症及遗传性疾病甚至进化的研究都将产生不可估量的影响 .( ( ) 预计今后 SNPs 将在下列领域发挥重要作用 : 1进行简单和复杂疾病的遗传连锁分析 linkage analy2() ) sis及关联分析 association analysis,用于疾病易感基因定位 : 而且其定位的精度将比微卫星标记精细得() () 多 ,可直接用于指导易感基因克隆. 2在“药物基因组学”pharmacogenomics研究中 ,可通过检测 SNPs 的( ) 遗传多态性标记揭示人群中不同个体对不同药物的敏感性差异的根本原因. 3也可用于法医研究的罪() 可变区中单个碱基对的改变 ;从上游 V 假基因序列进行序列拷贝的基因转变 gene conversion和类转变重( ) 组 CSR - switeh recoubination在同一类序列中进行序列重组产生的抗体亚型.研究者在大肠杆菌中表达 AID ,发现细菌对抗抗生素的能力上升了. 就是说基因突变率增加了 ,突变的倾向是 C - T 和 G - A ,说明 AID 确实具有对脱氧胞苷的脱氨能力.高血压的“多基因疾病”研究人类基因疾病分为单基因疾病和多基因疾病. 多基因疾病所涉及的易感基因数量多 ,发病原理也更复杂. 对多基因疾病的易感基因的定位和克隆已成为国际上疾病基因组学研究的重点. 对多基因疾病的易感基因的精确定位 ,只是多基因疾病的研究的第一步 . 高血压是人类心脑血管疾病中危害最大的一种多基因疾病. 世界各国科学家在竞相寻找引起高血压的易感基因 ,发现人类 2 号染色体 2q 14q 23 区域均存在高血压的易感基因. 已对定位区段内及其附近的 25 个高血压候选基因进行了单核苷酸多态性( ) SNPs的检测 ,以便在缩小的范围内 ,最终找到了高血压的易感基因.利用基因变异进行挽救生命研究( ) 在体细胞过渡突变 somatic hypermutation过程中 ,抗体基因以比其它基因组快 100 万倍速度随机聚集突变的细胞 ,制造出最好的抗体 B 细胞激增 ,当再次遇到同样病原体时 ,它们会作出最好的有效免疫反应 .当受到病毒或其他入侵物时 ,人体内一些 B 细胞制造出数百万特殊抗体作为第一道防线 ,这些 B 细胞穿过淋巴器外膜 ,调节对付入侵者的抗体武器库.美国两个研究单位的工作均显示 DNA 聚合酶 h 在体细胞过度突变过程中确实发生作用.复杂疾病的 DNA 连锁图蛋白质的核苷酸密码赋予人们不同的特征 ,也包括个体的疾病倾向性 . 有助于查明具有心脏病、糖尿病、高血压、精神分裂症、骨质疏松症等及其他复杂疾病倾向性个体的 DNA 差异.这是由 Rutgers 大学遗传系的计算遗传学实验室将由 SNP 协会提供的数据以创造出包含有 2000 个单( ) 核苷酸多态性 SNPs相互作用的图谱. SNPs 是许多人共有的 DNA 变异. SNPs 为查明某个疾病相关基因提供捷径 ,容易定位 ,容易将它们作为标记来跟踪基因. 许多 SNPs 位于疾病相关基因中 ,而有些在疾病基因附近.( )“国际人类单倍型图谱计划”HapMap( ) HGP“国际单倍型图谱计划”是人类基因组计划的延伸 ,是新一代的人类基因组图谱 ,是“了解人类() 疾病最重要的基因组计划”DNA. 人类的遗传信息都包含在脱氧核糖核酸分子上. DNA 是由 4 个不同的碱基以成对的方式组成的 ,或者说以“字母”组合而成的. 人类基因组共有 30 亿对碱基. DNA 碱基一共有 A 、T、G、C 四种 ,这四个字母以一定的顺序排列组合 ,四种碱基的比例关系为 A/ T = G/ C = 1 . HGP 已经基本测出了这 30 亿对“字母”的排列顺序. 不同的个体感染疾病的程度不同、对药物产生的不同反应 ,很可能是由于碱基之间的变异造成的. 找到这些碱基之间的遗传差异 ,以尽快地攻克威胁人类健康的顽疾. 人之间基因组的“字母”排列顺序绝大多数是一致的 ,但也存在着极小差异 ,主要体现在 DNA 个别位置上( “字母”拼写有所有同 , 这种遗传性变异被称为“单核苷酸多态性”Single nucleotide polymorphisms ,) SNPs是人类 DNA 序列的差异. 人类基因组中约有 1000 万个“单核苷酸多态性”,个体对于疾病的不同易感程度、对药物的不同反应 ,认为是受到“单核苷酸多态性”影响决定的.人类基因组计划 1990 年 10 月启动 ,目标是破译人类全部遗传信息 ,发现人类所有基因并清楚其位置和功能. 对揭示生命奥秘 ,加深了解疾病本质 ,提高医疗健康水平有极其重要的意义 . 2000 年 6 月人类基因组草图绘成 ,正式图于 2003 年 4 月完成. 这只是完成基因组稳定的一面 ,未能反映其变异或多态的一面. “人类基因组单核苷核多态性”的研究正是反映这种多态性 ,而“单倍型图谱计划”则是加速对“人类基因组单核苷酸多态性”的研究. 单倍型图是人类基因组的遗传整合图 .识别出人类基因组的所有“单核苷酸多态性”是重要的 ,但是对 SNPs 的研究通过对整个人类基因组的分析来实现 ,其工作量极大 . 实际上 ,在 DNA 上位置比较接近的很多“单核苷酸多态性”,会组成所谓“单倍型块”,每个块大约包含上万个“字母”,并可作为一个整体而遗传 ,通过其中极少数的几个标记“单核苷酸多态性”就可以识别出不同的“单倍型块”. “国际单倍型图谱计划”的目标 ,正是为了绘出人类基因组的“单倍型块”,以及不同“单倍型块”的标记“单核苷酸多态性”. 通过这种方法为寻找人体致病基因提供一条捷径. 由此得到的单倍型图谱 ,将为利用人类基因组图谱寻找与疾病有关的遗传基因的变异 ,即单倍型图谱可更快地确定致病的基因.“国际遗传变异图谱计划”是于 2002 年 10 月 29 日正式启动 . 自 2000 年 6 月人类基因组草图宣告绘成后 ,人类基因组学领域又有新计划 :由美、英、中、日、加等国共同参与的“国际遗传变异图谱计划”是一国际性合作. 其正式名为“国际单倍型图谱计划”. 该计划对中国人相对来说更接近 ,将直接选取汉族人的血液样本进行研究. 其宗旨是为了加速识别与癌症和心脏病、糖尿病、哮喘等常见疾病有关的多种致病基因. “国际单倍型图谱计划”是将人类基因组成果真正应用于医疗实际工作方面迈出的关键一步.“国际单倍型图谱计划”预计将于 3 年内完成. 计划从美国、亚洲和非洲采集血液样本 ,从中提取 DNA () 脱氧核糖核酸进行分析 ,研究工作的过程将在确保调查对象完全知情同意下进行 .人类基因组的序列图只反映了基因组稳定的一面 ,并未反映其变异多态的一面 ,而正是这种基因组的多态性 ,即序列排列的差异构成的个体与群体的差异形成了对疾病的不同易感性、对药物及环境等因素的不同反映的遗传学基础. 人类基因组中的多态性 ,最简单最多见的形式就是发生在基因组中的单个核苷酸 ,即SNPs ,可以认为是 DNA 序列的差异 ,SNPs 是重要的遗传标志之一 ,可以认为SNPs 确实可使人易患病 ,或影响其对药物的敏感性 ,DNA 序列变化对生命、对疾病、环境攻击和对疾病治疗反应产生重大影响. 而单倍型图谱则是快速研究SNPs 的有效途径 ,在 HGP 已进入绘制更精确的完成图阶段 ,新启动的“国际单倍型图谱计划”既是利用了人类基因组计划的成果 ,又是对其补充和发展.相关资料“人类基因组单倍型图计划”的主要任务() 对于人类的所有生命活动 ,基因是最基本的. 基因是由脱氧核糖核酸 DNA 构成. 人类的 99 . 9 %的 DNA 都是相同的 ,但没有两个人的 DNA 完全一致 ,除非是同卵双生子. 不同个体的 DNA 之间的差异称为遗传多态性. 这些信息解释了个人之间的一些区别 ,例如眼睛的颜色和血型. 同时 ,遗传多态性还部分解释了为什么有些人会患上诸如癌症、糖尿病、哮喘和抑郁症之类的疾病 ,而另一些人却不会 . 但是 ,饮食、体育锻炼、吸烟、有害物质和其他因素也会影响疾病的产生 ,这些使研究人员目前很难判断哪个基因是致病的.研究人员将通过收集来的样本 ,寻找遗传变异的常见模式 . 通过对这些常见模式的研究 ,研究人员希望找到与疾病有关的基因 . 在了解这些基因是如何导致疾病之后 ,研究人员就能设计出更好的预防、诊断和治疗疾病的方法 ,同时还可研发出适于更多人的、疗效更好的药物.析 ,又准确了解人类起源、进化和迁徙过程中的 DNA 序列变化 ,人类起源进化迁徙历史的研究等提供完整的人类基因组信息和有效的研究工具.单倍型图的绘制 ,将为不同群体的遗传多态性研究、疾病和遗传关联分析、致病基因和致病因子的确定、药效及副作用和疾病风险的分析、人类起源进化迁徙历史的研究等提供完整的人类基因组信息和有效的研究工具. 可以说 ,只有在单倍型图建立后 ,人类基因组的遗传图、物理图、转录图和序列图对于医学的意义才能完全体现.这一计划的目的是在完成人类基因组序列测定 ,即了解人类遗传变异的基本信息之后 ,进一步确立世界上主要人群基因组的常见 DNA 变异.“人类基因组单倍型图计划”属于遗传多态性研究范畴. 为人类常见疾病提供简化有关基因分型 ,使基因组分型更全面、准确和精细为人类不同群体的遗传多态性研究 ,致病基因的确定等提供更多的信息.只有在单倍型图谱建立后 ,人类基因组的遗传图、物理图、转录图和序列图对于生物医学的意义才能完全实现.单倍域图谱在后基因组时代 ,功能基因组研究成为关注热点. 功能基因组研究是建立在基因组多样性的基础上( ) 的 ,在以 SNPs 为重点的多样性研究、绘制人类基因组单倍型图谱haplotype map 过程中 ,又提出了单倍域的新概念 ,单倍域图谱有可能取代最初绘制单倍型图谱的计划.SNPs 和 Haplotype虽然利用 SNPs 信息寻找疾病基因 ,科学家发现 SNPs 变化数量之大 ,但是在染色体某些片断上 ,它们却仅仅只有少数几种组合方式 ,这些不同的组合方式即是 SNPs 单倍型 ,最初单倍型的意义是一条染色体上 ,不同的等位基因的集合 ,而在这里单倍型概念扩展为在一定范围内 SNPs 位点上相应核苷酸碱基的组合 .单个 SNP 与疾病无相关性 ,而几个 SNPs 的集合———单倍型与疾病有良好的相关性. 但是 SNPs 的单倍型仍各有其运用范围 , 主要取决于 contributing SNP 是否被检测到 , 被检测区域的 LD 跨度有多长. 当 Causative SNP 数目小于单倍型数目时 ,基于 SNPs 的分析更为有效 ,而单倍型数目在 4 - 5 或以下时 ,则基于单倍型的分析是有效的. 在大多数情况下 ,SNPs 的集合即单倍型的分析是更为有力的 .单倍型和单倍域( 研究发现 ,染色体上存在着连续、稳定的几乎没有被重组所打断的单倍型范围 ,称之为单倍域 Haplo2) type Block,单倍域很可能是遗传的最小单位 ,在极端情况下 ,它可以是一个单独的 SNP ,或者是一整条染色体 ,事实上往往其中很少的一部分单倍型就可以包括大部分的基因状态 ,在分型时可省节大量工作量 ,而对延续范围更广的单倍域则节省更多工作量.两个相邻单倍域的交界位置 ,称为单倍域的断点 ,断点是否与“重组热点”存在密切关系 ? 找到相应证据 ,则单倍域的生物学意义更明确.单倍域的发现 ,提示人类基因组中有着高度的复杂结构 ,绝非单纯的碱基变异的组合与任意的组合 . 单倍域的确定存在 ,就可以找到相当部分的统一的单倍域结构 ,不同人群中的单倍域的差异 ,不仅可以解释其自身独特的历史迁徙情况 ,也可以解释人群间某些疾病易感性的差异.部分资料摘自 < Bio - info China > < Biosino >。
浅谈单核苷酸多态性、单倍型及连锁不平衡

浅谈单核苷酸多态性、单倍型及连锁不平衡单核苷酸多态性,单倍型及连锁不平衡是一些基因组学领域中的重要概念。
它们在遗传学、系统发育学、植物学等多个领域都有重要的应用。
本文结合实例,从科学角度讨论单核苷酸多态性、单倍型及连锁不平衡。
一、单核苷酸多态性单核苷酸多态性是指一个特定位点中,有多种可能出现的单核苷酸类型。
一般情况下,在一个特定基因序列位点中,只有一种基因序列类型出现,而单核苷酸多态性是指在同一个序列位点可以出现多种基因序列类型。
单核苷酸多态性的发现,是由于多核苷酸的突变。
在基因组的多核苷酸中,突变的发生十分频繁,因此,同一个序列位点中可能出现多种基因序列类型。
此外,在不同的基因序列变异中,有可能出现多种单核苷酸类型。
举一个实例来说明,在某个植物体细胞中,一个序列位点中有三种基因序列类型(A、T、C),则该位点即为单核苷酸多态性。
研究表明,单核苷酸多态性可以影响基因组的表达,从而对生物功能产生影响。
二、单倍型单倍型是指在一个特定的位点上,一个特定的基因序列(如A、T、C)只出现一次,而另一个基因序列(如A、T、C)并不存在。
在基因组中,单倍型类型是非常普遍的,特别是在低等生物中,如细菌和植物体。
单倍型的作用,主要是在保护基因组的稳定性,保持基因的父代性,并且有助于基因的修复。
在某些特殊的情况下,如当有多个基因突变的发生时,单倍型可以避免突变的严重性。
单倍型也有助于细胞的正常功能,保持基因的进化性。
三、连锁不平衡连锁不平衡是指在父亲染色体和母亲染色体中,有一个染色体比另一个染色体多出一些基因序列,而一些基因序列可能不存在,这样会造成染色体的不平衡状态。
连锁不平衡的发生,主要是由于基因突变和特殊的多倍体细胞状态等原因,如非整倍体多倍体,双胞多倍体等,这些都可能会造成连锁不平衡的产生。
连锁不平衡对生物功能的影响很大,可能会造成生理因素的改变,如某些遗传性疾病的发生率增加,有些基因表达水平的改变,以及免疫系统的改变等等。
全基因组单核苷酸多态性交互作用识别方法研究

单位代码 10635学号112015*********硕士学位论文全基因组单核苷酸多态性交互作用识别方法研究论文作者:刘捷指导教师:王峻副教授学科专业:计算机应用技术研究方向:机器学习,生物信息学提交论文日期:2018年4 月8 日论文答辩日期:2018年5 月26日学位授予单位:西南大学中国•重庆20 18年5月目录摘要 (I)Abstract (III)1绪论 (1)1.1研究背景和意义 (1)1.2国内外研究现状 (2)1.3本文的主要内容 (6)1.4本文的组织结构 (7)2单核苷酸多态性(SNP)交互作用相关概念 (9)2.1单核苷酸多态性(SNP)相关概念 (9)2.2SNP交互作用与相关模型 (10)2.2.1SNP交互作用 (10)2.2.2SNP交互作用模型 (11)2.3本章小结 (14)3基于病例对照组(case-control)的高阶SNP交互作用识别方法研究 (15)3.1HiSeeker基本原理 (16)3.1.1第一阶段:候选两位点组合选择 (16)3.1.2第二阶段:高阶SNP交互作用识别 (21)3.2实验结果分析 (24)3.2.1模拟实验结果分析 (24)3.2.2真实实验结果分析 (29)3.2.3实验参数设置 (31)3.2.4运行时间分析 (32)3.3本章小结 (33)4基于三元家庭(trio families)的SNP交互作用识别方法研究 (35)4.1TrioMDR基本原理 (36)4.1.1基因型维度约简 (36)4.1.2互作效应建模 (38)4.1.3半参数P-value校正机制 (39)4.2实验结果分析 (41)4.2.1模拟数据生成 (41)4.2.2I型错误率对比 (43)4.2.3识别能力对比 (46)4.2.4运行时间分析 (48)4.2.5参数敏感性分析 (48)4.3本章小结 (49)5总结与展望 (51)5.1论文总结 (51)5.2论文展望 (52)参考文献 (53)附录 (61)致谢 (67)发表论文及参加课题一览表 (69)摘要全基因组单核苷酸多态性交互作用识别方法研究计算机应用技术专业硕士研究生刘捷指导教师王峻副教授摘要全基因组关联研究(GWAS)已广泛应用于人类疾病的遗传机制研究中,然而目前GWAS识别出的单个的与疾病相关的单核苷酸多态性(Single nucleotide polymorphism,SNP)位点仅能解释复杂疾病的部分遗传特性。
-群体遗传学-单核苷酸多态及等位频率

(3)如果个体是A/A杂合子,同源染色体PCR产物相同, 都含有A,而含有A的没有被酶切断,长度仍然是427bp, 最后的片段共一个,长度:427bp。经过扩增后开始电泳, 经过一段时间后会形成一个条带。
三、单核苷酸多态的测定及数据格式
SNP芯 片
这样可以在芯片上打上30万—500万个探针,一次性的检测出一个个体的几十万的 SNP,为全基因组范围内变异的扫描带来方便。
(1)传统检测方法 (2)SNP芯片 (3)新一代测序技术
三、单核苷酸多态的测定及数据格式
三、单核苷酸多态的测定及数据格式
假定,某个SNP两个等位为T和A,PCR产物大小是: 427bp,Kpnl限制性内切酶识别T并将序列切断,对于含有A 的序列不切断,经过酶切后的产物是246bp+171bp两个片 段。然后片段通过琼脂糖凝胶就会产生一些条带信息,条带 信息分为3类:1个条带、2个条带和3个条带。具体表示的 分型信息如下(见下图):
群体遗传学的基本概念与原理
——单核苷酸多态与等位频率
2013
基本内容
1 遗传物质—染色体的基本概况
2
单核苷酸多态
3 单核苷酸多态的测定及数据格式
4
基因频率与基因型频率
5 全基因组范围内分析SNP应注意的问题
一、染色体的基本概况
单核苷酸多态性SNP(singlenucleotidepolymorphism)
单核苷酸多态性SNP(singlenucleotidepolymorphism)定义主要指基因组⽔平上由单个核苷酸的变异所引起的 DNA 序列多态性。
在基因组⽔平上由单个核苷酸的变异所引起的DNA。
即:在不同个体的同⼀条染⾊体或同⼀位点的核苷酸序列中,绝⼤多数核苷酸序列⼀致⽽只有⼀个碱基不同的现象。
⾸先来看看多态性(polymorphism)的英⽂解释Polymorphism*the quality or state of existing in or assuming different forms: such as: a variation in a specific DNA sequence*the condition of occuring in several different forms后者的解释是⽐较清楚的,不同形式⽽产⽣的状态。
我⾃⼰的⼀些理解是这样的,虽然⼈类的基因都是属于⼀类物种的基因,但是不全相同,这是由于在⼈类基因组上有各种各样的突变,随即由于遗传的 DNA 不同便会产⽣不⼀样的性状,如卷⾆与否、发⾊、瞳⾊、样貌等等,⼈与⼈之间的差距就在这⼩⼩的 DNA 间产⽣了,说来也挺有意思的。
⽽这些突变中之⼀便是单核苷酸的突变,⽽它也是⼈类可遗传的变异中最常见的⼀种。
SNP 在⼈类基因组中⼴泛存在,平均 500~1000 个碱基对中就有 1 个,估计总数可达300 万个甚⾄更多。
由于每个⼈的基因组因 SNP 产⽣的差异性,SNP 成为了第三代遗传标志(也可以成为个体差异的标志),⼈体许多表型差异,对药物的敏感程度及疾病发⽣的概率等可能均与 SNP 有关为何产⽣ SNP它是⼀种⼆态的标记(两种形式&两种状态),由单个碱基的变异所发⽣的条件是具有多态性,即不只⼀种条件能引起它的变异。
⼀般是由单个碱基的转换(transition)或颠换(transversion)所引起。
当然也存在碱基的插⼊或者缺失,但这两种情况极少并不做讨论。
第六章 核酸序列分析

微卫星DNA(Microsatellite DNA)又称短串联重复或简单重复序列,
微卫星筛选流程筛选
从有关数据库(GenBank, EMBL 等)或文章中查询 构建基因组 筛选SSR位点 使用近缘种的引物
获得引物
PCR扩增
(基于PCR与限制性酶切技术结合的DNA标记) ④AFLP(amplified fragments length polymorphism)标记:扩增
1:3~4)。
少一个-OH
双脱氧核苷三磷酸
互补链合成过程
如果在DNA的合成反应中,除了加入 4种正常的脱氧核
苷三磷酸(dNTP)外,再加入一种少量的2’,3’-ddNTP,那 么多核苷酸链的延伸将与偶然发生但却十分特异的链终止展 开竞争,所以反应产物是一系列的长短不一的核苷酸链。
在 4 组 独 立 的 DNA 合 成 反 应 中 , 分 别 加 入 4 种 不 同 的
段,测序获得SNP位点信息,适于调查未知SNP位点和连续分
布(1kb以内)的SNP位点信息。 • 直接测序法进行SNP分析
•
PCR-限制性酶切:如果某个SNP位点恰好是限制性酶切位点,
则通过PCR酶切再结合电泳分析不失为一种简单经济的区分方 法,适于单个的SNP位点分析。
PCR-SSCP:
单链构象多态性检测(Single-Strand Conformation Polymorphism,SSCP)是一种基于DNA构象差别来检测
二、DNA序列测定
即核酸DNA分子一级结构的测定,是现代分子生物学一项 重要的技术。 1963年,Sanger和Thompson等人第一次完成胰岛素51个 氨基酸的序列测定。70年代后期,Sanger和Maxam----Gilbert 等人又建立了核酸序列测定的方法,Sanger双脱氧末端终止法 和Maxam----Gilbert化学裂解法将核酸序列测定技术推进到 “直读”阶段,使核酸序列测定变得远比蛋白质氨基酸序列测 定容易,这样人们可以通过核酸序列和遗传密码推导出蛋白质 氨基酸的序列。
单核苷酸多态性分析技术

�
�
SNP表现形式
�
SNP既有可能在基因序列内,也有可能在基因以 外的非编码序列上。
�
cSNPs、基因周边SNPs(pSNPs)以及基因间SNPs (iSNPs)
�
)比较少, cSNP) 位于编码区内的SNP(coding SNP, cSNP 因为在外显子内,其变异率仅及周围序列的1/5。 cSNP在遗传性疾病研究中具有重要意义,因此 cSNP的研究更受关注。
� �
Taqman 法
Minisequencing
�
微测序,又称为
�
单核苷酸引物延伸( single nucleotide primer extension , SnuPE ) ,SnuPE SnuPE) 引物指导的核苷酸合成(primer guided nucleotide ) incorpration incorpration) TDI ( template directed dye terminator incorpration ) incorpration)
• UGT2B7 • VDR • PGP/MDR1 • PGP/MDR1 • RFC • MTHFR • GSTP1
RFC 80 G→A (R27H)
A/A G/A A/A G/G G/G
Allele frequencies:
A = 43.7% G = 56.3%
MALDITof MALDI-Tof
SNPs检测方法分类
每种SNPs的检测方法都可将之看成由 区分SNPs特异位点的原理方法 和 数据的检测分析手段 两部分组成。
SNPs检测方法的分类
一、区分SNPs 位点的方法 1.基于杂交的方法 2.基于酶的方法 3.以构象为基础的方法 4.直接测序的方法 二、检测分析技术 1.凝胶分析技术 2.荧光检测技术 3. DNA 芯片 4.质谱检测技术
遗传学研究中基因序列的分析方法

遗传学研究中基因序列的分析方法随着DNA测序技术的不断发展以及基因组学领域的兴起,基因序列分析已经成为生命科学研究中的重要一环。
基因序列分析为研究基因的功能和结构奠定了基础,也为了解基因在遗传疾病中的作用提供了必要的手段。
本文将介绍常见的基因序列分析方法和工具,以及它们在遗传学研究中的应用。
1. 基因注释基因注释是将分子生物学实验数据和计算机分析结果结合起来,确定基因区的位置,预测基因的结构和功能。
基因注释包括以下几个方面:1.1 基因定位基因定位是基于物理或遗传地图来确定某个基因位于哪条染色体上的一种方法。
目前最常用的基因定位方法是PCR-RFLP(PCR-Restriction Fragment Length Polymorphism)和AFLP (Amplified Fragment Length Polymorphism)。
PCR-RFLP是将多态性位点PCR扩增,再用特异的内切酶切割,根据DNA片段长度的不同,确定是否存在基因多态性。
AFLP则是采用粘性末端技术,先用不同长度的引物对DNA片段进行PCR扩增,然后将扩增产物限制性切割,再用凝胶电泳进行分离。
基因定位是基因注释的重要步骤,由此可以推算出大部分疾病的基因所在位置。
1.2 基因结构预测基因结构预测是根据基因组序列预测基因结构的一种方法。
目前,最常用的基因结构预测程序有GlimmerHMM、GeneMark、FGENESH、GENSCAN和AUGUSTUS等。
它们都是基于概率模型的软件,通过分析DNA序列的k-mer频率、AT含量等特征,确定起始密码子、终止密码子位置和剪接位点等关键信息。
1.3 基因功能预测基因功能预测是通过转录组和蛋白质组数据,预测基因在生物过程中的功能以及参与的通路。
这里我们介绍两种基因功能预测方法:GO分析和KEGG通路分析。
GO(Gene Ontology)分析是一种基于语义化的功能分析方法,可以揭示基因及其编码产物的功能、过程和位置。
实验三单核苷酸多态性的检测

单核苷酸多态性的检测原理
总结词
单核苷酸多态性的检测原理基于分子生物学技术,如DNA测序、PCR扩增和电泳分离 等技术。
详细描述
目前检测单核苷酸多态性的方法有多种,主要包括直接测序法、单链构象多态性分析、 限制性片段长度多态性分析、变性梯度凝胶电泳和基于PCR的引物延伸技术等。这些方 法均可用于检测基因组中单核苷酸的变异,为遗传学研究和医学应用提供有力支持。
关系。
04
实验结果与数据分析
实验结果展示
实验结果表格
提供了各个样本的单核苷酸多态性位点检测结果,包括基因型、 等位基因频率等数据。
实验结果图
通过条形图、饼图等形式展示了不同样本间的单核苷酸多态性分 布和比较结果。
数据解读
对实验结果表格和图进行了详细的解读,包括各个位点的基因型 分布、等位基因频率等信息。
点样与电泳
将PCR产物点样至电泳介 质上,进行电泳分离。
染色与观察
对分离后的DNA片段进行 染色,以便观察和记录结 果。
结果分析
条带识别
01
根据电泳结果,识别并记录不同样本间的差异条带。
数据分析
02
对数据进行统计分析,比较不同样本间的单核苷酸多态性分布
和频率。
结果解释
03
根据数据分析结果,解释单核苷酸多态性与相关表型或疾病的
掌握实验操作技能
通过实验操作,掌握SNP检测 的实验操作技能,包括DNA提 取、PCR扩增、电泳检测和基 因测序等。
02
实验原理
单核苷酸多态性的定义与特性
总结词
单核苷酸多态性是指基因组中单个核苷酸的变异,包括碱基的替换、插入或缺 失。
详细描述
单核苷酸多态性是基因组中常见的变异形式,通常表现为单个碱基的差异,例 如A、T、C、G之间的替换、插入或缺失。这些变异在人群中具有一定的频率, 并呈现出一定的遗传特征。
核苷酸多态性SN

sn与药物代谢和反应
药物代谢
SNP可以影响个体的药物代谢能力,从而影响药物的效果和安全性。例如,某些SNP可以影响肝脏酶的活性,从 而影响药物代谢的速度和程度。
药物反应
SNP可以影响个体对药物的反应,从而影响治疗效果和副作用的发生。例如,某些SNP可以影响个体对阿司匹林 的反应,从而影响心肌梗死和脑卒中的风险。
核苷酸多态性研究的总结
核苷酸多态性是基因组中存在 的一种重要变异形式,影响着
个体的表型和疾病易感性。
通过基因组学、生物信息学和 分子生物学等手段,我们深入 了解了核苷酸多态性的产生机
制、遗传特点和功能效应。
核苷酸多态性在人类疾病的研 究中具有重要的应用价值,为 疾病的预测、诊断和治疗提供 了新的思路和方法。
sn在生物信息学中的应用
基因组学研究
sn是基因组学研究的重要内容之一,有助于深入了解 基因组结构和功能。
进化生物学研究
sn在不同物种间的差异可以反映物种的进化历程,有 助于进化生物学的研究。
种群遗传学研究
sn在不同种群间的差异可以反映种群的遗传结构和演 化过程,有助于种群遗传学的研究。
05
总结与展望
sn与复杂性疾病
复杂性疾病
许多复杂性疾病,如糖尿病、肥胖症、精神分裂症等,是由多个基因和环境因素共同作用的结果。 SNP可以影响个体的易感性,从而影响这些复杂性疾病的发生和发展。
基因-环境相互作用
SNP可以影响个体对环境因素的响应,从而影响复杂性疾病的发生和发展。例如,某些SNP可以影响 个体对饮食、运动等环境因素的响应,进而影响体重和糖尿病的风险。
尽管取得了一些进展,但核苷 酸多态性的研究仍面临一些挑 战,如多态性位点的筛选和验 证、基因与环境互作的研究等 。
单核苷酸多态性在恶性肿瘤精准医学研究中的意义
单核苷酸多态性在恶性肿瘤精准医学研究中的意义单核苷酸多态性(Single Nucleotide Polymorphism,SNP)是指基因组中,在大量人群中出现的单个核苷酸的变异,这种变异通常不会对基因本身的功能造成影响,但可能会对基因的表达及蛋白质的结构与功能造成影响。
在恶性肿瘤精准医学研究中,SNP 作为一种非常重要的分子标记,其研究意义十分显著。
首先,SNP 作为一种常见的表型异常序列变异,在肿瘤发病和预后预测上具有重要意义。
比如,5,10-甲基四氢叶酸还原酶(MTHFR)基因的c.677C>T多态性,如果携带了CT型/TT型,与结直肠癌发生的风险明显增高;而细胞色素P450 2E1(CYP2E1)基因c.7635A>G多态性则与乳腺癌的发生风险相关。
因此,对不同癌种患者的 SNP 分析结果,可以为临床治疗提供有力支持。
其次,基于 SNP 分析的癌症风险模型可为肿瘤筛查和诊断提供新手段。
研究发现,SNP 基因多态性可以作为癌症风险评估模型的重要因素。
通过与生物体遗传信息相互作用,可以使癌症风险预测更加准确,为筛查和诊断肿瘤提供更加敏感和特异的工具。
另外,SNP 对于个体化治疗也有着重要的作用。
不同肿瘤患者对相同的化疗药物可能存在不同的耐受性和反应,这与SNPs 相关。
例如,鞘氨醇药物代谢在 CYP2C9 基因上存在SNPs 变异,CYP2D6 基因代谢也会影响纳洛酮等药的治疗效果。
因此,肿瘤患者 SNP 分型的研究不仅可以用于制定更个体化的化疗方案,还可以减少化疗相关副作用的风险等。
总之, SNP 作为一种生物标记序列变异,对于恶性肿瘤精准医学的研究非常重要。
肿瘤患者 SNP 基因分析可为个体化治疗提供重要信息,对于肿瘤的筛查、诊断和治疗等多个方面,SNP 都具有广泛的应用前景。
基于单个多态氨基酸优先级的序列保存特征提取(IJIEEB-V3-N2-1)
I.J. Information Engineering and Electronic Business, 2011, 2, 1-10Published Online March 2011 in MECS (/)Extraction of Sequence Conservation Features for the Prioritization of Candidate SingleAmino Acid PolymorphismsJiaxin WuMOE Key Laboratory of Bioinformatics and Bioinformatics Division,TNLIST/Department of Automation, Tsinghua University, Beijing 100084, ChinaEmail: wujx09@Mingxin GanSchool of Economics and ManagementUniversity of Science and Technology BeijingBeijing 100083, ChinaEmail: ganmx@Wangshu Zhang and Rui Jiang*MOE Key Laboratory of Bioinformatics and Bioinformatics Division,TNLIST/Department of Automation, Tsinghua University, Beijing 100084, ChinaEmail: ruijiang@Abstract— Although remarkable success has been achieved by genome-wide association (GWA) studies over the past few years, genetic variants discovered in GWA studies can typically account for only a small fraction of heritability of most common diseases. As such, the identification of multiple rare variants that are associated with complex diseases has been receiving more and more attentions. However, most of the recently developed statistical approaches for detecting association of rare variants with diseases require the selection of functional variants before the successive analysis, making an effective bioinformatics method for filtering out non-relevant rare variants indispensible. In this paper, we focus on a specific type of genetic variants called single amino acid polymorphisms (SAAPs). We propose to prioritize candidate SAAPs for a specific disease according to their association scores that are calculated using a guilt-by-association model with a set of features derived from protein sequences. We validate the proposed approach in a systematic way and demonstrate that the proposed model is powerful in distinguishing disease-associated SAAPs for the specific disease of interest. Index Terms— Single amino acid polymorphisms, prioritization, guilt-by-association, Euclidean distance, Manhattan distanceI.I NTRODUCTIONOver the past few years, remarkable success has been achieved by genome-wide association (GWA) studies in the discovery of genetic variants that are responsible for human inherited diseases [1], with examples including age-related macular degeneration [2], Diabetes [3], Hypertension [4], and many others [5-7]. Typically, a GWA study is designed to uncover potential associations of genetic variants with observable traits of a disease by examining whether these genetic variants occur in different frequencies between a case population and a control population. To accomplish this, it is often assumed that the etiology of common diseases is arbitrated by commonly occurring genomic variants in a population. This assumption is also known as the common disease-common variant (CD-CV) hypothesis [8, 9]. Nevertheless, recent studies have suggested that such common variants can only explain a small fraction of the heritability of most common diseases [10, 11], and that in general cases, the disease etiology is more likely to be caused collectively by multiple rare variants with moderate to high penetrance, resulting in the alternative common disease-rare variant (CD-VR) hypothesis for GWA studies [12, 13].Rare variants are different from common variants in many properties, such as the low marginal population attributable risk and the wide range of penetrance. It is therefore quite difficult to uncover genetic effects of rare variants using existing experimental techniques and computational approaches that are developed for common variants. However, with the accelerating advancement of the next generation sequencing technology, it becomes more and more feasible to directly sequence candidate genetic regions or even the whole genome to obtain a huge number of rare variants. Moreover, in order to deal2Extraction of Sequence Conservation Features for the Prioritization of CandidateSingle Amino Acid Polymorphismsthe association of multiple rare variants with the disease under investigation. These methods include the combined multivariate and collapsing method [8], the cohort allelic sums test approach [14], the weighted-sum statistical analysis [13], and many others [15-17]. Most of these methods use the grouping approach to cluster variants under investigation according to their functions. Though being effective, this approach requires correct classification of functional mutations and is quite sensitive to neutral or un-functional variants. On this scenario, bioinformatics tools or filters are expected to make functional predictions of the rare variants under investigation and accordingly decide which of them should be included in the successive statistical analysis. As a typical type of genetic variants, nonsynonymous single nucleotide polymorphisms (nsSNPs) that occur in single bases of protein coding sequences lead to single amino acid polymorphisms (SAAPs) in protein sequences. These SAAPs potentially alter structures of proteins, affect functions of proteins, and further cause human diseases [18]. In order to predict potential effects of such SAAPs, bioinformatics methods, such as SIFT [19], PolyPhen [18], KBAC [20], and MSRV [21] have been proposed. These methods typically classify SAAPs that are potentially associated with some diseases against neutral ones that are not associated with any disease from the perspective of binary classification. However, all these methods with such a formulation can only assign a generic “disease” category or a “non-disease” category to SAAPs, and can not specify the disease with which the SAAP may be associated. As such, the classification results of these methods can only provide limited information to practical applications.To overcome this limitation, in this paper, we formulate the identification of SAAPs that may be associated with a specific disease from a set of candidate SAAPs as a one-class novelty learning problem. More specifically, we define an association score to quantify the strength of association between a query disease and a candidate SAAP, and then we prioritize candidate SAAPs among according to their association scores. We design the scoring method according to the guilty-by-association principle [22], on the basis of the assumption that the disease under investigation is known to be associated with a set of seed SAAPs, who share similar properties. Following this assumption, a candidate SAAP may be the suspicious disease-associated SAAP for the query disease if it bears homogeneous properties with the seed SAAPs of the disease. We derive four features for SAAPs from multiple sequence alignment of protein sequences in which the SAAPs occur, and we use two popular distance measures (the Euclidean distance and the Manhattan distance) to calculate the dissimilarity between two SAAPs in the feature space. We demonstrate the effectiveness and predictive power of our approach via comprehensive large-scale leave-one-out cross-validation experiments. Results show that our approach is effective in identifying relationships between SAAPs and diseases, with the Manhattan distance achieving the most preciseII.M ATERIALS AND M ETHODSA. Data SourcesWe carry out the proposed studies by taking advantage of two widely used databases in proteomics: the Swiss-Prot database [23] and the Pfam database [24].The Swiss-Prot database [23] provides detailed annotations of known SAAPs. In version 2010_10 (released on October 5, 2010) of this database, a total of 62,430 SAAPs occurring in 12,401 human proteins are collected. Each SAAP is annotated as “Disease,” “Polymorphism,” or “Unclassified.” In this paper, we refer to SAAPs with “Disease” annotations as disease SAAPs and those with “Polymorphism” annotations as neutral SAAPs. For disease SAAPs, the names and the OMIM accession numbers of the diseases to which the SAAPs are associated are further provided.The Pfam [24] database collects curated and predicted protein families and domain annotations. This database is further split into a Pfam-A part that includes curated protein families and a Pfam-B part that includes predicted protein families. In version 24.0 (released in October 2009) of this database, there are a total of 11,912 protein families included in the Pfam-A part.In our studies, we focus on SAAPs that occur in protein domains, for the purpose of utilizing information of protein families to obtain multiple sequence alignment of protein sequences. By combining the annotations of SAAPs in the Swiss-Prot database and domain annotations in the Pfam database, we finally collect 13,735 neutral SAAPs and 14,511 disease SAAPs that are associated with 1,575 diseases.B. Sequence Conservation FeaturesWe derive four sequence conservation features from protein multiple sequence alignment. Given a SAAP occurring in a protein, we extract its homologous proteins form the Pfam database to obtain the multiple sequence alignment. We then look at the column of the alignment that corresponds to the position at which the polymorphism occurs, and we calculate the conservation score of the original amino acid (Feature 1) as the relative frequency of occurrence of the original amino acid. Similarly, we calculate the conservation score of the substituted amino acid (Feature 2) as the relative frequency of occurrence of the substituted amino acid [21, 25, 26].The above two conservation scores do not take the background, i.e., frequencies of occurrence of amino acids in all human protein, into consideration. However, it is known that different types of amino acids do occur at different frequencies in known human proteins. For example, if we count the frequencies of occurrence of all twenty types of amino acids in human proteins that are collected in the Swiss-Prot database, we can obtain the following Table I, which shows that the twenty types of amino acids do, indeed, occur at quite different frequencies. Considering this fact, we further propose theTABLE I.F REQUENCY OF 20 TYPES OF AMINO ACIDS IN HUMAN PROTEINS Amino acidFrequency (%)Amino acidFrequency (%)A 8.28 M 2.43 C 1.36 N 4.06 D 5.46 P 4.69 E 6.77 Q 3.94 F 3.86 R 5.54 G 7.10 S 6.52 H 2.27 T 5.33 I 5.99 V 6.88 K 5.85 W 1.08 L9.67Y2.92First, we obtain the conservation ratio of the original amino acid in a SAAP (Feature 3) by dividing the relative frequency of occurrence of the original amino acid by the relative frequency of occurrence of the same type of amino acid in the background. Second, we obtain the conservation ratio of the substituted amino acid (Feature 4) by dividing the relative frequency of occurrence of the substituted amino acid by the relative frequency of occurrence of the same type of amino acid in the background. C. Guilt-by-association ModelGiven a query disease of interest, a set of seed SAAPs that are known to be associated with the query disease, and a set of candidate SAAPs whose associations with the disease need to be inferred, we adopt a guilt-by-association model [22] to prioritize the candidate SAAPs according to their strength of associations with the query disease of interest. The basic assumption of this model is that SAAPs that are associated with the same disease should have similar conservation properties. Therefore, we can calculate for each candidate SAAP an association score by considering the similarity of the candidate SAAP with each of the seed SAAPs and then summarize all similarities to obtain a score that indicates the strength of association of the candidate SAAP to the query disease. For a single sequence conservation feature, we can evaluate the dissimilarity between two SAAP using the absolute value of the difference in their features, i.e.,()x y d x y ff =−,.Then, for a set of single sequence conservation features as a feature vector, we can obtain the dissimilarity between two SAAPs using some function to calculate distance between their feature vectors.The first distance function we propose to use is the Euclidean distance , which is considered as the most traditional and ordinary way to compare two points in the feature space. The mathematical formulation of the Euclidean distance between two SAAPs with feature ()d =x,y The second distance function is the Manhattan distance , which is also known as the rectilinear distance, L 1 distance, city block distance, or taxicab distance. The Manhattan distance is the sum of the lengths of the projections of the line segment between the points onto the coordinate axes [27]. The mathematical formulation of the Euclidean distance between two SAAPs with feature vectors x and y is denoted as follow:1()i i ni d x y ==−∑x,y .According to the literature [27], the advantage of the Manhattan over the Euclidean distance is that it weighs slight differences more heavily.Then, for the query disease D that has a set of seed SAAPs associated, the dissimilarity between a candidate SAAP with feature vector x and the query disease can be obtained as()()()D D S Z d ′∈=′∑x x x,xwhere S D is the collection of all seed SAAPs for the query disease D .With the dissimilarity between each of the candidate SAAPs and the query disease being calculated, we can further rank the candidate SAAPs according to their dissimilarity scores to obtain a rank list. Alternatively, we can define the reciprocal of the dissimilarity between a candidate SAAP and the query disease as an association score that indicates the strength of association between the SAAP and the disease, and then prioritize the candidate SAAPs according to their association scores.D. Validation Methods and Evaluation CriteriaWe adopt a series of large-scale leave-one-out cross-validation experiments to assess the validity of the proposed approach in recovering known associations between diseases and SAAPs. Specifically, in each validation run, we select an association between a disease and a seed SAAP that is known to be associated with the disease, assume that the association relationship is unknown, and then prioritize the SAAP against a set of control SAAPs based on their association scores. According to the polymorphism SAAPs derived from the Swiss-Prot database, we choose the following four control groups:(1) 99 randomly selected polymorphism SAAPs; (2) 999 randomly selected polymorphism SAAPs; (3) 9999 randomly selected polymorphism SAAPs; (4) All 13,735 polymorphism SAAPs.For every seed SAAP of every disease, we perform such validation run, and accordingly, we can obtain a series of ranking lists.To soundly evaluate the performance of the proposed prioritization method, we calculate two criteria with theseof seed SAAPs (MRR), which is the average rank ratio of all seed SAAPs. The second criterion is termed AUC score (the area under the receiver operating characteristic (ROC) curve), which is obtained as follows. At a certain rank threshold, we define the sensitivity as the proportion of seed SAAPs ranked above the threshold, and the specificity as the fraction of control SAAPs ranked below the threshold. By varying the threshold, we are able to obtain a series of sensitivities and specificities, and further plot a ROC curve. The area under this curve is then defined as the AUC score.The above two criteria can be used to evaluate the proposed method in recovering known associations for a single query disease. In this case, we focus on the series of ranking lists obtained using seed SAAPs for the query disease. These criteria can also be used to evaluate the proposed method in recovering known associations for all diseases. In this situation, we focus on the series of ranking lists obtained for all seed SAAPs.As seed SAAPs that are associated with the same disease should be more similar than polymorphism SAAPs in the control group, it is expected that all the seed SAAPs should rank at the top. Therefore, we expect low mean rank ratios and high AUC scores for a good prioritization method.Ⅲ.R ESULTSA. Validation of the ModelWe focus on diseases that have at least 4 seed SAAPs in the Swiss-Prot annotations, and we obtain a total of 13,138 associations between 723 diseases and 13,138 SAAPs. We then perform for each of these associations aleave-one-out cross-validation experiment against each of the four control groups, using either the Euclidian distance or the Manhattan distance measure. We further evaluate the performance of the proposed method for each of the 723 diseases, in terms of the mean rank ratio of seed SAAPs and the AUC score, and we summarize the results in Figures 1 and 2, respectively. In each figure, we further present six situations:(1)Feature 1: using the conservation score of theoriginal amino acid;(2)Feature 2: using the conservation score of thesubstituted amino acid;(3)Features 1 and 2: using a vector that is composedof the two conservation scores;(4)Feature 3: using the conservation ratio of theoriginal amino acid to the background situation; (5)Feature 4: using the conservation ratio of thesubstituted amino acid to the background situation;(6)Features 3 and 4: using a vector composed of thetwo conservation ratios.From these figures, we can see that for a large proportion of diseases, the seed SAAPs can be ranked at top 50% among the control groups. In other words, we can recover relationships between a large number of known SAAPs and their associated diseases. Taking Figure 1 (H) as an example, we calculate that for 662 (91.56%) diseases, the mean rank ratios are less than 50%; for 236 (32.64%) diseases, the mean rank ratios are less than 20%; for 78 (10.79%) diseases, the mean rank ratios are less than 10%. We further run Wilcoxon signed rank tests against the alternative hypothesis that the median of the mean rank ratios is less than 50% (random situation), and we find that no matter which features are used, the p-value is less than 2.2×10⁻¹⁶. In other words, it isTABLE II.C OMPARISON RESULTS BETWEEN THE TWO SIMILARITY MEASURES Feature Method Mean MRRs (%) Standard Derivation MRRs (%) p -value Euclidean 37.37 3.52 1 Manhattan 36.96 4.07 0.3629 Euclidean 37.12 2.88 2 Manhattan 28.31 2.25 <2.2×10⁻¹⁶ Euclidean 34.78 3.10 1&2 Manhattan 31.18 2.96 <2.2×10⁻¹⁶ Euclidean 38.26 2.78 3 Manhattan 40.15 3.24 0.9890 Euclidean 38.61 3.03 4 Manhattan 29.31 2.42 <2.2×10⁻¹⁶ Euclidean 36.21 2.52 prioritize seed SAAPs among the top of candidate SAAPs. B. Comparison between Control GroupsWe then study the influence of the number of polymorphism SAAPs in the control group, for the purpose of understanding whether the proposed method is robust to the selection of the control set. To accomplish this, we fix the conservation feature (i.e. Feature 2) and the distance measure (i.e. the Manhattan distance), repeat the leave-one-out cross-validation experiment on each of the four control groups. We then run three Wilcoxon rank sum tests against the alternative hypothesis that mean rank ratios obtained using control group 4 (all polymorphism SAAPs) have a location shift over those using other control groups. We obtain three p -values, 0.5627 for group 1, 0.9689 for group 2, and 0.9946 for group 3, which testify that little difference is made between these ranking lists calculated under different control groups. To make the results more visually, we draw three QQ-plots to compare these control groups, shown in Figure 3. It is not surprising to obtain such results, because control groups 1 to 3 are just random samples from control group 4. We therefore conclude that the random sampling procedure in generating control groups does not bring bias into the evaluation of the prioritization method.C. Comparison between Similarity MeasuresComplying with the guilt-by-association model, we measure the similarity between two SAAPs in the feature space using two distance functions: the Euclidean distance and the Manhattan distance. Obviously, we want to find out the more precise measure for our prediction model. To accomplish this, we calculate the mean and standard deviation of the mean rank ratio using for each of the features, using either the Euclidean distance or the Manhattan distance, and we present the results in Table II. From this table, we can observe that the mean values of the mean rank ratios given by the Manhattan distance tend to be smaller in the leave-one-out cross-validation Euclidean distance. To further elucidate this observation, we run six Wilcoxon rank sum tests against the alternative hypothesis that mean rank ratios obtained using the Euclidean distance have a positive location shift over those using the Manhattan distance for the six situations mentioned above, and the results are also summarized in Table II. It is therefore clearly to see that the Manhattan distance measure is more suitable in measuring the similarity between two SAAPs, especially for features 2 and 4. D. Comparison between Conservation FeaturesFrom Figure 1 and Table II, we may conclude that mean rank ratios under the Manhattan distance seem to be smaller in the leave-one-out cross-validation when Feature 2 is used. We can also see that the performance of our model with the two conservation scores are better than the performance of our model with the corresponding conservation ratios, which indicates that considering the background frequencies of amino acids may decrease the discriminative power for uncovering the potential relationship between disease SAAPs and the relevant disease. To further testify these observations, wefirst run 5 Wilcoxon rank sum tests against the alternative hypothesis that mean rank ratios obtained using Feature 2 and the Manhattan distance have a negative location shift over those using other features and the Manhattan distance, and we obtain three p -values smaller than 2.2×10⁻¹⁶ for Feature 1, Feature 3, and Features 3 & 4; two p -values smaller than 2.83×10⁻⁷ for Feature 4 and Features 1 & 2. That is to say, Feature 2 is more capable of recognizing the disease SAAPs than other features in this prioritization problem. Similarly, we run three other Wilcoxon rank sum tests against the alternative hypothesis that mean rank ratios obtained using conservation scores and the Manhattan distance have a negative location shift over those using the corresponding conservation ratios and the Manhattan distance, and we can also receive three small p -values (9.28×10⁻¹⁵, 2.83×10⁻⁷, and 2.2×10⁻¹⁶) to verify our second assumption. These results are consistent with the analysis of relative importance of the features in the literature [25], which points out that the conservation score for the substituted amino acid has the most powerful discriminative ability to identify the disease-associated SAAPs against the neutral ones. E. Effect of Number of SeedsFor every specific disease, a prioritization model is trained using the conservation scores drawn from known seed SAAPs. When applying the proposed guilt-by-association model to predict new candidate SAAPs, wemore stable and we can use the conservation scores to precisely describe the disease. In other words, the model will achieve relative better prediction performance when the number of seed SAAPs is large enough to collect comprehensive and accurate information about the conservativity of the disease, while the model will give relative poor prediction results when the number of seed SAAPs is too small to capture the essence of the conservativity of corresponding disease. To validate our postulation, we run our model on four control datasets with three feature sets (Feature 1, Feature 2, and Features 1 & 2) separately:1) Dataset 1 includes 177 diseases, and the number of seed SAAPs ranges from 20 to 260;2) Dataset 2 includes 182 diseases, and the number of seed SAAPs ranges from 10 to 19;3) Dataset 3 includes 168 diseases, and the number of seed SAAPs ranges from 6 to 9;4) Dataset 4 includes 196 diseases, and the number of seed SAAPs ranges from 4 to 5.The comparison results are given in Figure 4, from which we can see that the histogram results show different mean rank ratios distributions according to the change of the dataset and feature. By calculating the mean value and standard deviation of mean rank ratios for every dataset under a certain feature set, we find little difference for the mean value of mean rank ratios under different datasets, however, the standard deviation of mean rank ratios is enlarging quickly along with reducedamount of known seed SAAPs. On that scenario, we can conclude that our approach becomes more sensitive to the stability of the conservativity of the disease when there are little available seed SAAPs. If the disease possesses strong conservative character and can be accurately pictured by only a few seed SAAPs, the approach may perform outstandingly to measure the casual relationship between new candidate SAAP and the disease; on the contrary, if the disease does not have a stable conservative character, it is quite difficult to use conservation scores extracted from few seed SAAPs to construct a well-performed prediction model. In a word, the model may have better prediction results when there are enough seed SAAPs (more than 5 seed SAAPs) to capture the characters of the diseases. F. Case studiesMaking use of guilt-by-association model to formulate the problem of prioritizing candidate SAAPs, we aim at finding disease-related SAAPs for the query disease, and accordingly promoting the detection of potential functional rare variants in successive association studies. We apply the proposed method with Feature 1and 2 and the Manhattan distance measure for some specific diseases, such as Familial hypercholesterolemia (FH) [MIM: 143890], we obtain the overall MRR=14.16% and AUC=85.85% (shown in Table Ⅲ). According to the ranking results, we can thus get the top five significant disease-associated SAAPs, which are D579Y, P608S, D221Y, D224V, and D221G. All of these SAAPs belong to gene LDLR and rank top 140 among 13736 SAAPs (less than 1.00%). These results are just in accordance with some previously published research works [28-30], density lipoprotein receptor (LDLR ) activity, mainly due to LDLR gene defects.We also study some common complex diseases, such as breast cancer (BC) [MIM: 114480]. It was found in the middle of 1990s that genetic variants occurring in BRCA1 or BRCA2 may significantly raise the odds of developing breast cancer [31]. In our study, the top 5 variants that are predicted to be associated with breast cancer are T826K in gene BRCA1, T2515I in gene BRCA2, S2072C in gene BRCA2, H888Y in gene BRCA1, and G960D in gene BRCA1, and they all rank top 1000 among 13736 SAAPs (smaller than 6.74%).Ⅳ. C O N C L U S I O N SIn this paper, we model the problem of distinguishingdisease-associated SAAPs against neutral ones for specific types of diseases as a prioritization problem, and we solve this problem using a guilt-by-association model. We implement our method using two distance measures with four control groups on the basis of four conservative features drawn only from multiple sequence alignments. We demonstrate that the method is effective in ranking SAAPs that are responsible for specific diseases among the top of candidates. We also analyze the effects of different number of control samples, different distance measures, different features, and different number of seed SAAPs known to be associated with the query diseases. Certainly, there are several limitations of the proposed approach. First, we use the Pfam multiple sequence alignments to extract conserved protein domains for the query protein sequence. As a result, we are limited to the mutations occurring in known protein domains. This limitation can be overcome by using some other multiple-sequence alignment methods, such as BLAST [32], PSI-TABLE Ⅲ.P REDICTION PERFORMANCES FOR DISEASE ( MIM:143890) Condition99 Polymorphism nsSNPs (%) 999 Polymorphism nsSNPs (%) 9999 PolymorphismnsSNPs (%)All Polymorphism nsSNPs (%)Feature 119.51 ± 2.72 19.15 ± 0.86 19.30 ± 0.10 19.26 Feature 2 45.85 ± 4.71 44.84 ± 1.13 44.82 ± 0.03 44.81 EuclideanFeatures 1and 2 17.52 ± 2.54 18.99 ± 0.86 18.75 ± 0.09 18.71 Feature 1 13.88 ± 1.76 14.85 ± 0.68 14.79 ± 0.09 14.70 Feature 2 20.42 ± 2.01 19.37 ± 0.77 19.46 ± 0.10 19.55 Mean Rank RatioManhattanFeatures 1and 213.50 ± 1.29 14.06 ± 0.46 14.19 ± 0.06 14.16 Feature 181.04 ± 2.77 80.90 ± 0.86 80.70 ± 0.10 80.73 Feature 2 54.09 ± 4.80 55.15 ± 1.13 55.17 ± 0.03 55.19 EuclideanFeatures 1and 2 83.11 ± 2.58 81.07 ± 0.86 81.25 ± 0.09 81.29 Feature 1 86.78 ± 1.74 85.21 ± 0.68 85.21 ± 0.09 85.22 Feature 2 80.03 ± 2.03 80.67 ± 0.78 80.54 ± 0.10 80.45 AUC scoreManhattanFeatures 1and 287.15 ± 1.2786.01± 0.4585.81 ± 0.0685.85。
单核苷酸多态性在作物遗传育种中的研究_邹枚伶
传统低通量 SNP 分型方法主要有 2 种: 限制性内切酶 酶切和传统的测序技术。其中,测序法可以直接应用,如 Sanger 法测序[9]。而限制性内切酶酶切法是由酶切位点 扩增 多 态 序 列 ( cleaved amplified polymorphic sequence, CAPS) 或由 CAPS 法衍生的 dCAPS 法( derived cleaved amplified polymorphic sequence,dCAPS) 。 [10 - 11]
基金项目: 国家自然科学基金面上项目: 木薯 SNP 遗传图谱构建与抗寒性 QTL 精细定位( 31171230) 。 作者简介: 邹枚伶( 1983 - ) ,女,研究实习员,研究方向: 能源作物基因组学与分子育种。* 通讯作者
收稿日期: 2012 - 11 - 21
30
考虑核心群体的确定。可以参考 RFLP、AFLP、SSR、ISSR 和 SRAP 标记 的 资 料 来 选 择 有 代 表 性 的 个 体 构 成 核 心 群体。 1. 3. 2 核心群体的目标表型性状鉴定 SNP 研究的一个 关键问题就是精确的鉴定目标表型性状,在多基因控制高 等植物中,精确数量性状的鉴定尤为重要。 1. 3. 3 高等植物目的性状相关 SNP 的分型 SNP 分型技 术发展很快,对于高等植物 SNP 研究的方法主要有 PCR 方法、测序技术及基因芯片检测等。
一种基于计算机的单核苷酸多态性位点检测方法

一种基于计算机的单核苷酸多态性位点检测方法马磊;贾奇男;张俊;易青青;贺建峰;张琪【摘要】目的探讨一种成本低廉、操作简便,并能在大量基因数据中筛选出单核苷酸多态性(SNP)位点的计算机方法.方法通过提取特征属性值项,采用基于最优风险与预防模式的数学算法,从SNP位点的角度分析基因突变现象.并以HBV(乙肝病毒)的演化为例,应用所提出的方法研究急性乙型肝炎转化为慢性乙型肝炎再至肝硬化过程中病毒基因的突变现象.结果实验共检测出18处急性转慢性候选SNPs位点,其中4处属于碱基替换突变,1处属于碱基缺失突变,该5处已有报道,另外13处是新发现的候选SNP位点.同时检测出3处新发现的慢性转肝硬化候选SNPs位点,其中2处属于碱基替换突变,l处属于碱基缺失突变.结论该方法操作简便,所需软硬件设备容易配置,在检测的便捷性和检出率方面都具有一定优势,将对乙型肝炎及其他疾病的临床诊断和研究起到有益的参考作用.【期刊名称】《基础医学与临床》【年(卷),期】2014(034)002【总页数】6页(P229-234)【关键词】最优风险与预防模型;SNP位点;乙型肝炎病毒【作者】马磊;贾奇男;张俊;易青青;贺建峰;张琪【作者单位】昆明理工大学信息工程与自动化学院生物医学工程研究所,云南昆明650500;昆明理工大学信息工程与自动化学院生物医学工程研究所,云南昆明650500;昆明理工大学信息工程与自动化学院生物医学工程研究所,云南昆明650500;昆明理工大学信息工程与自动化学院生物医学工程研究所,云南昆明650500;昆明理工大学信息工程与自动化学院生物医学工程研究所,云南昆明650500;昆明理工大学信息工程与自动化学院生物医学工程研究所,云南昆明650500【正文语种】中文【中图分类】R318.04单核苷酸多态性(single nucleotide polymorphism,SNP)是指在染色体基因组水平上单个核苷酸的变异引起DNA序列多态性,它包括单碱基的转换,颠换、插入及缺失等形式,SNP位点的检出可以在一定程度上预测个体在自然选择过程中的演变程度。
人类基因组中单核苷酸多态性的检测技术

人类基因组中单核苷酸多态性的检测技术
黄耀江;李雪;董明盛;刘越
【期刊名称】《生物学通报》
【年(卷),期】2007(42)6
【摘要】随着人类基因组测序工作的完成,单核苷酸多态性作为继限制性片段长度多态性和微卫星多态性这2种遗传标记之后的第3代遗传标记,已成为人类后基因组时代的主要研究内容之一.系统地介绍了人类基因组中单核苷酸多态性的传统检测方法、新的方法以及基于生物信息学的方法,并对SNP检测技术的发展进行了展望.
【总页数】3页(P1-3)
【作者】黄耀江;李雪;董明盛;刘越
【作者单位】中央民族大学生命与环境科学学院,北京,100081;南京农业大学食品科学与技术学院,江苏,南京,210095;中国民族地区环境资源保护研究所,北
京,100081;中央民族大学生命与环境科学学院,北京,100081;南京农业大学食品科学与技术学院,江苏,南京,210095;南京农业大学食品科学与技术学院,江苏,南京,210095;中央民族大学生命与环境科学学院,北京,100081
【正文语种】中文
【中图分类】Q5
【相关文献】
1.单核苷酸多态性检测技术在法医学中的应用进展 [J], 李中红;刘秋英
2.单核苷酸多态性在人类基因组学发展中的应用 [J], 蒋刈;戴朴;韩东一
3.变性高效液相色谱分析法在人类基因组单核苷酸多态性检测中的应用 [J], 韩伟;楼定华;王竞;Sheaping Yip;Maurice Yap
4.人类基因组中单核苷酸多态性(SNPs)的研究与应用 [J], 张羽
5.胎儿染色体核型分析联合单核苷酸多态性芯片\r检测技术在产前诊断中的应用[J], 史向荣;詹福寿;万艳;张慧萍;马威;芮淑贤;姜怡邓
因版权原因,仅展示原文概要,查看原文内容请购买。
《科学》发表第一份不同人群的SNP图谱
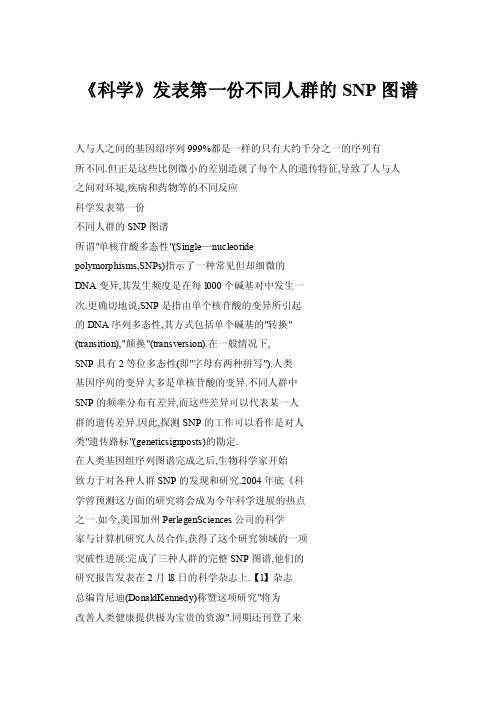
《科学》发表第一份不同人群的SNP图谱人与人之间的基因绍序列999%都是一样的只有大约千分之一的序列有所不同.但正是这些比例微小的差别造就了每个人的遗传特征,导致了人与人之间对环境,疾病和药物等的不同反应科学发表第一份不同人群的SNP图谱所谓"单核苷酸多态性"(Single—nucleotidepolymorphisms,SNPs)指示了一种常见但却细微的DNA变异,其发生频度是在每l000个碱基对中发生一次.更确切地说,SNP是指由单个核苷酸的变异所引起的DNA序列多态性,其方式包括单个碱基的"转换"(transition),"颠换"(transversion).在一般情况下,SNP具有2等位多态性(即"字母有两种拼写").人类基因序列的变异大多是单核苷酸的变异.不同人群中SNP的频率分布有差异,而这些差异可以代表某一人群的遗传差异.因此,探测SNP的工作可以看作是对人类"遗传路标"(geneticsignposts)的勘定.在人类基因组序列图谱完成之后,生物科学家开始致力于对各种人群SNP的发现和研究.2004年底《科学曾预测这方面的研究将会成为今年科学进展的热点之一.如今,美国加州PerlegenSciences公司的科学家与计算机研究人员合作,获得了这个研究领域的一项突破性进展:完成了三种人群的完整SNP图谱,他们的研究报告发表在2月l8日的科学杂志上.【l】杂志总编肯尼迪(DonaldKennedy)称赞这项研究"将为改善人类健康提供极为宝贵的资源".同期还刊登了来家族与人群的道侍图群.左困:家族中的基因共同侍逆是获得人类疾赫道侍困聋的重要方法.第一代的某个基因突变(蓝色的Al1可以通过隶缘关覃道侍纠第三代的某些家族成员.采用SNP等方式可以标定每个个体的道侍记号,而计算机程序可以算士这种家族的基因侍逆模式与某种特定疾茄之闭的一致性概率.右困:"连舒不平衡"困考的对闭_足度要长拜多,不是几代,而是千万年.在这个基因考承的示意图中,所端代表祖先的一个染色体,而庶审的甜牧末端表示今天人群中个体的染色体.如栗某个特定疾病与一个sNP记号之问在整个人群中显示出统计相关(连锁不平衡), 就可以推铡两者之问的关联图中的数字表示产生sNP差异的基因突变所有的后裔都携带7"突变,",而"突变2"f蓝色j导致7一种孟德尔类型道侍疾茄.图谱来源:《科学》307卷5712期圃史季忠自哈佛与康乃尔大学的两位教授合写的一篇评论文章,阐释了这项研究的意义.[21评论文章指出,人类遗传学研究的一个中心目标是辨别和理解基因的多种变异形式与疾病风险之间的因果关系.迄今为止,对单一基因突变所决定的遗传疾病(即孟德尔类型疾病)的研究已经获得许多进展.但人类通常的疾病并不是由单一基因突变所致,而是多种遗传风险因素与环境和行为因素互相作用的结果.在通常的复杂疾病中,基因突变的影响不是决定性的而是慨然性的,任何一个特定的突变所发生的影响效应要比在孟德尔类型的疾病中小.因此,要在复杂疾病中判断遗传突变产生的效应,就必须对照大量的病人与普通人群之间在DNA变异方面的频度差别.于是,我们首先需要勘定普通人群的遗传变异模式,而SNP的筛选及检测是一个重要方法.这次发表的DavidA.Hinds等人的研究首次绘制出三种人群的密集SNP图谱.其DNA样本由7l位欧洲裔,非洲裔和汉族华裔美国人志愿捐献,勘测了近l60万个单核苷酸.绘制图谱的基本原理基于两项观察.首先,大多数"异型结合"(heterozygosity)是由于有限多个普通变异的结合.其次,两个位置邻近的基因同时遗传变异的可能性更大(这被称为"连锁不平衡"[1inkagedisequilibrium】).研究发现,在所有71人构成的单核苷酸多态性中,有94%的多态性发生在非洲人群体里,有81%在欧洲人群体里,中国人里存在74%的SNP变异.通过比较多态性的分布,建立表型和连锁不平衡区域的联系,这个图谱有助于解释人类不同群体和不同个体间的表型差异以及对疾病的易感性.这对心血管疾病,精神疾病以及其它多基因控制的疾病的研究具有重大意义.■【1】DavidAHinds,eta1.,Science,V ol307,1072(18February2005)【21DavidAltshulerandAndrewG.Clark,Science307,1052(18February2005) sc-c.c".LO.v-c"-...s?l《2I_一。
DNA物理图谱
DNA的一级结构DNA物理图谱一级结构的概念:DNA的一级结构是指DNA分子中核苷酸的排列顺序,DNA顺序(或序列)是这一概念的简称。
由于核苷酸之间的差异仅仅是碱基的不同,故可称为碱基顺序。
DNA是巨大的生物高分子,如人的DNA就包含了3x10⁹碱基对,如此数目的碱基所能容纳的信息量之大是可想而知的。
生物世界里形形色色的遗传信息都包含在组成DNA的A,G,C,T这四种核苷酸的排列顺序之中。
DNA分子中不同排列顺序的DNA区段构成特定的功能单位,这就是基因,不同基因的功能各异,各自分布在DNA的一定区域。
基因的功能取决于DNA的一级结构,要想解释基因的生物学含义,就必须弄清DNA顺序。
因此,DNA顺序测定是分子遗传学中一项既重要又基本的课题。
DNA物理图谱:DNA物理图谱是指DNA链的限制性酶切片段的排列顺序,即酶切片段在DNA链上的定位。
因限制性内切酶在DNA链上的切口是以特异序列为基础的,核苷酸序列不同的DNA,经酶切后就会产生不同长度的DNA片段,由此而构成独特的酶切图谱。
因此,DNA物理图谱是DNA分子结构的特征之一。
DNA是很大的分子,由限制酶产生的用于测序反应的DNA片段只是其中的极小部分,这些片段在DNA链中所处的位置关系是应该首先解决的问题,故DNA物理图谱是顺序测定的基础,也可理解为指导DNA测序的蓝图。
广义地说,DNA测序从物理图谱制作开始,它是测序工作的第一步。
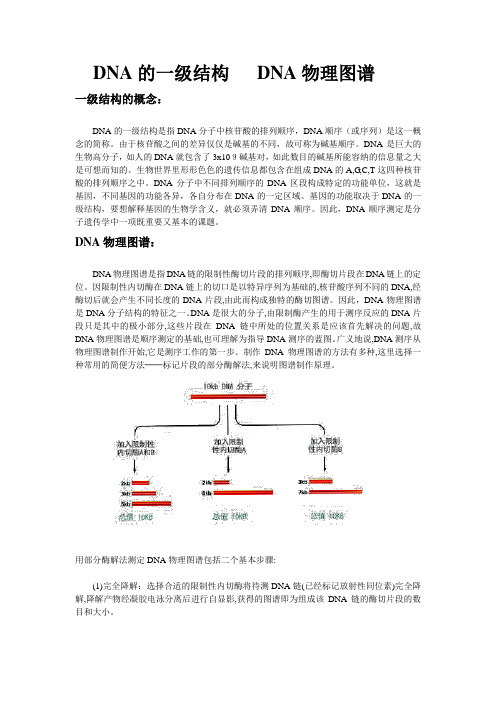
制作DNA物理图谱的方法有多种,这里选择一种常用的简便方法──标记片段的部分酶解法,来说明图谱制作原理。
用部分酶解法测定DNA物理图谱包括二个基本步骤:(1)完全降解:选择合适的限制性内切酶将待测DNA链(已经标记放射性同位素)完全降解,降解产物经凝胶电泳分离后进行自显影,获得的图谱即为组成该DNA链的酶切片段的数目和大小。
(2)部分降解:以末端标记使待测DNA的一条链带上示踪同位素,然后用上述相同酶部分降解该DNA链,即通过控制反应条件使DNA链上该酶的切口随机断裂,而避免所有切口断裂的完全降解发生。
- 1、下载文档前请自行甄别文档内容的完整性,平台不提供额外的编辑、内容补充、找答案等附加服务。
- 2、"仅部分预览"的文档,不可在线预览部分如存在完整性等问题,可反馈申请退款(可完整预览的文档不适用该条件!)。
- 3、如文档侵犯您的权益,请联系客服反馈,我们会尽快为您处理(人工客服工作时间:9:00-18:30)。
Published Online October 2011 in MECS () DOI: 10.5815/ijem.2011.05.09 Available online at /ijem
Hale Waihona Puke Abstract The Detection of rare variants responsible for human complex diseases has been receiving more and more attentions. However, most existing computational methods for this purpose require the selection of functional variants before statistical analysis. Based on the assumption that nonsynonymous single nucleotide polymorphisms (nsSNPs) associated with specific diseases should be similar in their properties, we propose a method that utilize conservation scores of nsSNPs and the guilt-by-association principle to prioritize the candi-date nsSNPs for specific diseases. Systematic validation demonstrates that our approach is effective in recovering the relationship between nsSNPs and diseases, with the Manhattan distance measure achieving the most precise prediction results. Index Terms: Prioritization, Nonsynonymous Single Nucleotide Polymorphisms (Nssnps), Guilt-ByAssociation, Euclidean Distance, Manhattan Distance © 2011 Published by MECS Publisher. Selection and/or peer review under responsibility of the Research Association of Modern Education and Computer Science. 1. Introduction Identification of genetic variants that are responsible for human inherited diseases has achieved remarkable success, represented by the fruits of genome-wide association (GWA) studies, in which hundreds of common variants in diverse complex traits have been reported [1]. One critical assumption held by the GWA studies is the common disease common variant (CDCV) hypothesis, which asserts that common diseases are caused by common variants with small to modest effects [2]. However, recent studies suggest an alternative hypothesis of common disease rare variant (CDVR), stating that the disease etiology is caused collectively by multiple rare variants with moderate to high penetrances, and the effective way to identify these rare variants is through direct sequencing [2,3]. Even so, due to the unaffordable cost of whole-genome sequencing, we should first quantify which variants are potentially functional or neutral, before statistical analysis of the sequence data. The results obtained from bioinformatics tools can be used to determine which variants should be included in the analysis. It has been pointed out that in an ideal situation, all variants that are included in the analysis are functional and no functional variants are excluded [2].
Prioritization of Candidate Nonsynonymous Single Nucleotide Polymorphisms via Sequence Conservation Features
Jiaxin WUa, Wangshu ZHANGa, Rui JIANGa,*
a
MOE Key Laboratory of Bioinformatics and Bioinformatics Division, TNLIST/Department of Automation, Tsinghua University, Beijing 100084, China
* Corresponding author: E-mail address: ruijiang@
Prioritization of Candidate Nonsynonymous Single Nucleotide Polymorphisms via Sequence Conservation Features
67
Out of this consideration, we resort to existing functional databases about single nucleotide polymorphisms (SNPs), the most frequent type of human DNA variation [4], and we focus our study on protein-coding nonsynonymous single nucleotide polymorphisms (nsSNPs), whose presence result in amino acid substitutions, which potentially affect protein structures and functions, and further cause human disease [5]. A lot of previous studies have been conducted in identifying the disease nsSNPs against the neutral (non-disease) ones, which is often formulated as a binary classification problem, such as those of PolyPhen [4], SIFT [6] and KBAC [7]. With these studies, the yielding classification results contain only categories for each candidate nsSNP, either disease or neutral, without information about what specific diseases the nsSNP is related to. This raises questions about how to numerically evaluate the importance of the identified SNPs for arbitrary disease and select the top few susceptible ones, which would provide guidance for further prevention, diagnosis and treatment of the disease. For these purposes, we formulate the identification of disease nsSNPs from candidates as a one-class novelty learning problem. We compute a score from multiple sequence alignment of proteins to quantify the strength of association between a query disease and a candidate nsSNP, and th