思维导图软件imindmap完整教程
mindmap 思维导图制作方法
制作工具1. 一些A3或A4大的白纸。
2. 一套12支或更多的好写的软芯笔。
3. 4支以上不同颜色,色彩明亮的涂色笔。
4. 1支标准钢笔。
一、主题1. 最大的主题(文章的名称或书名)要以图形的形式体现出来。
我们以前作的笔记,都会把最大的主题写在笔记本纸面上最顶格的中间。
而思维导图则把主题体现在整张纸的中心,并且以图形的形式体现出来。
我们称之为中央图。
2. 中央图要以三种以上的颜色。
3. 一个主题一个大分支思维导图把主题以大分支的形式体现出来,有多少个主要的主题,就会有多少条大的分支。
4. 每条分支要用不同的颜色每条分支用不同颜色可以让你对不同主题的相关信息一目了然。
二、内容要求5. 运用代码小插图不但可以更强化每一个关键词的记忆,同时也突出关键词要表达的意思,而且还可以节省大量的记录空间。
当然除了这些小的插图,我们还有很多代码可以用。
比如厘米可以用CM来代表。
所以可以用代码的尽量用代码。
6. 箭头的连接当我们在分析一些信息的时候,各主题之间会有信息相关联的地方,这时,可以把有关联的部分用箭头把他们连起来,这样就可以很直观地了解到信息之间的联系了。
如果你在分析信息的时候,有很多信息是相关有联系的,但是如果都用箭头相联接起来会显得比较杂乱了。
解决这个问题的方法就是,你可以运用代码,用同样的代码在他们的旁边注明,当你看到同样的代码的时候,你就可以知道这些知识之间是有联系的。
7. 只写关键词,并且要写在线条的上方思维导图的记录用的全都是关键词,这些关键词代表着信息的重点内容。
不少人刚开始使用思维导图时,会把关键词写在线条的下面,这样是不对的,记住一定要写在线条的上面。
三、线条要求8. 线长=词语的长度思维导图有很多线段,它每一条线条的长度都是与词语的长度是一样的。
刚开始使用思维导图的人会把每根线条画得很长,词语写得很小,这样不但不便于记忆,同时还会浪费大量的空间。
9. 中央线要粗思维导图的体现的层次感很分明,最靠近中间的线会越粗,越往外延伸的线会越细,字体也是越靠近中心图的最大,越往后面的就越小。
机绘思维导图:iMindMap

机绘思维导图:iMindMap机绘是相对于手绘而言的,是指利用计算机和应用软件绘制思维导图。
工欲善其事,必先利其器。
熟练使用计算机软件进行思维导图的绘制,可以极大提高你的工作效率。
目前,绘制思维导图的软件不下百种,近期我们会选择其中几个典型代表做简单介绍。
子夜吴歌要向你介绍的第一款思维导图软件是iMindMap,如图1。
图1 iMindMap为什么先介绍这款软件呢?因为,iMindMap是思维导图的祖师爷——托尼·巴赞(Tony Buzan)直接指导开发的,是最符合巴赞思想的思维导图软件。
iMindMap深入贯彻执行了巴赞同志赋予思维导图的思想内涵,线条美观、使用方便、容易上手、适合初学者。
iMindMap10具有如下特点:头脑风暴视图:数字平台来捕捉你的想法iMindMap是唯一带有自由形态的头脑风暴视图的思维导图软件,它专注用于捕捉你零散的想法,而你根本不用担心想法的结构是否合理、是否具有组织性。
并且,iMindMap在软木板画布上增加了便利贴、图像和分类功能。
头脑风暴与思维导图视图的工作同步当你想要将你的想法变得可开发和可操作,只需简单地从头脑风暴视图切换到思维导图视图即可。
它也可以以另一种方式存在——在头脑风暴视图上显示你要添加在思维导图上的信息。
*仅限于 iMindMap 10 旗舰版3D效果震撼人心在iMindMap的3D视图中创建导图时,通过令人震撼的3D效果,让想法变得生动起来。
由于具备3D图像和三维背景环境的功能,iMindMap成了最具视觉刺激性的思维导图绘图工具。
尝试3D视图功能,在头脑风暴会议中添加一点戏剧效果,有利于创造出更大胆的想法。
另外,iMindMap3D演示的功能在吸引观众的同时会让他们静下心来用心听讲。
好看的界面给你带来更好的想法iMindMap是一款带有一些严肃风格的思维导图软件。
第一印象是最重要的,它决定了你从看到的事物中捕捉兴趣,并促使大脑的创意的齿轮开始转动。
用iMindMap做一份自我介绍的思维导图
用iMindMap做一份自我介绍的思维导图相信大家在工作生活当中对于自我介绍这件事情都很是头疼的。
太简单的介绍重点不突出,太冗长的介绍又会让人没印象。
这一切都跟我们大脑水平、散乱的思维模式有关,因此想要自我介绍在众人中脱颖而出,让人印象深刻,最重要的一点就是使用关键词,将你的自我介绍内容构建一个具象化的框架。
小编今日就使用iMindMap思维导图软件为大家展示一下自我介绍思维导图是如何制作的。
一、确定中心主题小编这次使用的是iMindMap11(Win系统)思维导图软件。
构筑自我介绍思维导图的第一步应该是确定自己的思维导图中心主题。
既然是自我介绍,那么思维导图的中心主题上就可以放上自己的照片或者是微信头像等等,具体需要根据应用场景进行操作,比如工作面试的自我介绍可以放一张正装免冠照片,校园交友的自我介绍就可以放一张微信头像或者自己的二维码等等。
图1:中心主题二、确定主分支在敲定自我介绍思维导图的中心主题后,接下来要使用iMindMap添加上自己想要的主分支。
主分支的内容可以是:姓名、年龄、职业经历、目前在职状态、教育经历、兴趣爱好、专业证书、家庭住址等等。
当然这些主分支也像中心主题一样是要根据你的自我介绍思维导图的应用场景来进行确定的。
具体操作如下:1、光标选中中心主题,可以看到有一个“+”的标记,点击直接添加主分支。
2、如果在iMindMap中需要编辑修改主分支,可以光标选中分支线后,选择“···”标记即可进行编辑。
图3:编辑主分支菜单界面三、展开主分支使用iMindMap思维导图软件编辑自我介绍思维导图的最后一个步骤就是在主分支下添加子分支,并按照实际情况添加和丰富子分支的内容。
如图4所示,通过选中主分支线,随后可点击主分支上的黄色按键添加子分支框或点击红色按键添加子分支线,添加成功后单击分支框或分支线即可编辑文字。
通过这样的方式制作出来的思维导图自我介绍可以自行收缩,在介绍过程中,讲到哪里就可以展开哪里,听众注意力更加集中,且这样的自我介绍更具象化,使人印象更加深刻。
mind map使用方法
mind map使用方法Mind map是一种具有视觉效果的思维导图工具,它可以帮助我们整理、理清思绪、思考问题和解决问题。
在本文中,我将解释mind map的基本原理、使用方法以及如何利用mind map提高学习和工作效率。
让我们一步一步来了解mind map的使用方法。
首先,让我们来了解一下mind map的基本原理。
Mind map源于英国的教育心理学家托尼·布宣(Jony Buzan)于1970年代创建。
它是一种以中心思想为核心的思维导图,通过将主题、思想、概念、问题和解决方案分支展开,以呈现出一个有层次、有关联的结构。
因此,我们可以将mind map视为一个由主题、分支和关联线组成的图形,它可以帮助我们更清晰、更有序地整理和表达思维。
接下来,让我们了解一下mind map的使用方法。
首先,我们需要选择一个中心主题,并将其写在mind map的中心位置。
然后,我们可以根据主题,将相关的子主题或问题写在主题周围的分支上。
每个子主题可以继续展开为更具体的分支,在分支之间可以通过关联线来表示它们之间的联系。
此外,我们还可以使用符号、颜色、图标和图片等元素来增强mind map 的视觉效果和帮助记忆。
在编写mind map时,我们需要注意使用简洁的关键词或短语来表示概念,以便更容易理解和记忆。
Mind map的使用方法还包括以下几个环节:关联、应用和评估。
关联是指将不同的思想和概念通过关联线连接起来,以便更好地理解它们之间的联系和相互作用。
应用是指将mind map应用于不同的学习、工作和问题解决过程中,以帮助我们更高效地组织、理解和表达思维。
评估是指定期回顾和评估mind map的有效性和效率,以便进行必要的调整和改进。
接下来,让我们看一下如何利用mind map提高学习和工作效率。
首先,我们可以将mind map用于课程学习。
将课程主题作为中心,将每个章节或概念作为分支,进一步展开为每个小节或关键点。
【教程】思维导图使用简易教程 MindManger软件使用图解

示例1
.
示例2
.
7.6 插入图标标记
.
图库中选择
.
7.7 背景:空白区单击右键=>背景
.
选择
.
7.8 插入便笺:主题/子主题=>右 键=>便笺
.
示例
.
7.9 插入附件:方法同上
.
选择文件=>确定
.
示例
.
7.10 插入超链接:方法同上
.
填写网址=>确定
.
示例
.
7.11 插入图片:方法同上
.
圆圈处修改图片大小
.
文字等设置:选中需要修饰的部分
.
示例
.
8、主菜单
.
8.1 选择模板
.
.
8.2 打开导图文件
.
.
8.3 导入与导出文件
.
.
8.4 保存图片文件:另存为“其它格式”
.
选择“.jpg” “.gif” “.bmp” “.png”均可
.
.
5.4 线条弧度样式及子主题布局设置
.
5.5 线条粗细、阴影效果设置
.
示例
.
6、子主题设置:格式化主题
.
此处线条设置指该子主题线条颜色
.
此处填充设置指该子主题填充颜色
.
此处形状设置指该子主题形状颜色
.
示例
.
7、其它实用功能 (附工具栏相同任务)
.
7.1:插入附注
.
示例
.
7.2 插入关联线
思维导图使用简易教程
——MindManager软件使用图解
.
1、打开文件
.
2、填写中心词ቤተ መጻሕፍቲ ባይዱ
iMindMap思维导图怎么分屏移动分支?
iMindMap思维导图怎么分屏移动分⽀?
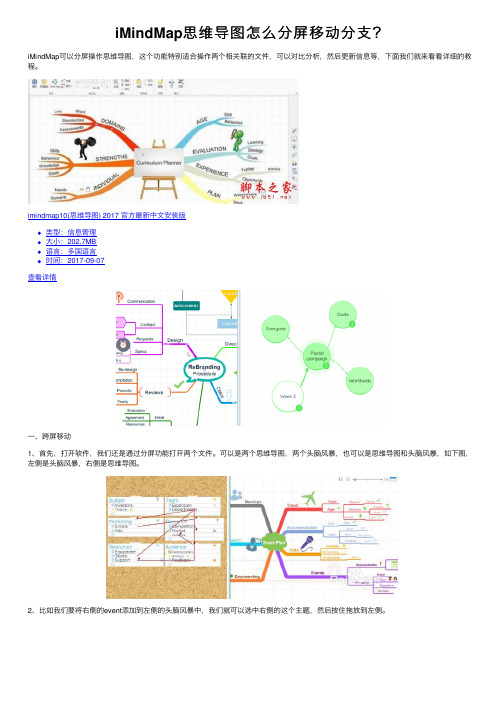
iMindMap可以分屏操作思维导图,这个功能特别适合操作两个相关联的⽂件,可以对⽐分析,然后更新信息等,下⾯我们就来看看详细的教程。
imindmap10(思维导图) 2017 官⽅最新中⽂安装版
类型:信息管理
⼤⼩:202.7MB
语⾔:多国语⾔
时间:2017-09-07
查看详情
⼀、跨屏移动
1、⾸先,打开软件,我们还是通过分屏功能打开两个⽂件。
可以是两个思维导图,两个头脑风暴,也可以是思维导图和头脑风暴,如下图,左侧是头脑风暴,右侧是思维导图。
2、⽐如我们要将右侧的event添加到左侧的头脑风暴中,我们就可以选中右侧的这个主题,然后按住拖放到左侧。
3、拖放之后,右侧的分⽀会被复制到左侧,然后以头脑风暴的形式展⽰出来。
⼆、跨屏复制粘贴
1、⾸先我们以同样的⽅式先打开两个任意的导图,不限定形式,⽐如下图打开是辐射图和快速捕获泡泡组。
2、选中你需要复制的分⽀,⽐如右侧的这个彩⾊的球,选中的部分会背景为红⾊,然后点击复制按钮,或者使⽤Ctrl+C。
3、然后我们来到左侧的辐射图中,选择你需要放置的位置,⽐如这个绿⾊的design,然后使⽤粘贴按钮或者Ctrl+V。
4、复制之后,这个内容就会显⽰在对应的导图中。
5、如果你更改了第⼀个导图中的转换了分组,第⼆个导图也会相应的改变。
以上就是iMindMap分屏移动分⽀的程度,希望⼤家喜欢,请继续关注。
怎么用iMindMap做一个思维导图
怎么用iMindMap做一个思维导图许多朋友在平时工作和学习都会有使用思维导图的习惯,确实,思维导图无论是在工作和学习中都能给我们带来极大的便利。
所以接下来小编想向大家分享如何用思维导图iMindMap(win系统)这款思维导图创建软件制作自定义思维导图,为您带来工作和学习上的便利。
第一步:创建空白模板,打开思维导图软件iMindMap软件后,在软件主界面我们会看到新建中会有许多视图可供选择。
想制作自己喜欢的思维导图的话可以通过模板新建中的向导来制作。
向导不同于视图或者模板,它更像一个空白模板,可以根据自己的喜好来添加各种元素。
图 1:思维导图软件创建空白模板第二步:选择向导,在进入空白模板后我们依然会需要选择选择向导,可根据自己的思维导图类型而选择不同的向导。
小编想创建一个细胞结构的思维导图,但想完全自主创作,故选择了新建,未选择内置向导。
图 2:选择向导第三步:编辑思维导图,1.创建基本导图构像,在选完向导之后我们还可以选择一个基本图像来切合自己的主题。
而后,可在该图像后用Tab或Enter来添加同级分支。
选择后可出现如下分支,根据要输入的内容可更改其图像特点,并可移动或添加,双击编辑文本内容。
图 3:分支创建2.编辑,在思维导图软件iMindMap编辑界面的上方,有主页插入,布局及设计,显示和工具还有项目这几栏,在这些工具栏的基础上我们可以对思维导图的布局进行设计,使其符合自己喜欢的特点,也可以根据需要插入喜欢的注释,语音,附件等等,以丰富思维导图的内容。
让思维导图更加生动。
图 4:插入菜单栏另外,我觉得需要强调的一点是思维导图软件iMindMap的项目一栏的强大功能,在我点击项目一栏后,软件画面中多出两个表格,但是这两个表格的作用确实非常大的。
如下图,这两个表格分别列举出的我的导图中分级分类以及时间,为我们后续查看和更改导图带来了极大的便利,确实是一项特别好的功能。
第四步:保存结果,点击界面左上角保存标志即可保存自己的作品了。
思维导图imindmap6破解版安装
思维导图imindmap6破解版安装1. 软件和和谐包官方程序:imindmap6和谐包:iMindMap6.X 和谐包V2.42. 软件安装正常安装即可。
d:\Program Files\ThinkBuzan\iMindMap 6\3. 和谐包安装过程(安装后就是破解极限版的使用功能哦)1)安装官方程序2) 关闭官方程序,以及电脑右下角任务栏中的imindmap的预载(preload)图标3)安装和谐包v2.44.imindmap6汉化:选择中文(繁体)路径:文件-选项-国际化-程序语言先选择“英文”,然后重启软件(不用重启电脑哈);再选择回“中文(繁体)”,木有中文简。
再重启软件,噢了!5.软件使用注意(1)3D显示确认自己的显卡是否支持3D,这几年的电脑一般都是木有问题的哈。
一般更新显卡驱动即可。
(2)添加关联线将鼠标放在分支末端,会自动的出现四色编辑器,其中蓝色—自由移动;黄色—建立分支“框”(及带框的分支);绿色—关联线;中心的红色—子分支(不含框)。
1)点住绿色部分向外拉到关联的分支节点处,即建立了关联线哦:)2)设置关联线的格式。
点中关联线,右键-格式中进行设置,如颜色、大小、节点形状、线条样式等。
(3)安装后无法正常使用。
先用官方安装包卸载iMindMap61)卸载之后重启电脑2)删除以下文件winxp 删除"C:\Documents and Settings\AllUsers\ThinkBuzan\imindmap_cache"文件夹winxp 删除"C:\Documents and Settings\All Users\JSoft" 文件夹win7 删除 "C:\ProgramData\ThinkBuzan\imindmap_cache" 文件夹win7 删除 "C:\ProgramData\JSoft" 文件夹3)重新安装iMindMap6在安装过程中,要安装到新的目录下。
IMINDMAP思维导图怎么添加关联线
我们首先打开后点击新建一个主题,并且添加子主题。
我们建立关联的时候,先选中目标主题,随后在主题旁的按钮中点击最后的绿色关联线按钮。
那么就会产生一条由目标主题出发的关联线。
我们再点击另外一个想要建立关联的主题,就会在两个主体间建议关联线。
将鼠标放置在关联线上时,就会发现会有蓝色圆圈节点,我们点击圆圈并且拖动鼠标可以对关联线的位置进行调整。
另外,我们还可以在关联线上进行输入文字,对关联进行补充说明。
另外,当我们点击关联线时,会看到有关联线的格式对话框,我们可以根据选项更改关联线的格式。
怎么使用IMindMap制作布局统一的思维导图
怎么使⽤IMindMap制作布局统⼀的思维导图怎么使⽤IMindMap制作布局统⼀的思维导图呢?IMindMap拥有⾮常⽅便的导图编辑功能,就算⽤户是第⼀次接触这款软件也可以轻松上⼿进⾏编辑,将脑海中浮现的灵感通过图形的⽅式表现出来,特别适⽤于头脑风暴、策划和管理项⽬、创建演⽰⽂稿等同时软件还具备线条⾃由、⼿绘功能等特点,可为您提供另⼀种创造性的⽅式来捕获,整合和组织信息。
下⾯⼩编就给⼤家详细介绍IMindMap制作布局统⼀的思维导图,需要的朋友⼀起看看吧!IMindMap免费版下载地址:iMindMap 12 ⼿绘思维导图软件 v12.0.18 多语中⽂安装版类型:办公软件⼤⼩:194MB语⾔:多国语⾔时间:2021-01-25查看详情⼿绘思维导图软件 iMindMap v11 简体中⽂特别版(附激序列号+补丁+激活教程)类型:信息管理⼤⼩:219MB语⾔:简体中⽂时间:2018-05-13查看详情imindmap10(思维导图) 2017 官⽅最新中⽂安装版类型:信息管理⼤⼩:202.7MB语⾔:多国语⾔时间:2017-09-07查看详情思维导图软件(iMindMap) v9 多语安装版类型:信息管理⼤⼩:144MB语⾔:多国语⾔时间:2016-05-16查看详情IMindMap制作布局统⼀的思维导图的技巧:⼀、布局功能如图2所⽰,如果您只需要调整分⽀的样式、间距、紧缩⽅式的话,可以直接使⽤iMindMap的布局功能。
图2:布局功能如图3所⽰,通过调整分⽀样式,可以统⼀地调整导图中所有分⽀的样式,如细线条式分⽀、粗线条式分⽀等。
图3:调整分⽀样式⽽紧缩⽅式指的是,当分⽀之间存在较⼤间距时,可以通过紧缩让导图整体看起来更加紧凑。
iMindMap提供了如图4所⽰的三种紧缩⽅式,我们可以在制作思维导图的过程中关闭⾃动紧缩,然后在最终调整格式时,再开启完整的紧缩⽅式,提⾼导图的制作效率。
图4:调整⾃动紧缩⼆、设计功能如果需要对思维导图中的⾊彩、字体、布局等进⾏统⼀调整的话,就需要使⽤iMindMap的设计功能。
怎样通过iMindMap向导绘制一日计划思维导图
怎样通过iMindMap向导绘制一日计划
思维导图
iMindMap思维导图中的向导可以帮助我们快速的建立相应的思维导图,这是初学者的一个入门捷径。
甚至我们的日常计划也可以通过iMindMap思维导图来完成,下面本文就介绍了怎样通过iMindMap向导绘制一日计划思维导图。
在iMindMap模板的向导选项中,点击开始。
在选择iMindMap向导时,设置向导的思维导图类型为“计划您的一天”。
iMindMap向导将一日计划思维导图导图划分为5个步骤来完成,分别为日期、上午、下午、晚间以及完成。
我们根据向导的步骤进行内容填写。
我们根据个人的计划填写好一日中需要做的事情,在最后完成窗口中,我们可以对一日计划进行完善。
我们可以添加注释到任何任务,我们可以为导图附上超链接和文件,包括任何类型的文件、图像、语音、视频,我们还可以根据优先级来筛选分支。
我们点击完成后就会看到iMindMap自动生成一幅一日计划思维导图。
我们也可以继续对其进行完善。
通过同样的方法我们还可以建立目标设置思维导图。
手绘版思维导图软件IMINDMAP说明文档
大脑银行——给全人类的大脑装上世界上最先进的程序
最新版思维导图软件I Mind Map V4汉化破解中文版简介:思维导图创始人托尼·巴赞(Tony Buzan)开发的导图软件,线条自由,具有手绘功能,是比较好用的导图软件。
第一步:安装软件
软件下载完成后按提示安装,建议安装在c盘,(如果安装在其他盘,后续破解软件安装和此对应),安装成功后,如果不破解软件可试用8天,通过第二步破解补丁安装可终身免费使用。
第二步:安装破解补丁Protection.jar将上述文件原封不动复制到c 盘C:\Program Files\Buzan Online\Buzan's iMindMap\lib下,替换原有同名文件)。
温馨提示:安装完成之后,软件提示要注册,这个只需随便填写即可,填写完,软件就出现正常页面,第一次使用会有动画提示,这个可以设置以后启动不开启。
然后跳过这个之后,以后就可以正常使用了。
用软件画图的简明使用教程:看视频介绍
1、每条分支线上,都有三个圆环,按住鼠标可以拉长更改形状,其中。
2、每条线上点击后,移开鼠标,直接输入关键字。
3、线上点击右键,插入分支和图像、及其他。
思维导图基地:思维导图教程购买请进入。
ImindMap 9基础教程
4.添加二级以上分支及关键词: 我们可以在已有的一级分支基础上,创建二级以上分支。操作方
法与添加一级分支类似。只不过我们要选中分支,再进行操作。如图 所示:
三、分支的调整
Imind Map9 基础教程
1.修改分支颜色 (1)鼠标选中要修改颜色的分支,如图所示:
(5)单击主页按钮,找到粘贴按钮,单击粘贴,或者用组合键 Ctrl+V。
(6)单击主页,在布局选项菜单中单击整理。
(7)删除 单击选中要删除的对象(中心主题或分支均可),再单击编辑选
Imind Map9 基础教程
项菜单中删除按钮即可。
2.不同思维导图的复制与粘贴 (1)新建一个空白的思维导图,并输入标题,比如:
按住鼠标左键,拖动选中红色分支中所有分支框,在单击主页, 在格式化选项中,单击色彩填充选择器按钮,在弹出的菜单中选择颜 色即可。如图所示:
Imind Map9 基础教程
3.改变分支形状 (1)改变所有分支框形状
①Ctrl+A(或者单击主页,在单击区域选择按钮,鼠标左键拖动 选择)选中所有分支 (2)单击主页菜单中,格式化选项菜单中“转换当前分支为反向分 支框”按钮。 如图所示:
(3)单击“演示”,在弹出的对话框中输入新建演示的名称
Imind Map9 基础教程
(4)点击创建
(5)点击播放,持续单击鼠标,演示完成后单击键盘上 Esc 键退出。 九、思维导图的保存、另存为、导出与共享 1.思维导图的保存和另存为 (1)单击软件视窗左上角的软盘标志,选择保存路径即可完成保存。 (2)单击文件选项菜单保存选项,选择保存路径即可完成保存。 (3)单击文件选项菜单另存为选项,选择另存路径即可完成保存。 2.思维导图的导出与共享
imindmap5快速入门
iMindMap Quick Start Guide – PC UsersCREATING YOUR FIRST MIND MAPThis guide is designed as a quick starting point for learning how to use iMindMap. Simply follow the basic step-by-step instructions to create your first Mind Map.Please note that this guide is not intended as a complete illustration of all the features of iMindMap. For more information on all of the features and advanced tools contained within the software, please explore iMindMap Help which can be accessed within iMindMap.Step 1 - Central Idea/ThemeUsing a central image to help represent your main goal or theme is a major factor in effective Mind Mapping.(1.1)When you open iMindMap , select the New Document button in the top tool bar. (1.2) Select a Central Idea image from the library provided by clicking on it (see Fig 1 below).Fig 1(1.3) Your Central Idea Image will then be displayed in the centre of the screen. If you click on this you can then type your Central Idea text (see Fig 2 below).Fig 2Note: The name that you give your Mind Map will automatically be adopted as the name of the iMindMap file. This has the extension .imx when saved. If you wish to use a different name for your file, go to File > Save As and amend your file name.Step 2 – Main BranchesNow you are ready to add a series of primary ideas connected to your central theme. Your main branches represent your main ideas, the primary concepts or ‘hooks’ on which to hang all associated ideas.(2.1)To create a main branch – Left click over the red circle in the centre of the Central Image (which will appear when you hover your mouse pointer over the Central Image) and drag yourmouse outwards until your achieve the desired branch length.(2.2) To add a label/text to your branch – Immediately after creating your branch type your textand press Enter. It will then be automatically attached to the branch (see Fig 3 below).Fig 3Tip: For effective Mind Mapping, try to only use one keyword per branch. A single word is better at triggering thoughts and aiding memory recall than phrases or sentences.Tip: Box Branches are great for including more than two words on a branch. To create a Box Branch, simply click on the Box Branch icon under the Home tab before you create a new branch. Now create as many branches as you like to represent your primary concepts. Please see examplebelow(Fig 4).Fig 4iMindMap also has an inbuilt feature known as ‘SmartLayout’. The main purpose of this feature isto create iMindMaps in a quick and fast way.SmartLayout SettingsThe SmartLayout naturally lays out your Mind Map without you having to worry about branches, text or images colliding or overlapping. SmartLayout is activated by default, and if any branches, text or images get within a certain distance from other branches, then the branches will adjust automatically to avoid overlapping.Under the ‘Format’ tab you can select ‘SmartLayout Settings’ which will allow you to turn SmartLayout on or off.The SmartLayout feature is also a great tool to use when you are making Mind Maps quickly using just your keyboard. Save time and move away from your mouse and let the iMindMap’s SmartLayout do the hard work so you can concentrate on generating ideas.You can quickly insert new branches and add a text label using the following keyboard shortcuts without any fear of them colliding or overlapping and removing the need to use your mouse: Insert child branch TabInsert sibling branch EnterInsert child box branch Shift + TabInsert sibling box branch Shift + EnterNavigation Use Arrows keysNote: In order to change the font, colour or size of the text, left click once on the branch of the text you wish to change and simply choose the settings using the formatting bar near the top of the main window. You do not need to highlight the text to change it.For future use – iMindMap features a selection of pre-set colours and themes in order to speed up the customisation of you Mind Map. To use these quick and easy style sheets, click on any of the pre-set styles near the top of the workspace, located under Design - as shown below (Fig 5). You can scroll through additional pre-set styles by using the arrow keys or the drop down menu on the right hand side of the Styles bar.Fig 5(2.3 ) Modifying or moving your branchTo modify or move your branches, left click and drag your mouse over the blue ring found on the outside of any Branch Target which appears when you point your mouse at the end of any branch. This is ideal for lengthening, shortening, raising or lowering branches.Step 3 - Adding Images/Symbols to your Main IdeasUsing images and symbols when creating your main branches will assist in prompting your imagination and can aid memory through their ability to trigger associations in your mind.(3.1) Image Library – The Image Library contains over three thousand offline images which you can browse for inclusion in your Mind Map. To access the Image Library, click on the Insert tab in the main toolbar, and then select Image Library.Note: If you login to your ThinkBuzan account within the software, you will gain access to our online image database which has over thirty thousand extra images. In order to login through the software, ensure you are connected to the internet, click on the Red light button in the bottom left hand corner of the main window and select Login. You will now be prompted to enter in your account information. This account information is the same you use to login to the ThinkBuzan website at . Once you have successfully logged in, the Red light will change to a Green light and you can search the Image Library as you normally would whilst having access to a larger variety of images.The Image Library will appear within the side panel on the right-hand side of the screen.The Image Library has a built-in search tool which requires you to type a word or phrase into the search bar. Once this is done, click on the magnifying glass icon to search. You will then be presented with a choice of images related to your search word or phrase.(3.2) Icon Library – The Icon Library contains a diverse bank of icons which can be used in your Mind Map. The icons are classified into categories for easy navigation. To access the Icon Library, click on the Insert tab in the main toolbar, and then select Icon Library (to the right of the Image Library). The Icon Library will appear within the side panel on the right hand side of the screen. (3.3) Inserting an image from the Image and Icon Libraries•Inserting on to a branch – To attach the image or icon to a branch, you must first make the branch active before using the Image / Icon Library. With the branch selected, double click the image/icon you want to use and it will appear attached to the branch. (please see Fig 6 below).•Inserting as a Central Idea – To insert the image (please note that you cannot insert an icon as a Central Idea) as a Central Idea, ensure that no branches are selected, choose yourrequired image and double click it. Your image will now be visible on the iMindMapworkspace and you can start adding main branches.Fig 6(3.4) Re-positioning an image - Your image can be clicked and dragged to any other position on your Mind Map.(3.5) Re-sizing an image – To re-size an image, Left Click on the image, then click and drag on any of the eight ‘Grab Handles’ that appear.(3.6) Rotating an image - To rotate an image click and drag on the rotation tool which appears in the bottom right hand corner of the selected image. Please note animations cannot be rotated. Step 4 – Creating Child BranchesNow that your main branches are in place, your secondary and tertiary concepts can flow quickly and easily to facilitate a harmonious thought structure.(4.1) Adding child branchesYou can create child branches from your existing main branches by clicking and dragging from the red centre circle of a branch target that will appear when you point towards the end of a branch. iMindMap will automatically create thinner branches to characterise this next level of ideas and associations (see Fig 7 below). It is recommended that you:•Use key words to develop and explain your main ideas.•Again try and only use one word on each of your branches to help your mind spark off new ideas and thoughts – keep it simple.•Keep exploring all of your main branches until you feel that you have added enough child branches to reflect all your next level of associations.Fig 7•You can delve into your subject further by adding more sub-branches to your child branches to represent your tertiary thoughts and concepts and so on.•Remember to include images and symbols where appropriate to engage your imagination, clarify topics and aid your memory.Step 5 – Emphasising Relationships and Creating Boundaries(5.1) Adding RelationshipsThere may be times when two concepts are related to each other even if one does not follow the other. To make connections within and across the branch pattern or between different maps on your workspace (if you have MultiMaps), you can use the Relationship feature.To add Relationships:•Firstly select the Home tab on the main toolbar and then select Relationship.•Select the end of one of the branches that you wish to connect with another and then click and drag to the related branch.•When you release the mouse, your Relationship will appear connecting the two ideas.•To add text to your Relationship, simply type when it is selected / active.•To modify the shape of the arrow, simply click and drag your mouse over the Control Points (blue circles) that appear inside the length of the Relationship. You can add more controlpoints to make them more flexible by holding down the shift key and clicking on the spot where you want the new control point to appear.• To change the colour of your Relationship, ensure the Relationship is selected and modify the colour using the Branch Colour Selector Tool.•You can format your Relationship further by going to the Format tab and selecting Relationship.Fig 8(5.2) Adding BoundariesAdding boundaries can make specific topics ‘stand out’ making them easier to remember and communicate to others. They also allow you to group ideas together with a visual boundary. To add a Boundary:•Ensure the branch topic that you want to add a Boundary to is selected.•On the Home tab, select Boundary. A Boundary cloud will now surround your selected topic. Please see Fig 10 below.Fig. 10•If you want to amend the colours and shape of your Boundary, make sure the branch the boundary surrounds is selected. Then double click within the Boundary. This will give you options to select fill and line colours as well as the options to adjust the Padding, Amplitude and Frequency of the Boundary. Make sure the branch that the Boundary is associated to is selected in order to make the options available.Fig. 11Step 6 – Moving Branches via Drag and Drop(6.1) Moving branches to new positions using drag and dropTo move branches to new positions select the branch you wish to move and whilst holding the left mouse button down drag to the desired branch. When you can insert the branch onto a new branch you will see a small greyed out silhouette of the branch locking onto the end of the new branch as seen in Fig 12 below.Fig. 12The branch and its child branches will then be moved. Please note: when moving branches or cutting and pasting branches iMindMap will automatically flip the branches so that they continue to have the same structure but they also follow the correct direction of their new parent branch. SmartLayout will ensure that any branches that are moved do not collide or overlap with any other branches, text or images.Step 7 – Inserting InformationTo further explain and explore specific concepts, you may wish to link files, hyperlinks or notes to some of your branches. These can be accessed for reference purposes at any time.(7.1) Attaching files and linksTo attach a link to a branch, ensure the branch you want the link to appear on is selected, then click on the Home tab on the main toolbar and then select Link. Alternatively, you can right click on the branch and select Insert Link. The Hyperlinks side panel will now appear to the right of the screen.You can add a link to a file by selecting the Folder icon and locating the file.You can add a link to a website by clicking on the Chain icon and entering the URL in to the box.(7.2) Adding Text NotesYou may want to assign a note to a topic to add further information or data to your branch. Use the ‘Notes Editor’ for this:Notes Editor – iMindMap includes a word processor that will allow you to add notes to your branches. Ensure the branch you want to attach the note to is selected. Then, simply click on the Home tab in the main toolbar and select Note. A box will open up to the right of the screen for you to enter your notes (Fig 13).Fig. 13(7.3) Smart CellsSmart Cells allow you to insert Spreadsheets, Flowcharts and even your own Sketches on to your branches.To insert a Smart Cell, select a branch and go to Insert on the main tool bar.From here you can choose which type of Smart Cell you would like to insert to your branch.To insert a Spreadsheet, select the Spreadsheet icon and the Spreadsheet Editor will appear.From this editor you can create a basic Spreadsheet, ideal for showing statistical information in your Mind Map.From the format bar at the top of the editor you can choose font colour and style, cell colour, and border style.You can use the Sum (Σ ) and Percentage icons to create formulas in your Spreadsheet.After you have created the Spreadsheet, click the Save button and close. Your Spreadsheet should now appear on your branch.To insert a Flowchart, select the Flowchart icon and the Flowchart Editor will appear. Drag and drop the shapes into the canvas and use the connector tools in the toolbar to link these together. Save this using the Save button and close.(7.4) MultiMapsYou can insert a number of different Mind Maps onto your workspace. This feature allows you to have multiple central ideas which you link together and connect if you should wish, see Fig. 14.Fig. 14This is a really useful tool to use when you want to connect lots of ideas or if you Mind Map is getting big, you can create another main idea instead of making lots of child branches.It can also help you to make it visually clearer and easier to make connections between ideas as you can create relationship arrows from a branch of one central idea to a branch of another one. To create another central idea you can either:a)Go to the Insert tab and select Central Idea under Map Elements.b)Drag a branch or an image from your Mind Map into the workspace – this will default to bea new Mind Map. If the branch has child branches these will now become a new mainbranches.Step 8 – Viewing your Mind Map in 3D3D View offers a completely new way to present. The world’s first 3D Mind Map view takes your Mind Map and turns it into a 3 dimensional object, allowing you to glide around it from different angles, zoom in on different areas and turn Mind Mapping into a whole new experience. You have watched 3D films, you’ve perhaps seen 3D TV, now present in 3D – the ultimate of cool. Impress, stun and grip your audience which a totally fresh way of presenting that is fun to use and mesmerizing to watch.To enter 3D Mind Map View, go to the Home tab at the top of the main tool bar and select 3D Mind Map under Document Views.The real beauty of 3D View is the easy navigation. You can use your keyboard arrow keys, the simple 3D Control Panel (in the bottom right hand corner of your workspace) or even your mouse. You should notice that iMindMap gracefully animates as you pan around your workspace, zooming in at any angle.Keyboard Arrows: This will allow you to jump from one branch to another easily. This zooms in on the active branch, giving the branch focus.3D Control Panel: The left / right & up / down arrows will change the angle of your perspective, so you can change the 3D planes of your map. The central circle button will re-position your Map to its original position.Mouse: Click on a branch to give it focus, or navigate to the white workspace to simply move the Map into a new position.Step 9 – Exporting your Mind MapThere are several export options within iMindMap , giving you choice in how you want to share and transport your Mind Map. These include:•Exporting as an Image file.•Exporting to an SVG•Exporting to PDF and Document•Exporting as a Web Page•Export as a Spreadsheet•Export as a Presentation and Interactive Presentation•Export to Microsoft ProjectThe Export Menu can be accessed by clicking on File and then selecting ‘Export’From there, the list of export option will appear for you to select.Note: The Export features are limited for different iMindMap EditionsiMindMap Basic: Export to Image & PDFiMindMap Elements: Export to Image & PDFiMindMap Pro: Export to Pack & Go, Text and WebpageiMindMap Ultimate: SVG, Presentation, Spreadsheet, Project, AudioStep 10 – Printing and Saving your Mind Map(10.1) PrintingYou can print your active Mind Map by selecting the print tool located under the File tab at the top left corner of the iMindMap window. From here you can choose the number of copies you want to print and which printer to use. You can also choose whether you want to print the full map, just the central ideas, or just the main branches. You may also choose other options such as page layout i.e. portrait or landscape as well as scaling options.(10.2) SavingRemember to save your Mind Map before exiting iMindMap.•To Save, click on the Disk icon at the very top left hand corner of the screen.•If necessary, select the folder in which you want to save the document.•Click ‘Save’Alternatively you can click on File on the main tool bar, and click on Save or Save As, if you wish to change the name of the current Mind Map.Note: All iMindMap documents are automatically saved with the extension ‘.imx’.Why not watch our video tutorials for a more detailed look at iMindMap and its features?。
MindMapper使用说明书
MindMapper使用说明书这是制作的mindmapper的使用的入门简介,新手上路,和大家一起学习。
一.绘制思维导图的基本步骤1.将中心主题置于中央位置,整个思维导图将围绕这这个中心主题展开。
2.大脑不要受任何约束,围绕中心主题内容进行思考,画出各个分支,及时记录下瞬间闪现的灵感。
3.留有适当的空间,以便随时增加内容。
4.整理各个分支内容,寻找它们之间的关系,并且要善于用连线、颜色、图形等表二.绘制思维导图的技法技法是为了让我们绘制出的思维导图更能够反映大脑的工作过程,提高思维导图的应用水平,最终形成自己特色风格的思维导图和思考方式。
1.突出重点2.为了改善记忆和提高创造力,在思维导图中必须强调重点。
突出重点的方式很多,首先就是要尽量多的使用图像,不仅中心主题中用图像,在整个思维导图中都要尽量多的采用图像,,因为图像能够自动的吸引眼睛和大脑的注意力,可以触发无数的联想,并且是帮助记忆的一个极有效的方法,图像还能够使人感到愉悦。
除了图像之外,还可以更多的使用颜色、或者通过层次的变化以及间隔的设置、线条的粗细等方式,突出思维导图中的重点。
3.2.发挥联想4.联想也是改善记忆和提高创造力的一个重要因素,它是大脑使用的另一个整合工具,是记忆和理解的关键。
强调重点的各种方式有利于产生联想,同样,用于联想的方法也能用于强调重点。
箭头能够自动引导眼睛,所以可以将思维导图的一部分与另一部分用箭头连接起来,给你的思想一种空间指导,思维导图通过联想浑然一体。
此外,使用色彩和代码——对勾、圆圈、三角、下划线等,同样也可以拓展联想。
5.3.清晰明白6.清晰明白的思维导图能够给人以美感,增强感知力。
为了达到清晰明白,分支上最好使用关键词,书写要尽量工整;线条的粗细要有区别,特别是与中心主题相连的线条要粗;图形要清楚,能够表达相应的含义;横放纸张能够让你的图有更大空间;……;很多种方式都可以让思维导图更清晰明白。
7.4.形成个人风格8.在上述的基础上,每个人都能够画出自己的思维导图,逐渐就可以形成了个人风格。
怎么实现iMindMap中的演示功能
利用iMindMap演示功能来将主题逐一突出显示,达到动态播 放的效果。通过演示功能,可以不断还原制作导图的过程, 以激发更多的灵感。那么这么实用的功能我们该如何去使用 呢,本文就教你如何在iMindMap中进行演示。
我们首先打开运行iMindMap思维导图,在【主页】的“显 示”板块找到演示功能按钮。 我名称,当然也可以忽略不填。
通过上下箭头可以调整幻灯片的顺序,这也是后面演示播放 的顺序。 想要退出iMindMap演示直接点击右上角的退出即可。
在下面的显示中选择你想要建立的演示模式,2D或3D,咋 样式中选择是自动创建还是您自己手动选择创建。 随后,点击右下角的创建按钮,便可以进入演示模式。结 合演示工具栏中的功能按钮,来播放、编辑、删除幻灯等。
在演示模式的左侧还有幻灯片面板,可以看到由导图生成 的幻灯片。
点击幻灯片右侧的笔状图标可以为幻灯片添加注释。
思维导图软件imindmap 完整教程
思维导图软件imindmap 完整教程Buzan's iMindMap是思维导图创始人托尼·巴赞(TonyBuzan)开发的思维导图软件,线条自由,具有手绘功能。
思维导图是表达发射性思维的有效的图形思维工具。
思维导图运用图文并重的技巧,把各级主题的关系用相iMindMap互隶属与相关的层级图表现出来,把主题关键词与图像、颜色等建立记忆链接,思维导图充分运用左右脑的机能,利用记忆、阅读、思维的规律,协助人们在科学与艺术、逻辑与想象之间平衡发展,从而开启人类大脑的无限潜能。
推出全球首个3D视图的思维导图软件!一个让你的想法找到一个全新的视角创新之路。
从各个角度浏览你的导图,以一个全新的全局方式放大和搜索不同的区域思维导图软件——Imindmap4.1.2版本(最新)(软件自带“帮助文件”转化成——word版)目录:添加图像及图标演示起点如果您想从某一具体分支而非从中心思想开始演示,请在正常的iMindMap 工作区中右键单击目标分支,选择'演示'->'从此开始演示'选项。
然后通过单击'模式'>'演示视图'以标准的方式开始演示。
如果您当前处于'逐一分支展开'动画模式,则下次将显示开始所有前面分支的演示,您选择的分支将处于演示屏幕的中心。
或者,如果您当前处于'按主要分支展开 '动画模式,则下次将显示开始所有前面分支的演示,但焦点将在选定分支的父级分支及其所有前面的子分支。
通过在iMindMap主工作区中取消选择'从此开始演示'复选框,您可以轻松关闭此选项-只需右键单击,选择'演示',单击'从此开始演示'选项,该选项即被取消选择。
或者,您可以保留打开此选项,单击中心思想。
当您进入演示视图时,您的演示将从中心思想开始。
演示工具栏演示工具栏将出现在演示显示模式的下方:导航按钮:从起点开始-把主题置放在屏幕的中央及折叠分支。
- 1、下载文档前请自行甄别文档内容的完整性,平台不提供额外的编辑、内容补充、找答案等附加服务。
- 2、"仅部分预览"的文档,不可在线预览部分如存在完整性等问题,可反馈申请退款(可完整预览的文档不适用该条件!)。
- 3、如文档侵犯您的权益,请联系客服反馈,我们会尽快为您处理(人工客服工作时间:9:00-18:30)。
思维导图软件
imindmap 完整教程
Buzan's iMindMap是思维导图创始人托尼·巴赞
(Tony Buzan)开发的思维导图软件,线条自由,
具有手绘功能。
思维导图是表达发射性思维的有效的
图形思维工具。
思维导图运用图文并重的技巧,把各
级主题的关系用相iMindMap互隶属与相关的层级图
表现出来,把主题关键词与图像、颜色等建立记忆链
接,思维导图充分运用左右脑的机能,利用记忆、阅
读、思维的规律,协助人们在科学与艺术、逻辑与想
象之间平衡发展,从而开启人类大脑的无限潜能。
推出全球首个3D视图的思维导图软件!一个让你的
想法找到一个全新的视角创新之路。
从各个角度浏览
你的导图,以一个全新的全局方式放大和搜索不同的
区域
思维导图软件——Imindmap4.1.2版本(最新)
(软件自带“帮助文件”转化成——word版)
目录:
添加图像及图标
演示起点
如果您想从某一具体分支而非从中心思想开始演示,请在正常的 iMindMap工作区中右键单击目标分支,选择'演示'->'从此开始演示'选项。
然后通过单击'模式' > '演示视图'以标准的方式开始演示。
如果您当前处于'逐一分支展开'动画模式,则下次将显示开始所有前面分支的演示,您选择的分支将处于演示屏幕的中心。
或者,如果您当前处于'按主要分支展开 '动画模式,则下次将显示开始所有前面分支的演示,但焦点将在选定分支的父级分支及其所有前面的子分支。
通过在iMindMap主工作区中取消选择'从此开始演示'复选框,您可以轻松关闭此选项 - 只需右键单击,选择'演示',单击'从此开始演示'选项,该选项即被取消选择。
或者,您可以保留打开此选项,单击中心思想。
当您进入演示视图时,您的演示将从中心思想开始。
演示工具栏
演示工具栏将出现在演示显示模式的下方:
导航按钮:
从起点开始- 把主题置放在屏幕的中央及折叠分支。
如果您有很多可视的分支将被重置。
选择上一分支- 继续到上一分支。
选择下一分支 - 继续到下一分支。
放大/ 缩小 / 适合屏幕: 选择适合您的缩放等级。
退出: 退出演示。
暂停
任何时候您都可以使用W或B快键暂停您的演示。
W = 暂停并使用空白屏幕。
B = 暂停并使用黑色屏幕。
屏幕
如果您使用了双屏幕模式,一个将显示您的Mind Map,另一个就如下图:
里面包含了以下项目:
图表显示- 演示您的Mind Map(左边)。
时间显示您从第一个分支开始至今使用了多少时间。
笔记- D显示您当前分支的笔记(右边)。
时间显示您在当前分支停留了多少时间。
演示模式的快键
选择下一分支类似PowerPoint 功能:N, Page Up, 右箭
头, 下箭头, 空格键, Enter, 点击演示
选择上一分支类似PowerPoint 功能:P, Page Down, 左
箭头, 上箭头, Back Space
放大Ctrl = (PC) Cmd = (Mac)
缩小Ctrl - (PC) Cmd - (Mac)
适合屏幕Ctrl 9 (PC) Cmd 9 (Mac)
退出Escape, Alt-F4, Ctrl W (PC) Cmd W (Mac) 切换屏幕(只可用在双屏幕模式) F
黑屏幕暂停 B
白屏幕暂停W
巢状式:这个选项产生的试算表包含了阶层的巢状结构,以便分开计算每一个类别的总和。
最後选择‘储存後开启文件',便会在导出转存之後开启文件。
更多详情请查看我们网站里的转存成为表格文件快速指南。
这项功能不是每一个iMindMap版本都有提供,详细功能资料请参考功能列表看看您的版本是否包含这项功能。
导出到 OPML
您可将思维导图导出为 OPML 文件。
为此,单击"保存"图标旁的小箭头,选择导出 > OPML。
然后程序会将让您选择保存 OPML 文件的位置。
在计算机上浏览找到您想将文件导出到的位置,为导出文件输入名称并按"保存"。
单击"导出",iMindMap 将在指定位置创建思维导图的 OPML 文件
音频导出
思维导图中附带的所有音频注释都可被导出为单个的 .WAV 文件。
要将其导出,只需单击保存图标上的小箭头,选择"导出",然后选择"音频注释"。
然后选择您想将导出的音频文件保存于何处。
导出后音频文件的名称将是:取自其所在分支的文本加上分支的父级分支。
此文件名将有助于标识音频属于思维导图中的哪个分支。
在此过程中,如果有任何音频文件被分配相同的名称,那么文件名将添加一个数字以帮助区分文件。
导入Word文档
要把您的Word文档导入到一个新的Mind Map里,请确定您的文档使用了合适的结构。
iMindMap 是根据您Microsoft Word文档的标题分布到分支及笔记里。