外文文献翻译-LabVIEW程序框图设计
Labview简易程序设计

Labview简易程序设计Labview简易程序设计概述Labview(Laboratory Virtual Instrument Engineering Workbench)是一种用于虚拟仪器设计和控制系统的开发环境和语言。
它的特点是图形化的编程方式,使得用户无需编写繁琐的代码,就能够完成复杂的测量和控制任务。
本文将介绍Labview的简易程序设计方法。
Labview程序结构Labview程序由多个虚拟仪器(VI)组成,每个VI由输入、处理和输出三个核心部分组成。
输入部分负责从外部设备或传感器中获取数据,处理部分对输入数据进行计算和逻辑处理,输出部分将处理结果发送给外部设备或在界面中显示。
Labview程序的整体架构通常是基于数据流图(Block Diagram)的,其中各个VI之间通过数据流连接进行数据传递。
数据流连接将结果从一个VI的输出端传递到另一个VI的输入端,从而实现整个程序的协同工作。
Labview程序设计步骤1. 创建新的Labview程序打开Labview软件,“新建”按钮创建一个新的项目。
选择适当的模板或空项目来开始新的程序设计。
2. 添加VI在新建的项目中,右键“当前程序”文件夹,选择“新建”->“虚拟仪器”。
给新建的VI命名,并双击打开它。
3. 添加输入在VI的数据流图上,选择需要的输入控件或函数。
例如,可以添加一个“数字输入框”来接受用户输入的数值,或者添加一个“传感器读取”函数来获取外部设备的数据。
4. 添加处理在VI的数据流图上,选择需要的处理函数或操作。
例如,可以添加一个“加法”函数来对输入的两个数值进行求和,或者添加一个“循环结构”来进行重复计算。
5. 添加输出在VI的数据流图上,选择需要的输出控件或函数。
例如,可以添加一个“数字显示”控件来显示处理结果的数值,或者添加一个“数据保存”函数来将结果保存到文件中。
6. 连接数据流将输入、处理和输出部分通过数据流连接连起来,确保数据能够流动并得到正确的处理。
虚拟仪器_labview_课件PPT_第三章_前面板与程序框图

河南工业大学机电学院
第三章 前面板与程序框图
3.1
前面板控件
3.2
3.3
设置前面板对象的属性
前面板的修饰
第三章 前面板与程序框图
河南工业大学机电学院
3.1 前面板控件
界面的设计是完成一个完整任务的第一步。
要设计一个完美的界面,首先需要掌握软 件中各种控件的特性,还需要学会一些修 饰的技巧。
河南工业大学机电学院
6.列表框、树形控件和表格
第三章 前面板与程序框图
河南工业大学机电学院
7.下拉列表和枚举控件
第三章 前面板与程序框图
河南工业大学机电学院
8.容器控件
第三章 前面板与程序框图
河南工业大学机电学院
9.I/O控件
第三章 前面板与程序框图
河南工业大南工业大学机电学院
1.数值型控件
第三章 前面板与程序框图
河南工业大学机电学院
2.图形和图表
第三章 前面板与程序框图
河南工业大学机电学院
3.布尔型控件和单选按 钮
第三章 前面板与程序框图
河南工业大学机电学院
4.文本型控件
第三章 前面板与程序框图
河南工业大学机电学院
5.数组、矩阵和簇控件
第三章 前面板与程序框图
第三章 前面板与程序框图
河南工业大学机电学院
3.1 前面板控件
1.数值型控件 2.图形和图表 3.布尔型控件和单选按钮 4.文本型控件 5.数组、矩阵和簇控件 6.列表框、树形控件和表格 7.下拉列表和枚举控件 8.容器控件 9.I/O控件
系统控件是专门用于“创建的对话框中”
第三章 前面板与程序框图
第三章 前面板与程序框图
第二章 labview程序结构

第二章程序结构2.1循环结构2.1.1While 循环While 循环可以反复执行循环体的程序,直至到达某个边界条件。
它类似于普通编程语言中的 Do 循环。
While 循环的框图是一个大小可变的方框,用于执行框中的程序,直到条件端子接收到的布尔值为 FALSE。
该循环有如下特点:●计数从0开始(i=0)。
●先执行循环体,而后i+1,如果循环只执行一次,那么循环输出值i=0。
●循环至少要运行一次。
条件端子循环变量图2-1While 循环示意图练习2-1使用While循环和图表目的:用 While 循环和图表获得数据,并实时显示。
创建一个可以产生并在图表中显示随机数的VI。
前面板有一个控制旋钮可在0到10秒之间调节循环时间,还有一个开关可以中止VI的运行。
学习怎样改变开关的动作属性,以便不用每次运行VI时都要打开开关。
操作步骤如下:前面板图2-2练习2-1的前面板1.选择FileºNew,打开一个新的前面板。
2.选择ControlsºBoolean,在前面板中放置一个开关。
设置开关的标签为控制开关。
3.使用标签工具创建 ON 和 OFF 的标签,放置于开关旁。
4.选中ControlsºGraph,在前面板中放置一个波形图(是chart,而不是graph)。
设置它的标签为随机信号。
这个图表用于实时显示随机数。
5.把图表的纵坐标改为0.0 到 1.0。
方法是用标签工具把最大值从10.0改为1.0。
6.选择ControlsºNumeric,在前面板中放置一个旋钮。
设置旋钮的标签为循环延时。
这个旋钮用于控制While 循环的循环时间。
流程图7.开流程图,按照下图创建流程图。
图2-2练习2-1的流程图a.从FunctionsºStructures 中选择 While 循环,把它放置在流程图中。
将其拖至适当大小,将相关对象移到循环圈内。
b.从Functionsº Numeri c中选择随机数(0-1)功能函数放到循环内。
Labview外文翻译(带中文对照)(适用于毕业论文外文翻译+中英文对照)
LabVIEWLabVIEW is a highly productive graphical programming language for building data acquisition an instrumentation systems.With LabVIEW, you quickly create user interfaces that give you interactive control of your software system. To specify your system functionality,you simply assemble block diagrams - a natural design notation for scientists and engineers. Tis tight integration with measurement hardware facilitates rapid development of data acquisition ,analysis,and presentation bVIEW contains powerful built -in measurement analysis and a graphical compiler for optimum performance. LabVIEW is available for Windows 2000/NT/Me/9x, Mac OS, Linux, Sun Solaris, and HP-UX, and comes in three different development system options.Faster DevelopmentLabVIEW accelerates development over traditional programming by 4 to 10 times! With the modularity and hierarchical structure of LabVIEW, you can prototype ,design, and modify systems in a short amount of time. You can also reuse LabVIEW code easily and quickly in other applications.Better InvestmentUsing a Lab VIEW system, each user has access to a complete instrumentation laboratory at less than the cost of a single commercial instrument. In addition, user configurable LabVIEW systems are flexible enough to adapt to technology changes, resulting in a better bong-term investment.Optimal PerformanceAll LabVIEW applications execute at compiled speed for optimal performance. With the LabVIEW Professional Development System or Application Builder, you can build stand-alone executables or DLLs for secure distribution of your code. You can even create shared libraries or DLLs to call LabVIEW code from other programming languages.Open Development EnvironmentWith the open development environment of LabVIEW, you can connect to other applications through ActiveX, the Web, DLLs, shared libraries, SQL(for databases), DataSocket, TCP/IP,and numerous other e LabVIEW to quickly create networked measurement and automation systems that integrate the latest technologies in Web publishing and remote data sharing. LabVIEW also has driver libraries available for plug-in data acquisition, signal conditioning , GPIB,VXI,PXI, computer-based instruments,serial protocols, image acquisition, and motion control. In addition to the LabVIEW development systems, National Instruments offers a variety of add-on modules and tool sets that extend the functionality of LabVIEW .This enables you to quickly build customizable, robust measurement and automation systems.LabVIEW Datalogging and Supervisory Control ModuleFor high channel count and distributed applications, the LabVIEW Datelogging and Supervisory Control Module provides a complete solution. This module delivers I/O management, event logging and alarm management, distributed logging, historical and real-time trending, built-in security, configurable networking features, OPC device connectivity, and over 3,300 built-in graphics.LabVIEW Real-TimeFor applications that require real-time performance, National Instruments offers LabVIEW Real-Time. LabVIEW Real-Time downloads standard LabVIEW code to a dedicated hardware target running a real-time operating system independent from Windows.LabVIEW Vision Development ModuleThe LabVIEW Vision Development Module is for scientists, automation engineers,and technicians who are developing LabVIEW machine vision and scientific imaging applications. The LabVIEW Vision Development Module includes IMAQ Vision, a library of vision functions, and IMAQ Vision Builder, an interactive environment for vision applications. Unlike any other vision products, IMAQ Vision Builder and IMAQ Vision work together to simplify vision software development so that you can apply vision to your measurement and automation applications.Countless ApplicationsLabVIEW applications are implemented in many industries worldwide including automotive, telecommunications, aerospace, semiconductor, electronic design and production, process control, biomedical, and many others, Applications cover all phases of product development from research to design to production and to service. By leveraging LabVIEW throughout your organization you can save time and money by sharing information and software.Test and MeasurementLabVIEW has become an industry-standard development tool for test and measurement applications. With Test Stand, LabVIEW-based test programs, and the industry's largest instrument driver library, you have a single, consistent development and execution environment for your entire system.Process Control and Factory AutomationLabVIEW is used in numerous process control and factory automation applications.Many scientists and engineers look to LabVIEW for the high speed, high channel count measurement and control that graphical programming offers.For large, complex industrial automation and control applications, the LabVIEW Data logging and Supervisory Control Module provides the same graphical programming as LabVIEW, but is designed specifically for monitoring large numbers of I/O points, communicating with industrial controllers and networks, and providing PC-based control.Machine Monitoring and ControlLabVIEW is ideal for machine monitoring and predictive maintenance applications that need deterministic control, vibration analysis, vision and image processing, and motion control. With the LabVIEW platform of products including LabVIEW Real-Time for real-time deterministic control and the LabVIEW Data logging and Supervisory Control Module, scientists and engineers can create powerful machine monitoring and control applications quickly and accurately.Research and AnalysisThe integrated LabVIEW measurement analysis library provides everything you need in an analysis package. Scientists and researchers have used LabVIEW to analyse and compute real results for biomedical, aerospace, and energy research applications, and in numerous other industries. The available signal generation and processing, digital filtering, windowing, curve-fitting, For specialized analysis, such as joint time-frequency analysis, wavelet,and model-based spectral analysis, LabVIEW offers the specially designed Signal ProcessingToolset.The Sound and Vibration Toolset offers octave analysis, averaged and nonaveraged frequency analysis, transient analysis, weighted filtering, and sound-level measurement, and more.Draw Your Own SolutionWith LabVIEW, you build graphical programs called virtual instruments (VIs) instead of writing text-based programs. You quickly create front panel user interfaces that give you the interactive control of your system. To add functionality to the user interface, you intuitively assemble block diagrams- a natural design notation for engineers and scientists.Create the Front PanelOn the front panel of your VI, you place the controls and data displays for your system by selecting ob jects from the Controls palette, such as numeric displays, meters, gauges, thermometers, LEDs, charts,and graphs.When you complete and run your VI,you use the front panel to control your system whether you move a slide, zoom in on a graph, or enter a value with the keyboard.Construct the Graphical Block DiagramTo program the VI, you construct the block diagram without worrying about the syntactical details of text-based programming languages. You do this by selecting objects (icons) from the Functions palette and connecting them together with wires to transfer data among block diagram objects. These objects include simple arithmetic functions, advanced acquisition and analysis routines, network and file I/O operations, and more.Dataflow ProgrammingLabVIEW uses a patented dataflow programming model that frees you from the linear architecture of text-based programming languages. Because the execution order in LabVIEW is determined by the flow of data between nodes,and not by sequential lines of text,you can create block diagrams that execute multiple operations in parallel. Consequently, LabVIEW is a multitasking system capable of running multiple execution threads and multiple VIs in parallel.Modularity and HierarchyLabVIEW VIs are modular in design, so any VI can run by itself or as part of another VI. You can even create icons for your own VIs, so you can design a hierarchy of VIs that serve as application building blocks. You can modify, interchange, and combine them with other VIs to meet your changing application needs.Graphical CompilerIn many applications, execution speed is critical. LabVIEW is the only graphical programming system with a compiler that generates optimized code with execution speeds comparable to compiled C programs. You can even use the LabVIEW profiler to analyse and optimize time-critical operations. Consequently, you increase your productivity with graphical programming without sacrificing execution speed.Measurements and MathematicsLabVIEW includes a variety of other measurement analysis tools. Examples include curve fitting, signal generation, peak detection, and probability and statistics. Measurement analysis functions can determine signal characteristics such as DC/RMS levels, total harmonic distortion (THD),impulse response, frequency response, and cross-power spectrum. LabVIEW users can also deploy numerical tools for solving differential equations, optimization, root finding, and other mathematical problems.In addition, you can extend these built-in capabilities by entering MATLAB or HIQ scripts directly in your LabVIEW programs. For charting and graphing, you canrely on the built-in LabVIEW 2D and 3D visualization tools. 2D tools include features such as autoscaling X and Y ranges, reconfigurable attributes (point/line styles, colors, and more)and cursors, Microsoft Windows users can employ OpenGL-based 3D graphs and then dynamically rotate, zoom, and pan these graphs with the mouse.Development SystemThe LabVIEW Professional Development System facilitates the development of high-end, sophisticated instrumentation systems for developers working in teams, users developing large suites of VIs, or programmers needing to adhere to stringent quality standards.Built on the Full Development System, the Professional Development System also includes the LabVIEW Application Builder for building stand-alone executables and shared libraries (DLLs)and creating distribution kits. In addition, the development system furnishes source code control tools and offers utilities for quantitatively measuring the complexity of your applications. With graphical differencing, you can quickly identify both cosmetic and functional differences between two LabVIEW applications.We include programming standards and style guides that provide direction for consistent LabVIEW programming methodology. The system also contains quality standards documents that discuss the steps LabVIEW users must follow to meet internal regulations or FDA approval. The Professional Development System operates on Windows 2000/NT/Me/9x,Mac OS, HP-UX, and Linux.LabVIEW Full Development SystemThe LabVIEW Full Development System equips you with all of the tools you need to develop instrumentation systems. It includes GPIB, VISA, VXI, RS-232, DAQ, and instrument driver libraries for data acquisition and instrument control. The measurement analysis add DC/RMS measurements, single tone analysis, harmonic distortion analysis, SINAD analysis, limit testing, signal generation capabilities, signal processing, digital filtering, windowing, curve fitting, statistics, and a myriad of linear algebra and mathematical functions. The development system also provides functions for direct access to DLLs, ActiveX, and other external code. Other features of the system include Web publishing tools, advanced report generation tools, the ability to call MATLAB and HiQ scripts, 3D surface, line, and contour graphs, and custom graphics and animation. The Full Development System operates on Windows 2000/NT/Me/9x, Mac OS, HP-UX, and Linux.LabVIEW Base PackageUse the LabVIEW Base Package, the minimum LabVIEW configuration, for developing data acquisition and analysis, instrument control, and basic data presentation. The Base Package operates on Windows 2000/NT/Me/9x.Debug License for LabVIEWIf you deploy LabVIEW applications, including LabVIEW tests for use with Test Stand, the debug license allows you to install the LabVIEW development system on the target machines so you can step into your test code for complete test debugging. This license is not intended for program development.虚拟仪器(LabVIEW)虚拟仪器是一种高效用于构建数据采集与监测系统图形化编程语言。
LabVIEW程序设计步骤知识分享
L a b V I E W程序设计步骤LabVIEW程序设计步骤下面通过一个设计实例来详细介绍虚拟仪器软件LabVIEW的程序设计步骤。
设计目标:假设有一台仪器,需要调整其输入电压,当调整电压超过某一设定电压值时,需通过指示灯颜色变化发出警告。
1 建立新VI启动LabVIEW程序,单击VI按钮,建立一个新VI程序。
这时将同时打开LabVIEW的前面板和后面板(框图程序面板)。
在前面板中显示控件选板,在后面板中显示函数选板。
在两个面板中都显示工具选板。
如果选板没有被显示出来,可以通过菜单查看(View)/工具选板(Tools Palette)来显示工具选板,通过查看(View)/控件选板(Controls Palette)显示控件选板,通过查看(View)/函数选板(Functions Palette)显示函数选板。
也可以在前面板的空白处,单击鼠标右键,以弹出控件选板。
2 前面板设计输入控制和输出显示可以从控件选板的各个子选板中选取。
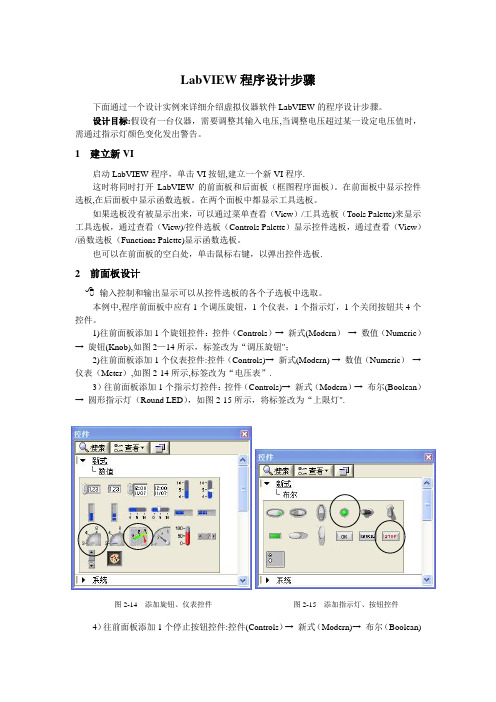
本例中,程序前面板中应有1个调压旋钮,1个仪表,1个指示灯,1个关闭按钮共4个控件。
1)往前面板添加1个旋钮控件:控件(Controls)→新式(Modern)→ 数值(Numeric)→旋钮(Knob),如图2-14所示,标签改为“调压旋钮”;2)往前面板添加1个仪表控件:控件(Controls)→新式(Modern)→数值(Numeric)→仪表(Meter),如图2-14所示,标签改为“电压表”。
3)往前面板添加1个指示灯控件:控件(Controls)→新式(Modern)→布尔(Boolean)→圆形指示灯(Round LED),如图2-15所示,将标签改为“上限灯”。
图2-14 添加旋钮、仪表控件图2-15 添加指示灯、按钮控件4)往前面板添加1个停止按钮控件:控件(Controls )→ 新式(Modern )→ 布尔(Boolean ) → 停止按钮(Stop Button ),如图2-15所示,将标签改为“关闭”。
LabVIEW程序设计步骤
LabVIEW 程序设计步骤下面通过一个设计实例来详细介绍虚拟仪器软件LabVIEW 的程序设计步骤。
设计目标:假设有一台仪器,需要调整其输入电压,当调整电压超过某一设定电压值时,需通过指示灯颜色变化发出警告。
1 建立新VI启动LabVIEW 程序,单击VI 按钮,建立一个新VI 程序.这时将同时打开LabVIEW 的前面板和后面板(框图程序面板)。
在前面板中显示控件选板,在后面板中显示函数选板。
在两个面板中都显示工具选板。
如果选板没有被显示出来,可以通过菜单查看(View )/工具选板(Tools Palette)来显示工具选板,通过查看(View)/控件选板(Controls Palette )显示控件选板,通过查看(View )/函数选板(Functions Palette)显示函数选板。
也可以在前面板的空白处,单击鼠标右键,以弹出控件选板.2 前面板设计输入控制和输出显示可以从控件选板的各个子选板中选取。
本例中,程序前面板中应有1个调压旋钮,1个仪表,1个指示灯,1个关闭按钮共4个控件。
1)往前面板添加1个旋钮控件:控件(Controls )→ 新式(Modern ) → 数值(Numeric ) → 旋钮(Knob),如图2—14所示,标签改为“调压旋钮";2)往前面板添加1个仪表控件:控件(Controls)→ 新式(Modern) → 数值(Numeric ) → 仪表(Meter ),如图2-14所示,标签改为“电压表”.3)往前面板添加1个指示灯控件:控件(Controls)→ 新式(Modern )→ 布尔(Boolean ) → 圆形指示灯(Round LED ),如图2-15所示,将标签改为“上限灯".4)往前面板添加1个停止按钮控件:控件(Controls )→ 新式(Modern)→ 布尔(Boolean) 图2-15 添加指示灯、按钮控件图2-14 添加旋钮、仪表控件→停止按钮(Stop Button),如图2-15所示,将标签改为“关闭”。
LabVIEW程序设计与虚拟仪器之程序结构ppt文档

While循环可以进行嵌套。 【例2.1】 使用While循环每0.5秒显示一个随机数和循环 次数,最后波形显示所有随机数序列。 VI的前面板和程序框图如图2-2所示,While循环条件端子 与布尔开关对象相连,只要开关状态为“关”,程序重复执行, 直到条件端子为“开”,停止循环。While循环框内放置一个 随机数对象和Time Delay Express VI,每0.5秒循环一次,在前 面板显示随机数和循环次数,最后利用While循环的自动索引 功能将随机数序列通过波形显示出来,可以看到,波形的横坐 标表示循环次数,当循环次数为115时,随机数加1是1.38577。
图2-6 例2.2的前面板和程序框图
2.1.3 For循环 For循环位于Functions→Structures子模板上。 For循环有两个固定的数据端子,分别是计数端子(Loop
Count)和重复端子(Loop Iteration),如图2-8所示。其中计数端 子连接整型数值,指定循环次数;重复端子输出已经执行循环 的次数,循环次数默认从“0”开始计数,依次增加“1”。
LabVIEW程序设计与虚拟仪器之程序结构
LabVIEW程序设计与虚拟仪器之程序结构
本章将系统介绍LabVIEW提供的程序结构,包括While Loop(While循环)、For Loop(For循环)、Shift Register(移位寄存 器)、Case Structure(分支结构)、Sequence Structure(顺序结构)、 Formula Node(公式节点)等。
2.1 循 环 结 构
在LabVIEW中有While循环 和 For循环 两种循环结构。二
者的区别是:While循环只要满足循环退出的条件则退出相应 的循环,否则变成死循环;而For循环是预先确定循环次数, 当循环体运行完指定的次数后自动退出循环。 2.1.1 While循环
LabView程序设计的一般过程
1.找出语法错误 如果一个VI程序存在语法错误,则在面板工具条上的运行按钮会变成一个
折断的箭头,表示程序不能被执行。这时该按钮被称作错误列表。在这它, 则LabVIEW弹出错误清单窗口,在这其中任何一个所列出的错误,选用Find 功能,则出错的对象或端口就会变成高亮。 2.设置执行程序高亮
v
step over是在单步执行时,在函数内遇到子函 数时不会进入子函数内单步执行,而是将子函 数整个执行完再停止,也就是把子函数整个作 为一步。
v
step out就是单步执行时,用step out就可以执 行完程序余下部分,并返回。
On the evening of July 24, 2021
Courseware template
可用探针工具来查看当流程图程序流经某一根连接线时的数据值。从Tools工 具模板选择探针工具,再用鼠标左键在这你希望放置探针的连接线。这时显示器 上会出现一个探针显示窗口。该窗口总是被显示在前面板窗口或流程图窗口的上 面。在流程图中使用选择工具或连线工具,在连线上在这鼠标右键,在连线的弹 出式菜单中选择探针命令,加上一个探针同样可以为该连线。
Courseware template
LabVIEW程序调试技术
3.断点与单步执行 为了查找程序中的逻辑错误,有时希望流程图程序一个节点一个节点地执行。
使用断点工具可以在程序的某一地点中止程序执行,用探针或者单步方式查看数 据。使用断点工具时,在这你希望设置或者清除断点的地方。断点的显示对于节 点或者图框表示为红框,对于连线表示为红点。当VI程序运行到断点被设置处, 程序被暂停在将要执行的节点,以闪烁表示。按下单步执行按钮,闪烁的节点被 执行,下一个将要执行的节点变为闪烁,指示它将被执行。你也可以在这暂停按 钮,这样程序将连续执行直到下一个断点。 4.探针
通信类外文文献翻译
使用LabVIEW中的TCP/IP和UDP协议前言互联网络协议(IP),用户数据报协议(UDP)和传输控制协议(TCP)是网络通信的基本的工具。
TCP与IP的名称来自于一组最著名的因特网协议中的两个--传输控制协议和互联网络协议。
你能使用TCP/IP来进行单一网络或者互连网络间的通信。
单独的网络会被大的地理距离分隔。
TCP/IP把数据从一个子网网络或者因特网连接的计算机发送到另一个上。
因为TCP/IP 在大多数计算机上是可用的,它能在多样化的系统中间传送信息。
LabVIEW和TCP/IP你能在所有平台上的LabVIEW中使用TCP/IP。
LabVIEW包含了TCP和UDP程序还有能让你建立客户端或者服务器程序的功能。
IPIP执行低层次的计算机间的数据传送。
在组成部分里的IP数据包称为数据报。
一个数据报包含表明来源和目的地地址的数据和报头字。
IP为通过网络或者因特网把数据发送到指定的目的地的数据报确定正确的路径。
IP协议并不能保证发送。
事实上,如果数据报在传输中被复制,IP可能多次传送一个单独的数据报。
所以,程序很少用IP而是用TCP或者UDP代替。
UDPUDP在计算机进程中提供简单而低层次的通信。
进程通过把数据报发送到一个目的地计算机或者端口进行通信。
一个端口是你发送数据的位置。
IP处理计算机对计算机的发送。
在数据报到达目的地计算机后,UDP把数据报移动到其目的端口。
如果目的端口不是开放的,UDP 将删除数据报。
UDP将发生IP的同样的发送问题。
应用程序的UDP的可靠性不强。
例如,一项应用程序能经常把大量信息的数据传送到目的地而丢失少量的数据是肯定的。
在LabVIEW中使用UDP协议因为UDP不是一个TCP似的一个以连接为基础的协议,在你发送或者收到数据之前,你不需要和目的地建立一种连接。
相反,当你每发送一个数据报时,由你指定数据目的地。
操作系统不会报告传输差错使用UDP打开功能在一个端口上打开一个UDP插口。
Labview图形化编程语言中英文对照外文翻译文献
Labview图形化编程语⾔中英⽂对照外⽂翻译⽂献中英⽂资料外⽂翻译National Instruments LabVIEW: A Programming Environment for Laboratory Automation and Measurement .National Instruments LabVIEW is a graphical programming language that has its roots in automation control and data acquisition. Its graphical representation, similar to a process flow diagram, was created to provide an intuitive programming environment for scientists and engineers. The language has matured over the last 20 years to become a general purpose programming environment. LabVIEW has several key features which make it a good choice in an automation environment. These include simple network communication, turnkey implementation of common communication protocols (RS232, GPIB, etc.), powerful toolsets for process control and data fitting, fast and easy user interface construction, and an efficient code execution environment. We discuss the merits of the language and provide an example application suite written in-house which is used in integrating and controlling automation platforms.Keywords: NI LabVIEW; graphical programming; system integration; instrument control; component based architecture; robotics; automation; static scheduling; dynamic scheduling; databaseIntroductionCytokinetics is a biopharmaceutical company focused on the discovery of small molecule therapeutics that target the cytoskeleton. Since inception we have developed a robust technology infrastructure to support our drug discovery efforts. The infrastructure provides capacity to screen millions of compounds per year in tests ranging from multiprotein biochemical assays that mimic biological function to automated image-based cellular assays with phenotypic readouts. The requirements for processing these numbers and diversity of assays have mandated deployment of multiple integrated automation systems. For example, we have several platforms for biochemical screening, systems for live cell processing, automated microscopy systems, and an automated compound storage and retrieval system. Each in-house integrated system is designed around a robotic arm and contains an optimal set of plate-processing peripherals (such as pipetting devices, plate readers, and carousels) depending on its intended range of use. To create the most flexible, high performance, and cost-effective systems, we have taken the approach of building our own systems in-house. This has given us the ability to integrate the most appropriate hardware and software solutions regardless of whether they are purchased from a vendor or engineered de novo, and hence we can rapidly modify systems as assay requirements change.To maximize platform consistency and modularity, each of our 10 automated platforms is controlled by a common, distributed application suite that we developed using National Instruments (NI) LabVIEW. This application suite described in detail below, enables our end users to create and manage their own process models (assayscripts) in a common modeling environment, to use these process models on any automation system with the required devices, and allows easy and rapid device reconfiguration. The platform is supported by a central Oracle database and can run either statically or dynamically scheduled processes.NI LabVIEW BackgroundLabVIEW, which stands for Laboratory Virtual Instrumentation Engineering Workbench is a graphical programming language first released in 1986 by National Instruments (Austin, TX). LabVIEW implements a dataflow paradigm in which the code is not written, but rather drawn or represented graphically similar to a flowchart diagram Program execution follows connector wires linking processing nodes together. Each function or routine is stored as a virtual instrument (VI) having three main components: the front panel which is essentially a form containing inputs and controls and can be displayed at run time, a block diagram where the code is edited and represented graphically, and a connector pane which serves as an interface to the VI when it is imbedded as a sub-VI.The top panel (A) shows the front panel of the VI. Input data are passed through “Controls” which are shown to the left. Included here are number inputs, a file path box, and a general error propagation cluster. When the VI runs, the “Indicator”outputs on the right of the panel are populated with output data. In this example, data include numbers (both as scalar and array), a graph, and the output of the error cluster. In the bottom panel (B) the block diagram for the VI is shown. The outer case structure executes in the “No Error” case (VIs can make internal errors o r if called as a sub-VI the caller may propagate an error through the connector pane).Unlike most programming languages, LabVIEW compiles code as it is created thereby providing immediate syntactic and semantic feedback and reducing the time required for development and testing.2Writing code is as simple as dragging and droppingfunctions or VIs from a functions palette onto the block diagram within process structures (such as For Loops, or Case Structures) and wiring terminals (passing input values, or references). Unit testing is simplified because each function is separately encapsulated; input values can be set directly on the front panel without having to test the containing module or create a separate test harness. The functions that generate data take care of managing the storage for the data.NI LabVIEW supports multithreaded application design and executes code in an inherently parallel rather than sequential manner; as soon as a function or sub-VI receives all of its required inputs, it can begin execution. In Figure 1b, all the sub-VIs receive the array input simultaneously as soon as the For Loop is complete, and thus they execute in parallel. This is unique from a typical text-based environment where the control flows line by line within a function. When sequential execution is required, control flow can be enforced by use of structures such as Sequences, Events, or by chaining sub-VIs where output data from one VI is passed to the input of the next VI.Similar to most programming languages, LabVIEW supports all common data types such as integers, floats, strings, and clusters (structures) and can readily interface with external libraries, ActiveX components, and .NET framework. As shown in Figure 1b, each data type is graphically represented by wires of different colors and thickness. LabVIEW also supports common configuration management applications such as Visual SourceSafe making multideveloper projects reasonable to manage.Applications may be compiled as executables or as Dynamic Link Libraries (DLLs) that execute using a run-time engine similar to the Java Runtime Environment. The development environment provides a variety of debugging tools such as break-points, trace (trace), and single-step. Applications can be developed using a variety of design patterns such as Client-Server, Consumer-Producer, andState-Machine. There are also UML (Unified Modeling Language) modeling tools that allow automated generation of code from UML diagrams and state diagrams.Over the years, LabVIEW has matured into a general purpose programming language with a wider user base.NI LabVIEW as a Platform for Automation and InstrumentationOur experience creating benchtop instrumentation and integrated automation systems has validated our choice of LabVIEW as an appropriate tool. LabVIEW enables rapid development of functionally rich applications appropriate for both benchtop applications and larger integrated systems. On many occasions we have found that project requirements are initially ill defined or change as new measurements or new assays are developed.. There are several key features of the language that make it particularly useful in an automation environment for creating applications to control and integrate instrumentation, manage process flow, and enable data acquisition.Turnkey Measurement and Control FunctionLabVIEW was originally developed for scientists and engineers .The language includes a rich set of process control and data analysis functions as well as COM, .NET, and shared DLL support. Out of the box, it provides turnkey solutions to a variety of communication protocols including RS232, GPIB, and TCP/IP. Control structures such as timed While Loops allow synchronized and timed data acquisition from a variety of hardware interfaces such as PCI, USB, and PXI. DataSocket and VI ServerDeployment of an integrated system with multiple control computers requires the automation control application to communicate remotely with instrument drivers existing on remote computers. LabVIEW supports a distributed architecture by virtue of enabling seamless network communication through technologies such as VI Server and DSTP (data sockets transfer protocol). DSTP is an application layer protocol similar to http based on Transmission Control Protocol/Internet Protocol (TCP/IP). Data sockets allow easy transfer of data between remote computers with basic read and write functions. Through VI server technology, function calls can be made to VIs residing on remote computers as though they are residing on the local computer. Both Datasockets and VI server can be configured to control accesses privileges.Simple User Interface (UI) ImplementationIn addition to common interface controls such as text boxes, menu rings, and check-boxes, LabVIEW provides a rich set of UI controls (switches, LEDs, gauges, array controls, etc.) that are pertinent to laboratory equipment. These have their origins in LabVIEWs laboratory roots and help in development of interfaces which give scientists a clear understanding of a system's state. LabVIEW supports UI concepts including subpanels (similar to the Multiple Document Interface), splitter bars, and XControls (analogous to OCX controls).Multithreaded Programming EnvironmentThe inherent parallel environment of LabVIEW is extremely useful in the control of laboratory equipment. Functions can have multiple continuous While Loops where one loop is acquiring data rapidly and the other loop processes the data at a much slower rate. Implementing such a paradigm in other languages requires triggering an independent function thread for each process and developing logic to manage synchronization. Through timed While Loops, multiple independent While Loops can be easily synchronized to process at a desired period and phase relative to one another. LabVIEW allows invoking multiple instances of the same function witheach maintaining its own data space. For instance, we could drag many instances of the Mean sub-VI onto the block diagramin Figure 1b and they would all run in parallel, independent of one another. To synchronize or enforce control flow within the dataflow environment, LabVIEW also provides functions such as queues, semaphores, and notification functions.NI LabVIEW Application Example: The Open System Control Architecture (OSCAR)OSCAR is a LabVIEW-based (v7.1) automation integration framework and task execution engine designed and implemented at Cytokinetics to support application development for systems requiring robotic task management. OSCAR is organized around a centralized Oracle database which stores all instrumentation configuration information used to logically group devices together to create integrated systems (Fig. 2). The database also maintains Process Model information from which tasks and parameters required to run a particular process on a system can be generated and stored to the database. When a job is started, task order and parameter data are polled by the Execution Engine which marshals tasks to each device and updates task status in the database in real time. Maintaining and persisting task information for each system has two clear benefits. It allows easy job recovery in the event of a system error, and it also provides a process audit trail that can be useful for quality management and for troubleshooting process errors or problems.Each OSCAR component is distributed across the company intranet and communicates with a central database. Collections of physical devices controlled through OSCAR Instrument packages (OIP) make up systems. Users interact with systems through one of the several applications built on OSCAR. Each application calls the RTM which marshals tasks from the database to each OIP. OSCAR has sets of tools for managing system configurations, creating Process Models, monitoring running processes, recovering error-state systems, and managing plate inventory in storage devices.OSCAR uses a loosely coupled distributed component architecture, enabled in large part by LabVIEWs DSTP and remote VI technologies that allow system control to be extended beyond the confines of the traditional central control CPU model. Any networked computer or device can be integrated and controlled in an OSCAR system regardless of its physical location. This removes the proximity constraints of traditional integrated systems and allows for the utilization of remote data crunchers, devices, or even systems. The messaging paradigm used shares many similarities with current Service Oriented Architectures or Enterprise Service Bus implementations without a lot of required programming overhead or middleware; a centralized server is not required to direct the XML packets across the network. An additional benefit to this loosely coupled architecture is the flexibility in front-end application design. OSCAR encapsulates and manages all functionality related to task execution and device control, which frees the developer to focus on the unique requirements of a given application. For example, an application being created for the purpose of compound storage and retrieval can be limited in scope to requirements such as inventory management and LIMS integration rather than device control, resource allocation, and task synchronization.The OSCAR integration framework consists of multiple components that enable device and system configuration, process modeling, process execution, and process monitoring. Below are descriptions of key components of the framework. Integration PlatformThe Oscar Instrument Package (OIP) is the low level control component responsible for communicating with individual devices. It can support any number of devices on a system (including multiple independent instances of the same type of device) and communicates to the Runtime Manager (RTM) via serialized XMLstrings over DSTP. This allows the device controller and RTM components to exist on separate networked computers if necessary. Additionally, the OIP controller communicates with a device instance via LabVIEW remote VI calls which provide a lower level of distribution and allow the device drivers to exist on a separate networked computer from the controller. At Cytokinetics, we currently support approximately 100 device instances of 30 device types which are distributed across 10 integrated systems.System ManagementAn OSCAR system is a named collection of device instances which is logically represented in the database. The interface for each device (commands and parameters) is stored in the database along with the configuration settings for each device instance (i.e., COM port, capacity). The System Manager component provides the functionality to easily manipulate this information (given appropriate permissions). When a physical device is moved from one system to another, or a processing bottleneck alleviated by addition of another similar device, system configuration information is changed without affecting the processes that may be run on the system.Process ModelingA process model is the logical progression of a sequence of tasks. For example, a biochemical assay might include the following steps (1) remove plate from incubator, (2) move plate to pipettor, (3) add reagent, (4) move plate to fluorescent reader, (5) read plate, and (6) move plate to waste. The Process Modeler component allows the end user to choose functions associated with devices and organize them into a sequence of logical tasks. The resulting process model is then scheduled via a static schedule optimization algorithm or saved for dynamic execution (Fig. 3). Aprocess model is not associated with a physical system, but rather a required collection of devices. This has two importantbenefits: (1) the scientist is free to experiment with virtual system configurations to optimize the design of a future system or the reconfiguration of an existing system, and (2) any existing process model can be executed on any system equipped with the appropriate resources.The top panel (A) shows the Process Schedule Modeler, an application that graphically displays statically scheduled processes. Each horizontal band represents a task group which is the collection of required tasks used by a process; tasks are color coded by device. The bottom panel (B) shows the UI from the Automated Imaging System application. The tree structure depicts the job hierarchy for an imaging run. Jobs (here AIS_Retrieval and AIS_Imaging) are composed of task groups. As the systems runs, the tasks in the task group are executed and their status is updated in the database.Process ExecutionProcess execution occurs by invoking the OSCAR RTM. The RTM is capable of running multiple differing processes on a system at the same time allowing multiple job types to be run in parallel. The RTM has an application programming interface (API) which allows external applications to invoke its functionality and consists of two main components, the Task Generator Module (TGM) and the Execution Engine. External applications invoke an instance of a Process Model through the TGM at which point a set of tasks and task parameters are populated in the OSCAR database. The Execution Engine continually monitors the database for valid tasks and if a valid task is found it is sent to the appropriate device via the OIP. The OSCAR system supports running these jobs in either a static or dynamic mode. For processes which must meet strict time constraints (often due to assay requirements), or require the availability of a given resource, a static schedule is calculated and stored for reuse.The system is capable of optimizing the schedule based on actual task operation times (stored in the database).Other types of unconstrained processes benefit more from a dynamic mode of operation where events trigger the progress of task execution as resources become available in real-time. When operating dynamically, intelligent queuing of tasks among multiple jobs allows optimal use of resources minimizing execution time while allowing for robust error handling.Process MonitoringAll systems and jobs can be monitored remotely by a distributed application known as the Process Monitor. This application allows multiple users to monitor active jobs across all systems for status and faults and provides email notification for fault situations.ConclusionCytokinetics has built and maintains an automation software infrastructure using NI LabVIEW. The language has proven to be a powerful tool to create both rapid prototype applications as well as an entire framework for system integration and process execution. LabVIEW's roots in measurement instrumentation and seamless network communication protocols have allowed systems to be deployed containing multiple control computers linked only via the network. The language continues to evolve and improve as a general purpose programming language and develop a broad user base.。
Labview简易程序设计
Labview简易程序设计1.引言本文档旨在提供关于LabVIEW简易程序设计的详细教程。
LabVIEW(Laboratory Virtual Instrument Engineering Workbench)是一款流行的图形化编程语言和开发环境,用于快速开发各种控制、测量和数据采集应用程序。
通过本文档,读者将学习如何使用LabVIEW进行基本的程序设计和开发。
2.环境准备在开始使用LabVIEW进行程序设计之前,您需要准备以下环境:2.1.安装LabVIEW开发环境:并安装LabVIEW最新版本,根据操作系统选择32位或64位版本。
2.2.硬件设备:连接需要控制或采集数据的硬件设备,如传感器、运动控制器等。
2.3.了解LabVIEW界面:学习基本的LabVIEW界面元素,如面板(Front Panel)和图表(Block Diagram)等。
bVIEW基础在本章节中,将介绍LabVIEW的基本概念和基本操作:3.1.程序结构:LabVIEW程序的基本结构,包括面板和图表的布局。
3.2.数据流编程:学习LabVIEW的数据流程图编程方式,理解数据流和控制流的概念。
3.3.数据类型和变量:LabVIEW中的数据类型以及如何创建和使用变量。
3.4.控制结构:学习条件语句、循环结构和事件结构的使用方法。
3.5.函数和VI:了解LabVIEW的函数和虚拟仪器(Virtual Instrument)的概念,学习如何使用和创建自定义VI。
4.数据采集与处理本章介绍LabVIEW的数据采集与处理功能:4.1.设备驱动程序:了解如何安装和配置硬件设备的驱动程序。
4.2.仪器控制:学习如何使用LabVIEW控制仪器进行数据采集和输出控制。
4.3.数据采集:介绍如何使用LabVIEW进行数据采集,包括模拟信号和数字信号的采集。
4.4.数据处理:学习LabVIEW中常用的数据处理方法,如平滑、滤波、数字信号处理等。
5.图形界面设计本章介绍LabVIEW的图形界面设计功能:5.1.面板设计:学习如何设计具有用户交互界面的LabVIEW面板。
3.1.2 程序框图_LabVIEW 虚拟仪器程序设计从入门到精通_[共2页]
![3.1.2 程序框图_LabVIEW 虚拟仪器程序设计从入门到精通_[共2页]](https://img.taocdn.com/s3/m/630d340480eb6294dd886cf3.png)
LabVIEW虚拟仪器程序设计从入门到精通
前面板主要由输入控件和输出显示器组成。
输入控件模拟典型的输入对象,比如仪表盘、旋钮和开关等。
控件的作用是输入数据,向VI的程序框图提供数据。
输出显示器是程序框图经过运行处理后产生的输出数据信息。
更为形象地说,前面板类似用户接口。
新建VI前面板会出现一个小小的控件窗口,如图3-2所示。
若不小心关闭了控件窗口,可以在VI前面板的查看菜单栏的控件选板中重新打开。
从控件窗口中选定控件或显示器,放置到前面板,如图3-3所示,根据程序的需要,可调整控件大小、颜色、位置等属性。
图3-2 控件窗口图3-3 将控件放置到前面板
3.1.2 程序框图
程序框图表示LabVIEW的程序代码,即可执行代码。
程序框图主要由3个部件组成:端子、节点和连线。
图3-4所示为两个数相加的程序,程序框图看起来非常直观,而且很容易操作。
图3-4 两个数相加的程序
编写图3-4所示的程序需要经过以下几个步骤。
●从前面板控件窗口的新式>>数值子选项卡中选择数值输入控件放入前面板,打开程序框
图,可以看到LabVIEW自动在框图中创建了对应的端子“数值”,再创建“数值2”。
从数值子选项卡中选择数值显示控件放入前面板,在程序框图中会创建对应的端子“数值3”。
●从程序框图的函数选项卡函数>>数值子选项卡中选择加函数,放入程序框图中,将“数值”
与“数值2”与加函数的输入点相连,“数值3”与加函数的输出点连接。
●保存该函数为add.vi。
26。
准确的说,什么是LabVIEW,它又能为我做什么呢? 毕业论文外文文献翻译
本科毕业设计(论文)外文翻译译文:准确的说,什么是LabVIEW,它又能为我做什么呢?每个人的LabVIEWLabVIEW是Laboratory Virtual Instrument Engineering Workbench的英文缩写,它是一种图形化的编程环境,使用图形化的符号来创建程序(通过连线把函数节点连接起来,数据就是在这些连线上流动的);在这点上,它不同于传统的文本编程语言像C,C++,或者Java。
然而,LabVIEW不仅仅是一种编程语言,它是专门为那些工作中需要大量编程的工作的工程师和科学家们设计的一种交互式程序开发和执行的系统。
LabVIEW开发环境可以工作在装有windows,mac os x,或linu任何一种操作系统的计算机上。
LabVIEW创建的程序可以在上述平台上运行,同时也可以运行于microsoft pocket pc,mocrosoft windows ce,palm os和大量的嵌入式平台,包括现场可编程门阵列(FPGAs),数字信号处理器(DSPs)和微处理器。
许多使用功能强大的图形化编程语言LabVIEW的用户亲切的称之为“G”语言(取自graphical),LabVIEW能够让你的开发效率提高几个数量级。
使用传统语言可能需要几周或者几个月才能完成的程序,如果用LabVIEW编写,几个小时就能完成,其中一个原因是LabVIEW是专为用户设计的,用来进行测量,分析数据和显示结果。
另一个原因是LabVIEW有丰富的图形化用户接口(GUI),使用这些接口使变成变得很容易。
它也非常适合用来进行仿真,表述思想,编写一般程序,或者讲述基本编程概念。
LabVIEW可以提供比标准的实验室仪器更加灵活的仪器,因为这种仪器是基于软件的,是由你来定义仪器的功能,而不是由仪器制造来定义。
为了完成你的任务,一个完整的虚拟仪器配置包括:你的电脑,即插即用的硬件和LabVIEW。
使用LabVIEW你能够准确的创建你所需要的虚拟仪器,这种仪器的价格是传统仪器价格的几分之一。
Labview简易程序设计
Labview简易程序设计Labview简易程序设计LabVIEW(Laboratory Virtual Instrument Engineering Workbench)是一种基于图形化编程语言G代码的数据采集、仪器控制和工业自动化系统软件平台。
本文介绍了LabVIEW的简易程序设计方法,以帮助读者快速入门LabVIEW开发。
1. LabVIEW简介LabVIEW是由美国国家仪器公司(National Instruments)开发的一种图形化编程语言和环境。
它通过将函数块在一起构成程序流程图,使得开发人员能够用图形化方式表达程序逻辑。
LabVIEW广泛应用于实验室测量与控制、工业自动化、生物医学工程等领域。
2. LabVIEW程序的基本结构LabVIEW程序由前端GUI界面和后台程序逻辑组成。
前端GUI界面包括用户界面控件,用于输入数据和显示结果;后台程序逻辑则是执行实际的计算、数据处理和仪器控制等任务。
2.1 GUI界面设计在LabVIEW中,GUI界面设计采用拖拽式编程,即通过将各种控件从工具栏拖拽到屏幕上并进行配置来构建用户界面。
常用的控件有按钮、文本框、图表等。
2.2 程序逻辑设计LabVIEW中的程序逻辑设计采用数据流方式,即程序的执行是根据数据的可用性自动进行的。
在程序中,各个函数块称为节点,其输入和输出通过连线连接起来。
使用节点和连线可以构成程序的流程图。
3. LabVIEW程序的基本编程元素3.1 节点节点是LabVIEW程序中的基本编程单元,代表了执行特定操作的函数或算法。
通过在程序中添加不同类型的节点,并将它们按照适当的顺序连接起来,可以构建出复杂的程序逻辑。
3.2 连线连线用于在节点之间传递数据。
在连接节点时,需要将输出端口和输入端口以连线的方式连接在一起,这样数据才能够在节点之间流动。
3.3 常量常量是指在程序运行过程中数值不变的值。
在LabVIEW中,可以使用常量节点来表示常量值,并将其输出连接到其他节点的输入端口。
labview课件教程2第三章前面板与程序框图

(a)
(b)
图3-13 新型(a)及经典(b)下拉列表和枚举控件选板
3.1.9 容器控件
位于容器和经典容器选板上的容器控件可用于组合 控件,或在当前VI 的前面板上显示另一个VI 的前 面板。(Windows) 容器控件还可用于在前面板上显 示.NET 和ActiveX 对象。LabVIEW2010简体中文版 的新型及经典下拉列表和枚举控件如图3-14所示。
3.1.12 NET与ActiveX控件
位于.NET与ActiveX 选板上的.NET和ActiveX 控 件用于对常用的.NET或ActiveX 控件进行操作。 可添加更多.NET或ActiveX 控件至该选板,供日 后使用。选择“工具”>>“导入”>>“.NET控件 至选板或工具”>>“导入”>>“ActiveX控件至选 板”,可分别转换.NET 或ActiveX 控件集,自定 义控件并将这些控件添加至.NET与ActiveX 选 板。.NET与ActiveX控件位于容器选板中,可参见 图3-14。
3.2 设置前面板对象的属性
上一节主要介绍了设计前面板用到的控件选板, 在用LabVIEW进行程序设计的过程中,对前面板 的设计主要是编辑前面板控件和设置前面板控件 的属性。为了更好的操作前面板的控件,设置其 属性是非常必要的,这一节将主要介绍设置前面 板控件属性的方法。
不同类型的前面板控件有着不同的属性,下面分 别介绍设置数值型控件、文本型控件、布尔型控 件以及图形显示控件的方法。
3.1 前面板控件
前面板是VI的用户界面。前面板如图3-1所示。
图3-1 VI的前面板
3.1.1 控件样式
1.新式及经典控件
LabVIEW for Engineers 使用教程及界面介绍翻译

LabVIEW for Engineers 使用教程及界面介绍翻译LabVIEW,全称Laboratory Virtual Instrument Engineering Workbench,是一款由美国国家仪器(National Instruments)公司开发的,用于工程领域数据采集、控制与测量的可视化编程语言和开发环境。
LabVIEW以其直观的图形化编程界面和丰富的工具箱,被广泛应用于控制系统、测试与测量、自动化以及科学研究等多个工程领域。
本文将为工程师提供一份详尽的LabVIEW使用教程,帮助他们快速上手并熟悉LabVIEW的界面和基本功能。
一、LabVIEW界面介绍与布局LabVIEW的主界面由多个窗口构成,主要包括前面板(Front Panel)窗口和代码编辑窗口(Block Diagram)。
1. 前面板窗口前面板窗口是LabVIEW中用户与程序交互的界面,用于显示变量、控件和指示器等元素。
用户可以通过简单的拖拽、编辑和连接操作,创建图形化的用户界面。
2. 代码编辑窗口代码编辑窗口中展示了程序的控制逻辑和数据处理流程。
用户可以通过拖拽、连接、编写代码等方式,创建程序的功能模块和算法。
二、LabVIEW基础功能介绍1. 数据采集与控制LabVIEW支持多种数据采集设备的连接和控制,如传感器、转换器、电机等。
用户可以利用LabVIEW提供的丰富的工具和函数,读取和处理这些硬件设备的数据,实现实时的数据采集与控制。
2. 数据处理与分析LabVIEW内置了多种数据处理和分析的工具箱,包括滤波、傅里叶变换、曲线拟合等。
用户可以利用这些工具进行数据处理、提取特征、进行统计分析等操作。
3. 图像处理与计算机视觉LabVIEW提供了图像处理和计算机视觉的功能模块,用户可以通过这些模块实现图像的采集、处理、分析和识别等操作。
这为机器视觉、图像处理等相关领域的工程师提供了便利。
4. 控制系统设计与仿真LabVIEW支持控制系统的设计、模拟和调试。
基于labview的画图程序

目录1 目的及基本要求 (1)2 画图程序原理 (1)2.1 基本原理 (1)2.2 流程图 (1)3画图程序设计 (2)3.1 总体程序设计 (2)3.2 各功能模块详细设计 (3)4 结果及性能分析 (7)4.1 运行结果 (7)4.2 性能分析 (8)5 设计总结与体会 (8)参考文献 (8)1 目的及基本要求熟悉LabVIEW开发环境,掌握基于LabVIEW的虚拟仪器原理、设计方法和实现技巧,运用专业课程中的基本理论和实践知识,采用LabVIEW开发工具,实现基本的画图功能。
基本要求:本设计要做一个能够画出直线等图形的画图界面,在界面中不仅可以改变线条颜色,还可以进行返回修改。
2 画图程序原理2.1 基本原理在VI程序前面板中添加直线,矩形,圆,椭圆以及三角形部件,然后使用六个滑杆类的属性并分成两组,来控制线条颜色,最后添加返回按钮和画图面板,线条颜色显示板,整个程序要用到while循环结构,条件结构,事件结构,元素同址结构。
2.2 流程图画图程序流程图选择图形移动鼠标在面板上画图结束图1画图程序流程图3画图程序设计3.1 总体程序设计在VI程序前面板中分别添加颜色显示控件和面板控件,颜色显示控件可使线条颜色清晰地展现在我们眼前;而面板则是为了画出我们想要的图形做准备。
其他的图形控件使此画图程序多样化,增加了图形的可选择性,颜色则由六种基色混合而成,使线条颜色选择更符合使用者要求。
(1)主程序前面板框图如下:图2画图程序前面板(2)主程序执行时后面板设计如下:图3执行时的后面板3.2 各功能模块详细设计(1)改变color值时创建一个子VI,在程序框图中添加一个while循环结构,while循环结构中要用到条件结构,条件结构中要用到事件结构,事件结构中又要用到元素同址结构。
控件图如下:图4 color值发生改变(2)颜色混合值变化当开始执行后,改变红蓝绿三种颜色的组成比例时,画面上的线条显示也会发生相应的变化,出现的颜色是三种颜色的混合效果。
外文文献翻译-LabVIEW程序框图设计
LabVIEW程序框图设计摘要:一个真正好的程序就像一件艺术品一样,而差的程序看起来就像意大利面那样乱。
这篇文章提出的风格能确保我们实际应用中在规定时间内开发出整洁,结构清晰的程序。
结合其他规则,我们能开发出可读性好的,易于维护的LabView源代码。
LabVIEW的程序框图长于源代码表述。
一个真正好的程序是发人深省的,甚至是令人敬畏的,就是一件艺术品一样。
而一个差的程序,看起来就像一碗意大利面条那样凌乱。
事实上,这两种极端的情况就像《风格的重要性》中Meticulous VI 和 Spaghetti VI所表现的那样。
而大部分程序处于艺术品和意大利面条之间。
一些程序开发者有连线整齐的习惯,但程序框图往往却大而宽泛。
其他的一些程序开发者却过度使用模块化编程,就像自己在搭建筑一样。
而仍有一些编程人员喜欢使用变量方式而非数据流方式。
很多很多开发人员在文档上节省时间。
此外,很多程序是在好的风格和节约时间两者之间取得平衡下为特征下完成工作的。
总体结论就是在吸引人的程序外观,个人喜好和程序功能上取得折中。
大多数开发人员都错误认为吸引人的程序编写上受到许多束缚使开发进度变慢,而现实中程序开发都有时间限制。
似乎快速开发程序的和程序具有美感是相矛盾的。
事实上,多花些时间来优化复杂程序的外观是可能的如果你知道什么才是好的风格所要遵循的规则和如何执行这些规则,你将会在程序开发中更加轻松。
屏幕分辨率决定程序开发人员在开发程序时的可见区域和程序移植到用户计算机后的界面显示。
因此,将程序分辨率统一是非常有好处的,那样应用程序在使用相同分辨率的PC上打开时窗口界面将保存一致。
程序分辨率设置得越高,界面上的控件将根据屏幕大小相应的缩小,屏幕上也能容纳更多的程序代码。
合适的屏幕分辨率是不仅要能使程序的可见区域最大化,而且不能让你的眼睛不舒服。
LabView开发环境设定的最小程序分辨率为1024*768。
与PC显示技术发展相适应的1280*1024的屏幕分辨率能提供更多的可视区域。
- 1、下载文档前请自行甄别文档内容的完整性,平台不提供额外的编辑、内容补充、找答案等附加服务。
- 2、"仅部分预览"的文档,不可在线预览部分如存在完整性等问题,可反馈申请退款(可完整预览的文档不适用该条件!)。
- 3、如文档侵犯您的权益,请联系客服反馈,我们会尽快为您处理(人工客服工作时间:9:00-18:30)。
LabVIEW程序框图设计摘要:一个真正好的程序就像一件艺术品一样,而差的程序看起来就像意大利面那样乱。
这篇文章提出的风格能确保我们实际应用中在规定时间内开发出整洁,结构清晰的程序。
结合其他规则,我们能开发出可读性好的,易于维护的LabView源代码。
LabVIEW的程序框图长于源代码表述。
一个真正好的程序是发人深省的,甚至是令人敬畏的,就是一件艺术品一样。
而一个差的程序,看起来就像一碗意大利面条那样凌乱。
事实上,这两种极端的情况就像《风格的重要性》中Meticulous VI 和 Spaghetti VI所表现的那样。
而大部分程序处于艺术品和意大利面条之间。
一些程序开发者有连线整齐的习惯,但程序框图往往却大而宽泛。
其他的一些程序开发者却过度使用模块化编程,就像自己在搭建筑一样。
而仍有一些编程人员喜欢使用变量方式而非数据流方式。
很多很多开发人员在文档上节省时间。
此外,很多程序是在好的风格和节约时间两者之间取得平衡下为特征下完成工作的。
总体结论就是在吸引人的程序外观,个人喜好和程序功能上取得折中。
大多数开发人员都错误认为吸引人的程序编写上受到许多束缚使开发进度变慢,而现实中程序开发都有时间限制。
似乎快速开发程序的和程序具有美感是相矛盾的。
事实上,多花些时间来优化复杂程序的外观是可能的如果你知道什么才是好的风格所要遵循的规则和如何执行这些规则,你将会在程序开发中更加轻松。
屏幕分辨率决定程序开发人员在开发程序时的可见区域和程序移植到用户计算机后的界面显示。
因此,将程序分辨率统一是非常有好处的,那样应用程序在使用相同分辨率的PC上打开时窗口界面将保存一致。
程序分辨率设置得越高,界面上的控件将根据屏幕大小相应的缩小,屏幕上也能容纳更多的程序代码。
合适的屏幕分辨率是不仅要能使程序的可见区域最大化,而且不能让你的眼睛不舒服。
LabView开发环境设定的最小程序分辨率为1024*768。
与PC显示技术发展相适应的1280*1024的屏幕分辨率能提供更多的可视区域。
不要采用高于1280*1024的分辨率,因为当前还不广泛支持如此高的分辨率,更大的工作区域也意味者程序框图更大,模块化程度降低。
同时,取决于显示器的大小,如果过高的分辨率容易使你的眼睛疲劳。
今天许多计算机都支持多显示器。
在LabView开发环境采用两个显示器是非常有好处的。
使用一个显示器来显示前面板,另外一个显示器来显示程序框图。
这样就能同时看到这两个窗口,而不需要在前面板和程序框图之间进行切换。
不要给程序框图着色。
界面的背景色和每个结构的子界面都默认为白色。
数据流向必须非常容易识别。
我们希望对象尽量布局紧凑,但同时不希望对象靠得太近引起对象和连线重叠。
总之,尽量缩小程序框图大小使之能在一个屏幕显示出来。
在某些情况下,比如说某些复杂的程序包含很多个并行循环,要满足这个限定非常困难。
在这种情况下,调整程序框图,或者将一些循环变成子VI来减小所占背面板空间,使背面板仅在一个方向上滑动。
开发程序时,VI之间应采用从上至下和自下而上相结合的方法来构建多层次结构关系。
VI的层次结构可以通过选择View»VI Hierarchy来查看。
从窗口的工具条中取消选择包括VI Lib ,包括全局变量和包括自定义类型,并且只显示你自己提供的用户VI。
通常的几何形状包括金字塔形,钻石形和椭圆形。
除了非常简单的应用程序外,VI层次结构中在顶层VI之下的应包含多行子VI。
在第一章中,模块化率被定义为是用户VI数与总的节点数之比,再乘100。
这些数据的大小可以通过选择Tools»Profile»VI Metrics快速查看到。
典型应用程序的模块化率推荐为3.0以上。
取决于设计样式,许多顶层程序都应包含结构,连线,VI组件和子VI。
VI组件是处于非常高层的子VI,或者是将一个应用程序的主要部分或子系统封装为插件后动态调用的VI。
一个应用程序的图形用户见面和数据采集引擎是以单独的vi实现的,它们就是组件VI的一个例子。
顶层和高层vi应该尽可能减少的低层数据处理函数,例如数学函数,数组处理,格式化字符串以及类似的函数。
一些应用程序需要大量的数值属性节点来控制GUI行为。
许多属性节点的读写操作是由GUI事件触发。
因此,事件结构是理想的处理属性节点的结构。
因为,事件结构为每个事件分支包含一个单独的子程序,通常一个事件分支的程序不会跑到其他的事件分支。
然而,多事件分支需要许多个相同的属性节点,它们的值因每次读写操作而不同。
将这些普通的属性节点模块化为子VI,通过控件引用和属性值传递到子VI中。
每个子VI程序代表在内存中同一属性节点的备份。
这减小了内存使用和程序复杂性。
同样的,将你程序中的高层组件模块化为较低级的子VI。
使用自顶向下的设计和开发方法,将任何低层程序模块化为强内聚的子VI。
在任何的地方如果你用到了已有代码的副本来共同构成一个程序,将这些代码替换成子VI。
一个子VI是否是内聚的要看你是否能将它要完成的工作清楚的描述为两三句话,就像子VI描述信息那样。
子VI非常有用,因为相对于一个大型程序来说,它易于开发,测试,调试,维护和代码重用。
如图4-2C所示,子VI也为程序开发中节省了可观的背面板空间。
总之,如果同一函数,属性节点,程序被多次用到,将这些重复代码换成子VI将使程序开发变简单。
同样,如果几个没用被重复使用的节点彼此相关,并且一起完成某项工作,不管它们是否被多次用到,也将它们变为一个内聚的子VI。
但是,也不要为了节省空间而随便选择将程序的某部分变成子VI。
以这种方式创建的子VI不是内聚的,也不够直观并且不可重用。
同样也不要为只有少量接线端的程序代码创建子VI。
这种情况,子VI图标不需要在程序框图掩盖它下层的代码。
子VI只包含一个数组索引函数。
然而,子VI的图标,名字和描述信息掩盖数组索引函数。
LabView函数和将子VI打包成的VI.lib通常是可识别的,因而不需再单独将它们封装成子VI。
为每个子VI创建一个有含义的图标和相结合的描述。
住为每个子VI创建一个有含义的图标和相结合的描述。
再怎么强调它的重要性都是不够的。
这是我们最神圣的信条。
图标和描述信息能帮助我们在调用这些子VI的程序时通过帮助窗口的文字识别这些子VI。
这些描述迫使我们进行内聚性测试。
如果你不能通过2到3句话总结子VI的功能,子VI可能包含了太多的子代码。
隧道连线通过结构左侧边界进入结构,并从结构的右侧边界穿过结构。
不要让隧道在结构的顶部或底部穿过。
同样如果结构内部未使用到也不要让连线穿过结构,除非其目的是为了标示清楚。
特别令人困苦的是浏览一个多帧结构的许多帧时,要去寻找那些在连线上被修改的数据,比如说条件结构或者是事件结构。
然而,有时条件结构通过一些额外的连线线是非常有用的将没有连线的前面板控件在程序框图上放在一起,那样程序开发人员就能非常容易的将找到它们。
标记那些在程序只用到一次,不在循环结构中的接线端。
实践中大多数局部变量,全局变量和顺序结构都不是必要的。
没有学习过有效数据流法则的开发者经常过多地使用局部变量和全局变量。
强迫自己避免使用变量和顺序结构是最有效的掌握数据流的方法,除非完全必要要用到它们。
的确,掌握数据流和尽可能避免使用变量和顺序结构具有相同的含义。
为了避免连线混乱且保持有组织秩序,紧凑地放置移位寄存器且将它们聚集到靠近循环的顶部。
这样如同在靠近循环顶端位置有限的区域内修建一条数据公路且使线路交叉最少。
除了聚合了包括错误簇和条件选择器的移位寄存器外。
只要在移位寄存器之间留下刚好够放置自由标签的位置就行了,这些标签将被放置在靠近移位寄存器左边终端的线上。
错误簇经常在循环的底部进出,而条件选择器经常处于中间位置。
因此,错误簇和条件选择器经常与靠近循环顶部的数据公路是分离的。
最糟的编程习惯是从一个选定区域创建一个VI而且不清理创建子VI后的狼藉场面。
终端位置,标签,线,连接器分配,图标以及描述文档都需要进行矫正。
有时这样还会导致子VI的程序结构图就像在里面投了一颗炸弹一样。
用这种工具创建的子VI从来就不是一个好的风格而且程序必须改写。
关闭检查展示出从右向左的线是一个文件路径,它是由Case结构里面的若干底层函数所形成的。
不管怎样,在顶层VI上由若干底层函数共同组成以完成某种功能的程序最好用一个子VI的形式出现。
这篇文章提出的风格能确保我们实际应用中在规定时间内开发出整洁,结构清晰的程序。
结合其他规则,我们能开发出可读性好的,易于维护的LabView源代码。
而且,遵守这些好的编程风格所要求的准则将可能会使我们开发出令人赞叹的LabView程序。
The LabVIEW Program Diagram DesignABSTRACT:A really good diagram is like a work of art. Some developers have neat wiring practices but large, flat diagrams. This chapter presents style rules that ensure neat and organized diagrams that are practical to implement in real applications with tight deadlines. Combined with the rules in other chapters, they ensure readable and maintainable LabVIEW source code The LabVIEW block diagram excels at conveying source code. A really good diagram is enlightening, even awe-inspiring, like a work of art. Some developers have neat wiring practices but large, flat diagrams. Others have overly modular diagrams that disguise the architecture. . Indeed, these two extremes are depicted by Meticulous VI and Spaghetti VI in Chapter 1, "The Significance of Style." Somewhere in the middle between artwork and spaghetti is where most applications reside. Still others prefer variables over data flow. Many, many developers skimp on documentation to save time. Moreover, most diagrams are characterized by tradeoffs between good style and shortcuts deemed necessary to get the job done. The overall outcome is a compromise among attractive appearance, personal preferences, and functional performa nce.Many developers wrongfully assume that attractive diagrams require a level of toil that is impractical for real-world applications that have tight deadlines. It seems faster and more productive to avoid getting caught up in diagram aesthetics. Indeed, it is possible to expend excessive time optimizing the appearance of a complex diagram, If you know the style rules and how to implement them, you eliminate the toil.The LabVIEW development environment is designed for a minimum 1024x768 resolution. A resolution of 1280x1024 provides additional real estate while maintaining compatibility with mainstream PC display technology. Avoid resolutions much higher than 1280x1024 because higher resolutions are less universally supported, and the larger work area promotes larger diagrams and potentially less modularity. Also, depending on the monitor size, very high resolutions may strain your eyes.The display resolution affects the visible area the developer has to work with and how the diagram appears when opened on a given target computer. It is beneficial to standardize on one display resolution so that the diagram window maintains a consistent appearance when opened on PCs with similar display capabilities. The higher the resolution setting, the smaller the diag ram objects shrink relative to the screen size, and the more code fits on one screen. A fairly high resolution is recommended to maximize the viewable diagram area without straining your eyes. Today many computers support multiple monitors. It is particularly useful to utilize two monitors for LabVIEW development. This allows you to dedicate one monitor to the front panel and the other monitor to the block diagram, and have both windows simultaneously visible without having to navigate between them.Do not color the diagrams. Leave the background of the diagram, and every subdiagram of every structure, default white. Data flow must be easy to visualize. A high density of objects is desired, without crowding objects too close and causing wires and objects to overlap. In general, try to limit the diagram size to one display screen. In some situations, it is difficult to work within this constraint, such as a complex diagram containing multiple parallel loops. In this case, organize the large diagram so that it may be viewed by scrolling in only one direction, or modularize the loops into subVIs to reduce space.Develop your applications as a multilayer hierarchy of subVIs using a combination of top-down and bottom-up design and development techniques. The VI Hierarchy is viewed by selecting View»VI Hierarchy. Deselect Include VI Lib, Include Globals, and Include typedef from the toolbar to remove these items from the window, and view only the hierarchy of user VIs that you provided. Common geometries include pyramid, diamond, and oval. Except for very simple applications, the VI Hierarchy should contain multiple rows of subVIs below the top-level VI. In Chapter 1, the modularity index was defined as the ratio of the number of user VIs to total nodes, multiplied by 100. These quantities are quickly referenced using the VI Metrics window, selected from Tools»Profile»VI Metrics. A modularity index of 3.0 or greater is recommended for a typic al application.Depending on the design pattern, most top-level diagrams should consist of structures, wires, component VIs, and subVIs. Component VIs are very high-level subVIs, or dynamically loaded plug-in VIs, that encapsulate a major portion or subsystem of the application. An application's graphical user interface and data acquisition engine, implemented as separate VIs, are examples of component VIs. The top-level and high-level diagrams should contain very few low-level data-manipulation functions, such as math, array manipulations, string formatting, and similar functions.Some applications require large numbers of Property Nodes for controlling GUI behavior. Most Property Node read and write operations are triggered by GUI events. Consequently, the Event structure is an ideal construct for handling Property Nodes. Because the Event structure contains separate subdiagrams for each event case, it is uncommon to run out of space. However, it is common to have multiple event cases that require many of the same Property Nodes, with different values read or written to them in each. Modularize these common Property Nodes into subVIs, and pass the Control References and property values to the subVI in each location. Each instance of the subVI refers to the same collection of Property Nodes in memory. This substantially reduces memory use and diagram complexity.Likewise, modularize the diagrams of your high-level component VIs into lower-level subVIs. Using the top-down design and development approach, modularize any low-level routines into cohesive subVIs. Anywhere you have a collection of related functions that work together to perform a specific routine, replace them with a subVI. A subVI is cohesive if you can clearly describe its purpose in two or three sentences, such as when entering the subVI's description.SubVIs are advantageous because it is easier to develop, test, debug, maintain, and reuse software modules as subVIs versus sections of a large diagram. As shown in Figure 4-2C, they also provide a considerable space-saving benefit. In general, if the collection of functions or Property Nodes or other routine is used in more than one place, it is an easy decision: Replace the repeated code with a subVI. Likewise, if several nonrepetitive nodes are related to one another and work together to perform a specific task, modularize them into cohesive subVIs, whether they are needed in multiple places or not. However, do not randomly select areas of the diagram and create subVIs just to save space. SubVIs created in this manner are not cohesive, intuitive, or reusable. Also, do not create trivial subVIs that contain few nodes. In this case, the subVI icon unnecessarily masks the underlying code on the diagram. For example, the subVI in Figure 4-3 contains only a single Index Array function. However, the subVI's icon, name, and descr iption disguise the function. The LabVIEW functions and shipping subVIs within vi.lib are universally recognizable, so avoid masking them within trivial subVIs.Create a meaningful icon and cohesive description for every subVI!Always create a meaningful icon and cohesive description for every subVI. I cannot emphasize this enough. At Bloomy Controls, this is one of our most sacred precepts. The icon and descriptio n identify the subVI from the diagram of the calling VI through the Context Help window. The description enforces the cohesion test. If you cannot summarize its purpose in two or three sentences, it probably contains too much code for one subVITunnel wires into structures through their left border, and out of structures through their right border. Avoid tunneling wires through the top and bottom borders. Also avoid passing wires through structures if they are not utilized within the structure, unless their purpose is clearly labeled. It is particularly annoying to flip through many frames of a multiframe structure, such as a Case or an Event structure, searching for places where the data in the wire is modified.Place any unwired terminals of front panel objects in a consistent location on the diagram so that developers can find them easily. Note that any terminals not contained by a repeating structure are read only once.Most local and global variables and Sequence structures used in practice are not neces sary. Most often, they are overused by developers who have not learned efficient dataflow principles. The best way to master data flow is to force oneself to avoid variables and Sequence structures unless absolutely required. Indeed, mastering data flow is synonymous with minimizing variables and Sequence structures.To avoid wire clutter and maintain organization, space most shift registers tightly, and group them near the top of the loop. This creates a data highway that is limited to an area near the top of the loop and minimizes wire crossovers. Leave just enough space between the shift registers to apply free labels on each wire near the left terminals. Exceptions to shift register grouping include error clusters and case selectors. Error clusters normally enter and exit near the bottom of loops. Also, case selectors are frequently positioned near the middle. Therefore, error clusters and case selectors are usually kept separate from the data highway at the top.For example, the task ID and error control terminals are improperly labeled task ID out and error out. Additionally, one of the indicators has the generic label Numeric. What is curious is that the subVI has a custom icon and description, and the control terminals are within reasonable proximity to the structure. Perhaps it was partially repaired. The wiring and terminal labels have been cleaned up in Figure 4-14B. Also, Figure 4-14C contains equivalent code using the waveform data type and the newer sound output VIs released with LabVIEW 8. This is the preferred implementation.Close inspection reveals that the right-to-left wire is a file path that is formed by some low-level functions within an inner Case structure. Whenever a collection of low-level functions that work together to perform a cohesive routine appears on the diagram of a high-level VI, it is a good opportunity for a subVI,This chapter presents style rules that ensure neat and organized diagrams that are practical to implement in real applications with tight deadlines. Combined with the rules in other chapters, they ensure readable and maintainable LabVIEW source code. Moreover, mastery of these style rules may lead to awe-inspiring LabVIEW diagrams.。